Comparison of Statistical Methods for Optimization of Salts in Medium for Production of Carboxymethylcellulase of Bacillus amyloliquefaciens DL-3 by a Recombinant E. coli JM109/DL-3
You-Jung Lee
1,2, Hye-Jin Kim
1,2, Wa Gao
1,2, Chung-Han Chung
2,3and Jin-Woo Lee
2,3*
1
Department of Medical Bioscience, Graduate School of Dong-A University, Busan 604-714, Korea
2
BK21 Bio-Silver Program of Dong-A University, Busan 604-714, Korea
3
Department of Biotechnology, College of Natural Resources and Life Science, Dong-A University, Busan 604-714, Korea
Received June 10, 2011 /Revised September 2, 2011 /Accepted September 5, 2011The optimal concentrations of salts in medium for cell growth and the production of carbox- ymethylcellulase (CMCase) by a recombinant E. coli JM109/DL-3 were established using two statistical methods: orthogonal array method (OAM) and response surface method (RSM). The analysis of var- iance (ANOVA) of data based on OAM indicated that K
2HPO
4gave maximum sum of square (S) and percentage contribution (P) for cell growth as well as production of CMCase. The optimal concen- trations of K
2HPO
4, NaCl, MgSO
4∙7H
2O, and (NH
4)
2SO
4in medium for cell growth extracted by Qualitek-4 (W32b) Software were 10.0, 1.0, 0.2, and 0.6 g/l, respectively, whereas those for the pro- duction of CMCase by E. coli JM109/DL-3 were 5.0, 1.0, 0.4, and 0.6 g/l. The analysis of variance (ANOVA) resulting from RSM indicated that a highly significant salt for cell growth was K
2HPO
4(“probe>F” less than 0.0001), whereas K
2HPO
4and MgSO
4∙7H
2O were significant for the production of CMCase. The optimal concentrations of K
2HPO
4, NaCl, MgSO
4∙7H
2O, and (NH
4)
2SO
4for cell growth extracted by Design Expert Software were 7.44, 1.08, 0.22, and 0.88 g/l, respectively, whereas those for production of CMCase were 5.84, 0.69, 0.28, and 0.54 g/l. The optimal concentrations of salts and their influences on cell growth and production of CMCase extracted by OAM were almost the same as those by RSM. Production of CMCase by a recombinant E. coli JM109/DL-3 under optimized concentration of salts was 1.93 times higher than that by Bacillus amyloliquifaciens DL-3.
Key words : Carboxymethylcellulase, E. coli JM109, optimization, orthogonal array method, response surface method, salts
*Corresponding author
*Tel:+82-51-200-7593, Fax:+82-51-200-7505
*E-mail : [email protected]
Introduction
Conversion of cellulosic materials to fermentable sugars represents a major challenge in global efforts to utilize re- newable resources [2,3]. The complete enzymatic hydrolysis of cellulosic materials for production of fermentable sugars needs at least three different types of cellulases; endogluca- nase (carboxymethylcellulase), exocellobiohydrolase (avicelase), and β-glucosidase [28]. The enzymatic saccha- rification of lignocellulosic materials for the production of ethanol was performed by commercial cellulases, in which the major cellulase was carboxymethylcellulase (CMCase) [25,26]. A major restriction in enzymatic saccharification of cellulosic biomass for the production of fermentable sugars is low productivity and the cost of cellulases [23].
Most commercial cellulases have been produced by
Aspergillus and Trichoderma species with solid-state cultures [7]. Many studies on types of strains, culture conditions, and substrates for production of cellulases have been reported [12,15]. However, there have been few reports on optimization of mineral salts in the medium for production of cellulases. Genes encoding cellulases of Trichoderma reesei was cloned and expressed in Aspergillus oryzae [24]. The production of cellulases by recombinant A. oryzae was several to hundreds times higher than T. reesei. The full-length gene encoding the CMCase of B. amyloliquefaciens DL-3 was cloned in E. coli JM109 in the previous report [17].
The optimization of culture conditions by the traditional one-factor-at-a-time method requires a considerable amount of work and time. An alternate strategy is a statistical approach such as orthogonal array method (OAM) and response surface method (RSM), involving the minimum number of experiments for a large number of factors [4,22].
In this study, OAM and RSM were used to optimize
concentrations of salts in medium for production of CMCase
of B. amlyloliquefaciens DL-3 by a recombinant E. coli JM109/DL-3 and results from two methods were compared.
Materials and Methods Bacterial strain and medium
E. coli JM109/DL-3 was used to produce carboxy- methylcellulase (CMCase) in this study. The open reading frame (ORF) of the cloned CMCase gene of B.
amyloliquefaciens DL-3 consists of 1497 nucleotides encoding a protein of 499 amino acids with a predicted molecular weight of 55,118 Da [17]. E. coli JM109/DL-3 was grown at 37℃ in Luria-Bertani (LB) broth supplemented with 50 μ g/ml ampicillin.
Production of CMCase by E. coli JM109/DL-3
Starter cultures were prepared as described in the previous report [17]. The main culture was carried out in a medium containing 58 g/l rice bran, 5.0 g/l tryptone, 5.0 g/l K
2HPO
4, 1.0 g/l NaCl, 0.2 g/l MgSO
4∙7H
2O, and 0.6 g/l (NH
4)
2SO
4at 37℃ for 3 d under aerobic conditions.
Experimental design using orthogonal array method
Design of experiments (DOE) was performed based on orthogonal array method for optimization of four slats - K
2HPO
4, NaCl, MgSO
4∙7H
2O, and (NH
4)
2SO
4- in the medium using Qualitek-4 (W32b) Software (Nutek, Inc., Bloomfield Hills, USA), which was used for automatic design of experiments, analysis of results, and calculation of interactions among different factors [22]. The L
16(4
4) orthogonal array experiment used in this study had 4 factors and each factor had 4 different levels. These trials were done in three replicates. Results from optimization for production of CMCase were statistically analyzed using one-way analysis of variance (ANOVA).
Experimental design using response surface method
The K
2HPO
4(X
1), NaCl (X
2), MgSO
4∙7H
2O (X
3), and (NH
4)
2SO
4(X
4) were chosen as the independent variables and each variable was designated as −1, 0, and 1, respectively. Cell growth (Y
1, g/l) and CMCase activity (Y
2, U/ml) were used as a dependent output variable. The total number of experiments was 30 (=2
k+2k+6), where k is the number of independent variables [18]. Values of cell growth and production of CMCase were taken as the responses of the design experiment. Statistical analysis of the model was
performed to evaluate the analysis of variance (ANOVA).
A multiple regression analysis of the data was carried out with the statistical software, Design-Expert Version 7.1.6 (Stat-Ease Inc., Minneapolis, USA).
Analytical methods
Dry cells weight was measured as described in the previous report [12]. Activity of the CMCase produced by E. coli JM109/DL-3 was determined based on the release of reducing sugar from CMC using the 3,5-dinitrosalicylic acid (DNS) method, as described in the previous report [14].
Glucose (Sigma-Aldrich, UK) was used to prepare a calibration curve. One unit of each CMCase was defined as the amount of enzyme that released 1 µmol of glucose equivalent per minute under the assay condition.
Results and Discussion
Optimization of salts by one-factor-at-a-time method The optimal concentrations of K
2HPO
4, NaCl, MgSO
4∙7H
2O, and (NH
4)
2SO
4in the medium were investigated using ‘one-factor-at-a time’ experiments.
Composition of basic medium and culture conditions for
‘one-factor-at a time’ experiment were 58.0 g/l rice bran, 5.0 g/l tryptone, initial pH of 7.1, and temperature of 37℃. The optimal concentrations of K
2HPO
4, NaCl, MgSO
4∙7H
2O, and (NH
4)
2SO
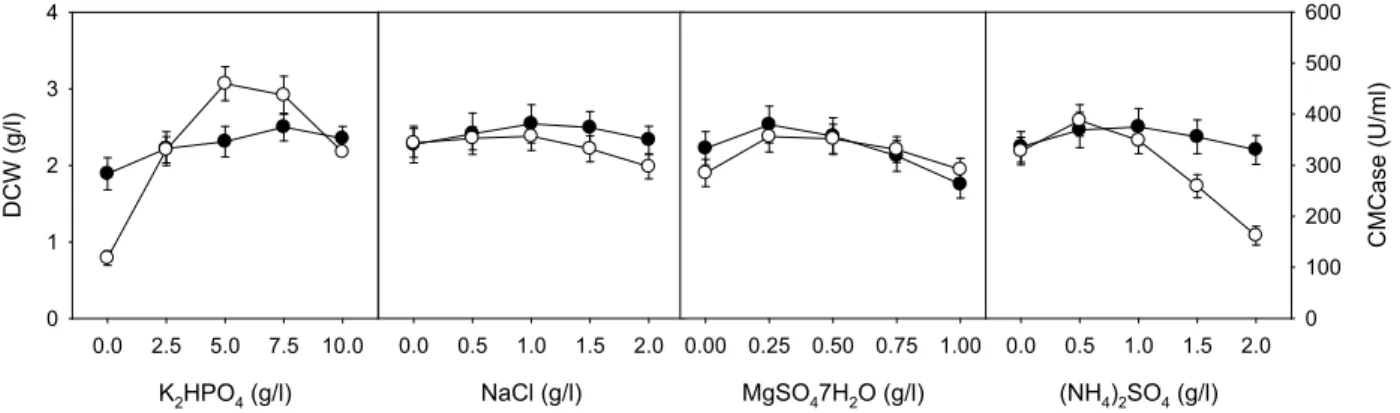
4for cell growth were 7.5, 1.0, 0.25, and 1.0 g/l, respectively, whereas those for the production of CMCase by E. coli JM109/DL-3 were 5.0, 1.0, 0.25, and 0.5 g/l, as shown in Fig. 1. The optimal concentrations of four salts for cell growth were different from those for production of CMCase. The optimal concentrations of four salts for cell growth and the production of CMCase by B. amyloliquefaciens DL-3 were 5.0, 1.0, 0.2, and 0.6 g/l, respectively [12].
Optimization of salts using orthogonal array method
The simultaneous effect of K
2HPO
4, NaCl, MgSO
4∙7H
2O,
and (NH
4)
2SO
4in the medium on cell growth and the pro-
duction of CMCase by E. coli JM109/DL-3 was investigated
using L
16(4
4) orthogonal array design, as shown in Table
1. Cell growths and the productions of CMCase by E. coli
JM109/DL-3 from sixteen different conditions ranged from
2.35 to 2.56 g/l and from 306.3 to 398.9 U/ml, as shown
in Table 2. The analysis of variance (ANOVA) for ex-
perimental results obtained by L
16(4
4) orthogonal array
K2HPO4 (g/l) 0.0 2.5 5.0 7.5 10.0
DCW (g/l)
0 1 2 3 4
NaCl (g/l) 0.0 0.5 1.0 1.5 2.0
MgSO47H2O (g/l) 0.00 0.25 0.50 0.75 1.00
(NH4)2SO4 (g/l) 0.0 0.5 1.0 1.5 2.0
CMCase (U/ml)
0 100 200 300 400 500 600
Fig. 1. Effect of four salts in the medium on cell growth and production of CMCase by
E. coli
JM109/DL-3 (●, Dry cell weight and ○, CMCase activity).Table 2. Simultaneous effect of mineral salts in the medium on cell growth and the production of CMCase by
E. coli
JM109/DL-3 designed using Qualitek-4 (W32b) software based on L16 (44) orthogonal array experimentRun K2HPO4
(g/l) NaCl
(g/l) MgSO4∙7H2O
(g/l) (NH4)2SO4
(g/l) DCW
(g/l) CMCase
(U/ml)
1 2.5 0.5 0.1 0.3 2.35 311.3
2 2.5 1.0 0.2 0.6 2.46 346.2
3 2.5 1.5 0.4 1.2 2.43 324.3
4 2.5 2.0 0.8 2.4 2.36 306.3
5 5.0 0.5 0.2 1.2 2.41 386.6
6 5.0 1.0 0.1 2.4 2.36 360.8
7 5.0 1.5 0.8 0.3 2.39 391.2
8 5.0 2.0 0.4 0.6 2.40 398.9
9 7.5 0.5 0.4 2.4 2.41 367.0
10 7.5 1.0 0.8 1.2 2.45 372.0
11 7.5 1.5 0.1 0.6 2.43 364.1
12 7.5 2.0 0.2 0.3 2.41 361.5
13 10.0 0.5 0.8 0.6 2.51 364.3
14 10.0 1.0 0.4 0.3 2.54 353.9
15 10.0 1.5 0.2 2.4 2.56 328.7
16 10.0 2.0 0.1 1.2 2.50 306.6
Table 1. Factors and their levels in the orthogonal array experi- ment using Qualitek-4 (W32b) software based on or- thogonal array method
Factor Level 1 Level 2 Level 3 Level 4
K2HPO4 (g/l) 2.5 5.0 7.5 10.0
NaCl (g/l) 0.5 1.0 1.5 2.0
MgSO4∙7H2O (g/l) 0.1 0.2 0.4 0.8
(NH4)2SO4(g/l) 0.3 0.6 1.2 2.4
design indicated optimal levels of each salt for cell growth and production of CMCase, as shown in Table 3. The order of each salt’s effect (contribution percent) on cell growth was found to be K
2HPO
4, MgSO
4∙7H2O, NaCl, and (NH
4)
2SO
4.,whereas that on production of CMCase was K
2HPO
4, (NH
4)
2SO
4, MgSO
4∙7H
2O, and NaCl, as shown in Fig. 2.
Potassium phosphate was the most significant factor for cell
growth as well as the production of CMCase by E. coli JM109/DL-3. The optimal concentrations of K
2HPO
4, NaCl, MgSO
4∙7H
2O, and (NH
4)
2SO
4in the medium for cell growth extracted by Qualitek-4 (W32b) software were 10.0, 1.0, 0.2, and 0.6 g/l, respectively, whereas those for the production of CMCase by E. coli JM109/DL-3 were 5.0, 1.0, 0.4, and 0.6 g/l. The expected maximal cell growth and production of CMCase were 2.58 g/l and 413.8 U/ml.
Optimization of salts using response surface method
The effects of K
2HPO
4, NaCl, MgSO
4∙7H
2O, and
(NH
4)
2SO
4in the medium on cell growth and the production
of CMCase by E. coli JM109/DL-3 were also investigated
using response surface method (RSM). Levels of K
2HPO
4,
Table 3. Analysis of variance (ANOVA) of cell growth and the production of CMCase by
E. coli
JM109/DL-3 analyzed using Qualitek-4 (W32b) software based on L16(44) orthogonal array experimentFactor Degree of
freedom (
f
) Sums ofsquares (
S
) Variance(
V
) F-ratio(
F
) Pure sum(
S’
) Contribution(
P
, %) Optimal levelDCW
K2HPO4 3 0.05 0.02 111.28 0.05 77.36 4
NaCl 3 0.00 0.00 10.67 0.00 6.78 2
MgSO4∙7H2O 3 0.01 0.00 13.13 0.01 8.51 2
(NH4)2SO4 3 0.00 0.00 6.47 0.00 3.84 2
Other/error 3 0.00 0.00 - - 3.51 -
Total 15 0.06 - - - 100.00 -
CMCase
K2HPO4 3 9321.45 3107.15 93214524.2 9321.45 70.78 2
NaCl 3 559.83 186.61 5598314.82 559.83 4.25 2
MgSO4∙7H2O 3 1602.65 534.22 16026479.9 1602.65 12.17 3
(NH4)2SO4 3 1684.90 561.63 16848953.7 1684.90 12.79 2
Other/error 3 0.00 0.00 - - 0.00 -
Total 15 13168.83 - - - 100.00 -
K2HPO4
MgSO47H2O NaCl
(NH4)2SO4 Error 77.4
0.0
Salt
Contribution (%)
A
K2HPO4
MgSO47H2O NaCl (NH4)2SO4
Error 70.8
0.0
Salt
Contribution (%)
B
Fig. 2. The percentage contributions of four salts for cell growth (A) and the production of CMCase (B) by
E. coli
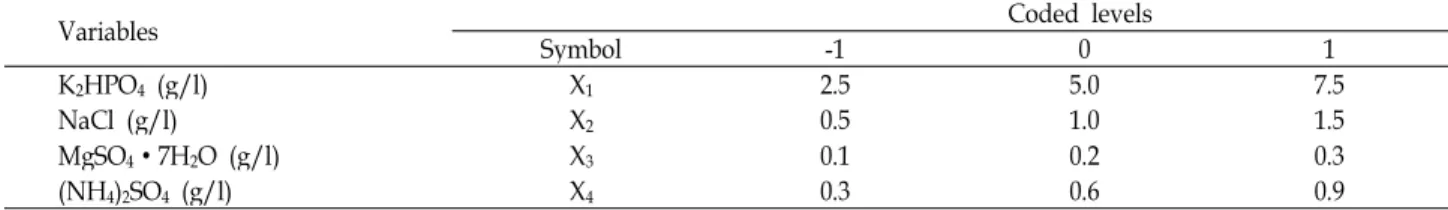
JM109/DL-3 analyzed using Qualitek-4 (W32b) software. X-axis shows factors and Y-axis shows percentage contributions of each factor.Table 4. Process variables used central composite design (CCD) with actual factor levels corresponding to coded factor levels using Design Expert software based on response surface method
Variables Coded levels
Symbol -1 0 1
K2HPO4 (g/l) X1 2.5 5.0 7.5
NaCl (g/l) X2 0.5 1.0 1.5
MgSO4∙7H2O (g/l) X3 0.1 0.2 0.3
(NH4)2SO4(g/l) X4 0.3 0.6 0.9
NaCl, MgSO
4∙7H
2O, and (NH
4)
2SO
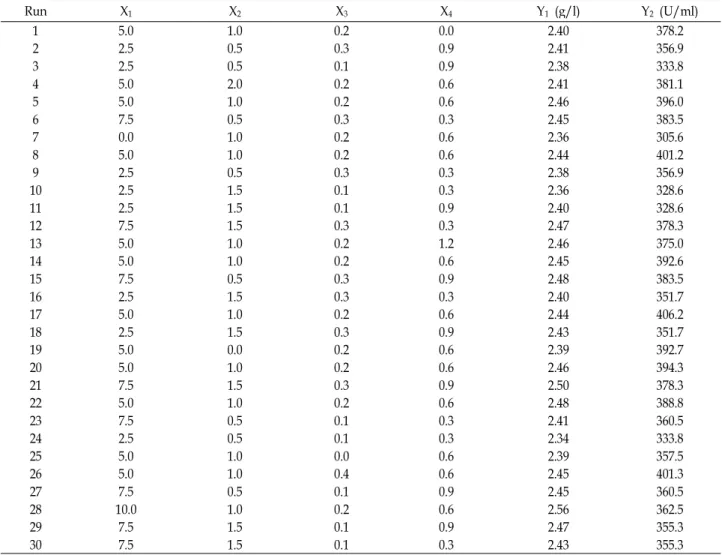
4were as shown in Table 4. The results of central composite design (CCD) experiments consisted of experimental data to investigate effects of four independent variables, as shown in Table 5.
Cell growths and the productions of CMCase by E. coli JM109/DL-3 from 30 different conditions ranged from 2.34 to 2.50 g/l and from 328.6 to 406.2 U/ml.
The analysis of variance (ANOVA) of cell growth
indicated that the model term of X
1was highly significant (“probe>F” less than 0.0001) and those of X
3, X
22, and X
32were significant (“probe>F” less than 0.0500) for cell growth of E. coli JM109/DL-3, as shown in Table 6. Multiple regression analysis of the experimental data gave the following second-order polynomial equation in terms of coded factors (1):
Y
1= 2.46 + 0.039X
1+ 0.010X
2+ 0.015X
3+ 0.015X
4Table 5. Central composite design and determined response values using Design Expert software based on response surface method
Run X1 X2 X3 X4 Y1 (g/l) Y2(U/ml)
1 5.0 1.0 0.2 0.0 2.40 378.2
2 2.5 0.5 0.3 0.9 2.41 356.9
3 2.5 0.5 0.1 0.9 2.38 333.8
4 5.0 2.0 0.2 0.6 2.41 381.1
5 5.0 1.0 0.2 0.6 2.46 396.0
6 7.5 0.5 0.3 0.3 2.45 383.5
7 0.0 1.0 0.2 0.6 2.36 305.6
8 5.0 1.0 0.2 0.6 2.44 401.2
9 2.5 0.5 0.3 0.3 2.38 356.9
10 2.5 1.5 0.1 0.3 2.36 328.6
11 2.5 1.5 0.1 0.9 2.40 328.6
12 7.5 1.5 0.3 0.3 2.47 378.3
13 5.0 1.0 0.2 1.2 2.46 375.0
14 5.0 1.0 0.2 0.6 2.45 392.6
15 7.5 0.5 0.3 0.9 2.48 383.5
16 2.5 1.5 0.3 0.3 2.40 351.7
17 5.0 1.0 0.2 0.6 2.44 406.2
18 2.5 1.5 0.3 0.9 2.43 351.7
19 5.0 0.0 0.2 0.6 2.39 392.7
20 5.0 1.0 0.2 0.6 2.46 394.3
21 7.5 1.5 0.3 0.9 2.50 378.3
22 5.0 1.0 0.2 0.6 2.48 388.8
23 7.5 0.5 0.1 0.3 2.41 360.5
24 2.5 0.5 0.1 0.3 2.34 333.8
25 5.0 1.0 0.0 0.6 2.39 357.5
26 5.0 1.0 0.4 0.6 2.45 401.3
27 7.5 0.5 0.1 0.9 2.45 360.5
28 10.0 1.0 0.2 0.6 2.56 362.5
29 7.5 1.5 0.1 0.9 2.47 355.3
30 7.5 1.5 0.1 0.3 2.43 355.3
+ 0.002X
1X
2− 0.002X
1X
3− 0.002X
1X
4+ 0.002X
2X
3+ 0.002X
2X
4− 0.004X
3X
4− 0.002X
121 − 0.017X
22− 0.012X
32− 0.010X
42(1)
The regression equation obtained from analysis of variance (ANOVA) indicated that the multiple correlation coefficient of R
2is 0.9330. The model can explain 93.30%
variation in the response. The model F-value of 14.93 implied that this model was significant. The value of the adjusted coefficient (Adj. R
2=0.8705) was very high to advocate for a high significance of this model [13]. The predicted coefficient (Pred. R
2=0.7515) was in reasonable agreement with the Adj. R
2of 0.8705. From the statistical results obtained, it was shown that the above models were adequate to predict cell growth of E. coli JM109/DL-3 within the range of variables studied. The optimal conditions of K
2HPO
4, NaCl, MgSO
4∙7H
2O, and (NH
4)
2SO
4for cell growth extracted by Design Expert Software were 7.4,4 1.08,
0.22, and 0.88 g/l, respectively. The maximum cell growth of 2.51 g/l was predicted by the model.
The ANOVA of the production of CMCase also indicated that the model terms of X
1, X
3, and X
12were highly significant for the production of CMCase by E. coli JM109/DL-3. Multiple regression analysis of the experimental data gave the following second-order polynomial equation (2).
Y
2=397.72 + 13.63X
1− 2.70X
2+ 11.33X
3− 0.27X
4+ 0.03X
1X
3− 18.11X
12− 4.90X
22− 6.77X
32− 7.47X
42(2)
The regression equation obtained from the ANOVA
indicated that the multiple correlation coefficient of R
2is
0.9437. The model can explain 94.37% variation in the
response. The model F-value of 17.95 implied that this model
was significant. The value of the adjusted determination
coefficient (Adj. R
2=0.8911) is also very high to advocate for
Table 6. Parameter estimates and analysis of variance (ANOVA) of the design for cell growth and production of CMCase by
E.
coli
JM109/DL-3 Source ofvariation Degree of
freedom Sum of squares Mean squares
F
-value Probe>FCell growth
Model 14 0.061 0.004 14.93 <0.0001
X1 1 0.036 0.036 123.9 <0.0001
X2 1 0.002 0.002 7.53 0.0151
X3 1 0.006 0.006 19.48 0.0005
X4 1 0.006 0.006 19.48 0.0005
X12
1 0.000 0.000 0.23 0.6394
X22 1 0.007 0.007 25.70 0.0001
X32 1 0.004 0.004 12.52 0.0030
X42 1 0.002 0.002 7.69 0.0142
Error 5 0.002 0.000 - -
Total 29 0.066 - - -
MCase
Model 14 17791.720 1270.840 17.95 <0.0001
X1 1 4455.370 4455.370 62.94 <0.0001
X2 1 174.960 174.960 2.47 0.1368
X3 1 3082.670 3082.670 43.55 <0.0001
X4 1 1.710 1.710 0.02 0.8787
X12 1 8996.220 8996.220 127.09 <0.0001
X22 1 658.000 658.000 9.30 0.0081
X32 1 1258.210 1258.210 17.77 0.0007
X42 1 1531.730 1531.730 21.64 0.0003
Error 5 127.85 25.570 - -
Total 29 18853.550 - - -
Actual value (g/l)
2.30 2.35 2.40 2.45 2.50 2.55 2.60
Predicted value (g/l)
2.30 2.35 2.40 2.45 2.50 2.55
2.60 A
Actual value (U/ml)
300 330 360 390 420
Predicted value (U/ml)
300 330 360 390
420 B
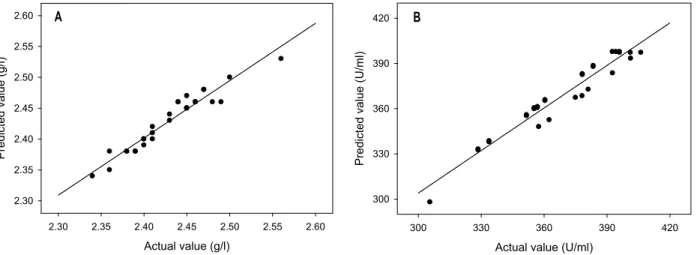
Fig. 3. Distribution of experimentally determined values versus statistically predicted ones of cell growth (A) and production of CMCase (B) by
E. coli
JM109/DL-3.a high significance of this model. The predicted determination of coefficient of 0.7049 is in reasonable agreement with the Adj. R
2of 0.8911. The optimal concentrations of K
2HPO
4, NaCl, MgSO
4∙7H
2O, and (NH
4)
2SO
4for production of CMCase were 5.84, 0.69, 0.28, and 0.54 g/l, respectively. The maximum production of CMCase of 404.6 U/ml was predicted by the model. The experimentally determined values of cell growth and the
production of CMCase by E. coli JM109/DL-3 were in close agreement with the statistically predicted ones, confirming the model’s authenticity, as shown in Fig. 3. The points clustered around the diagonal line which indicated the good fit of the model.
In the conventional one-factor-at-a-time method for
optimizing fermentation conditions, one independent
variable is changed while all others are held at constant
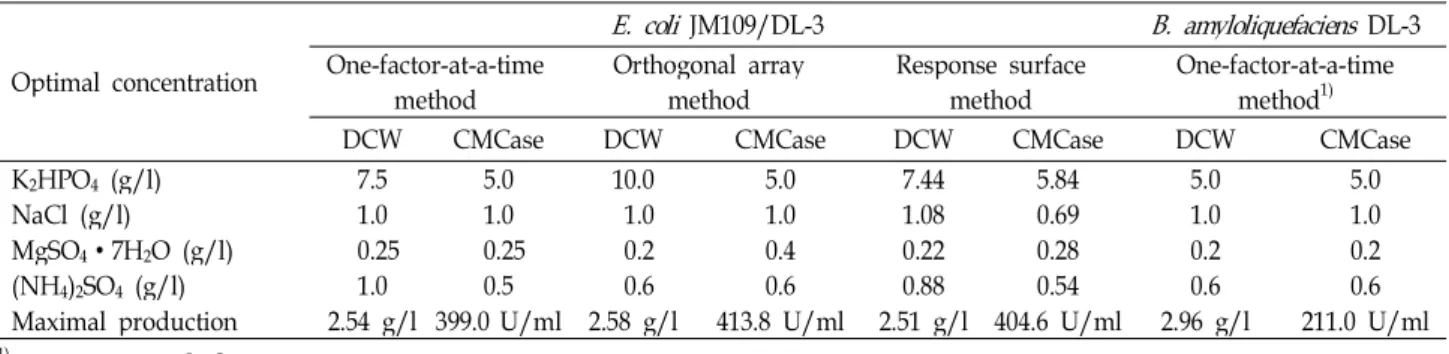
Table 7. Comparison of optimal concentrations of salts estimated by statistical methods for cell growth and production of CMCase by
E. coli
JM109/DL-3 andB. amyloliquefaciens
DL-3Optimal concentration
E. coli
JM109/DL-3B. amyloliquefaciens
DL-3 One-factor-at-a-timemethod Orthogonal array
method Response surface
method One-factor-at-a-time method1)
DCW CMCase DCW CMCase DCW CMCase DCW CMCase
K2HPO4 (g/l) 7.5 5.0 10.0 5.0 7.44 5.84 5.0 5.0
NaCl (g/l) 1.0 1.0 1.0 1.0 1.08 0.69 1.0 1.0
MgSO4∙7H2O (g/l) 0.25 0.25 0.2 0.4 0.22 0.28 0.2 0.2
(NH4)2SO4 (g/l) 1.0 0.5 0.6 0.6 0.88 0.54 0.6 0.6
Maximal production 2.54 g/l 399.0 U/ml 2.58 g/l 413.8 U/ml 2.51 g/l 404.6 U/ml 2.96 g/l 211.0 U/ml
1)Previous repot [17]
levels. This one-dimensional evaluation is tedious and time-consuming and it usually does not lead to the determination of optimal conditions, mainly due to ignoring interactions [1]. However, a full factorial design results in a large number of experiments [21]. As a solution, fractional factorial experimental designs, including Placket-Burman design, OAM, and RSM have been introduced, which reduce the number of tests while giving reliable results [27].
Taguchi’s design uses a special set of arrays called orthogonal arrays, which gives the minimal number of experiments, and provides full information on all factors that affect the performance parameter [21]. RSM employing the central composite design (CCD) is the collection of mathematical and statistical techniques, which can be used to identify the effect of individual variables, evaluate the relative significance, and expert optimal conditions [8].
The significant factors on cell growth and production of CMCase based on data from OAM were coincided with those from RSM. Moreover, two methods indicated that the optimal concentrations of four salts for cell growth were different from those for production of CMCase. The optimal concentrations of salts in the medium for cell growth were reported to be different from those for the production of pullulan by A. pullulan [6]. Moreover, the optimal concentrations of salts for cell growth and production of pullulan varied with concentrations of carbon and nitrogen sources [5]. Utilization rates of substrates were increased by the optimized concentration of salts, which resulted in enhanced cell growth and production of pullulan [20]. Two statistical methods also indicated that potassium phosphate was the most significant factor for cell growth and production of CMCase. Potassium phosphate is one of the major salts in the medium for productions of microbial
polysaccharides and enzymes as well as a well-known ingredient in buffer solutions [11,16,19]. Sodium chloride was reported to be used as a physiological modulator of biosynthetic pathway of biopolymers [10]. Magnesium sulfate added to medium assisted spore germination and initial growth of A. fisheri, which resulted in 1.9 fold increased production of xylanase [19]. Higher cell growth and production of key enzymes for the production of 1,3-propanediol were obtained when ammonium chloride was added in the medium [9]. Potassium phosphate seemed to act as a mineral salt for cell growth of P. aquimaris LBH-10 as well as a pH stabilizer in the medium, which could enhance the production of CMCase [17]. Ammonium sulfate used in this study seems to be mainly used as a nitrogen source for cell growth.
The optimal concentrations of salts in the medium for cell growth and the production of CMCase by P. aquimaris LBH-10 were established using OAM and RSM in this study and compared with previously used concentrations of salts, as shown in Table 7. Production of CMCase by a recombinant E. coli JM109/DL-3 under optimized concentration of salts was 1.93 times higher than that by B.
amlyloliquifaciens DL-3. The optimal concentrations of salts
and their influences on cell growth and production of
CMCase extracted by OAM were almost the same as those
by RSM. However, each method gave its own detailed
information such as sum of squares, mean square, and F
value on effects of salts on cell growth and production of
CMCase. The number of combination at an experiment can
be minimized by reduced levels of factors using Qualitek-4
Software based on OAM, whereas the predicted optimal
conditions can be extracted using Design Expert Software
based on RSM.
Acknowledgements
This research is supported by Basic Research Program through the National Research Foundation of Korea (NRF) funded by the Ministry of Education, Science and Technology (Grant No. 2009-0064885) and this research was also partially supported by Technology Development Program for Ministry for Food, Agriculture, Forestry and Fisheries, Republic of Korea.
References
1. Bakhtiari, M. R., M. G. Faezi, M. Fallahpour, A. Noohi, N.
Moazami, and Z. Amidi. 2006. Medium optimization by or- thogonal array designs for urease production by
Aspegillus niger
PTCC5011.Process Biochem.
41, 547-551.2. Ballesteros, M., J. M. Oliva, M. J. Negro, P. Manzanares, and I. Ballesteros. 2004. Ethanol from ligoncelulosic materials by a simultaneous saccharification and fermentation process (SSF) with
Kluyveromeces marxianus
CECT 10875.Process Biochem
. 39, 1843-1848.3. Blumer-Schuette, S. E., I. Kataeva, J. Westpheling, M. W.
W. Adams, and R. M. Kelly. 2008. Extremely thermophilic microorganisms for biomass conversion: status and prospects.
Curr. Opin. Biotechnol
. 19, 210-217.4. Cui, J. D. 2010. Optimization of medium for phenylalanine ammonia lyase production in
E. coli
using response surface method.Kor. J. Chem. Eng
. 27, 174-178.5. Gao, W., Y. J. Kim, C. H. Chung, and J. W. Lee. 2010.
Optimization of mineral salts in medium for enhanced pro- duction of pullulan by
Aureobasidium pullulans
HP-2001 us- ing an orthogonal array method.Biotechnol. Bioprocess Eng
. 15, 837-845.6. Gao, W., C. H. Chung, J. Li, and J. W. Lee. 2011. Application of statistical experimental design for optimization of physio- logical factors and their influences on production of pul- lulan by
Aureobasidium pullulans
HP-2001 using an orthogo- nal array method.Korean J. Chem. Eng
. Doi:10.1007/s11814-011-0107-4.
7. Golias H, G. J. Dumsday, G. A. Stanley, and N. B. Pamment.
2000. Characteristics of cellulase preparation affecting the simultaneous saccharification and fermentation of cellulose to ethanol.
Biotechnol. Lett
. 26, 617-621.8. Gu, X. B., Z. M. Zheng, H. Q. Yu, J. Wang, F. L. Liang, and R. L. Liu. 2005. Optimization of medium constituents for a novel lipopeptide production by
Bacillus subtilis
MO-01 by a response surface method.Process Biocehm
. 40, 3196-3201.9. Hongwen, C., F. Baishan, and H. Zongding. 2005.
Optimization of process parameters for key enzymes accu- mulation of 1,3-propanediol production from
Klebsiella pneumoniae
.Biochem. Eng. J
. 25, 47-53.10. Jaleel, C. A., P. Manivannan, G. M. A. Lakshmanan, R.
Sridharan, and R. Panneerselvam. 2007. NaCl as a physio- logical modulator of proline metabolism and antioxidant potential in
Phyllanthus amarus
.Compt. Rend. Biol
. 330, 806-813.11. Jin, I. H., D. Y. Jing, C. W. Son, S. K. Kim, W. Gao., C.
H. Chung, and J. W. Lee. 2011. Enhanced production of het- eropolysaccharide-7 by
Beijerinkia indica
HS-2001 in repeated batch culture with optimized substitution of culture medium.Biotechnol. Bioprocess Eng
. 16, 45-255.12. Jo, K. I., Y. J. Lee, B. K. Kim, B. H. Lee, C. H. Chung, S.
W. Nam, S. K. Kim, and J. W. Lee. 2008. Pilot-scale pro- duction of carboxymethylcellulase from rice hull by
Bacillus amyloliquefaciens
DL-3.Biotechnol. Bioprocess Eng
. 13, 182-188.13. Khuri, A. I. and J. A. Cornell. 1987.
Response surfaces: Design and analysis
. Marcel Dekker, New York, USA.14. Kim, B. K., B. H. Lee, Y. J. Lee, I. H. Jin, C. H. Chung, and J. W. Lee. 2009 Purification and characterization of car- boxymethylcellulase isolated from a marine bacterium,
Bacillus subtilis
subsp.subtilis
A-53.Enzym. Microb. Technol
. 44, 411-416.15. Lee, B. H., B. K. Kim, Y. J. Lee, C. H. Chung, and J. W.
Lee. 2010. Industrial scale of optimization for the production of carboxymethylcellulase from rice bran by a marine bacte- rium,
Bacillus subtilis
subsp.subtilis
A-53.Enzym. Microb.
Technol
. 46, 38-42.16. Lee, N. K., Y. B. Jo, I. H. Jin, C. W. Son, and J. W. Lee.
2009. The effect of potassium phosphate as a pH stabilizer on the production of gellan by
Sphingmonas paucibilis
NK-2000.J. Life Sci
. 19, 1033-1038.17. Lee, Y. J., B. K. Kim, B. H. Lee, K. I. Jo, N. K. Lee, C. H.
Chung, Y. C. Lee, and J. W. Lee. 2008. Purification and char- acterization of cellulase produced by
Bacillus amyloliquefa- ciens
DL-3 utilizing rice hull.Bioresource Technol
. 99, 378-386.18. Sen, R. 1997. Response surface optimization of the critical media components for the production of surfactin.
J. Chem.
Tech. Biotechnol
. 68, 263-270.19. Senthikumar, S. R., A. Ashokkumar, K. C. Raj, and P.
Cunasekraran. 2005. Optimization of medium composition for alkali-stable xylanase production by
Aspergillus fischeri
Fxn 1 in solid-state fermentation using central composite ro- tary design.Bioresource Technol
. 96, 1380-1386.20. Seo, H. P., K. I. Jo, C. W. Son, J. K. Yang, C. H. Chung, S. W. Nam, S. K. Kim, and J. W. Lee. 2006. Continuous pro- duction of pullulan by
Aureobasidium pullulans
HP-2001 with feeding of high concentration of sucrose.J. Microbiol.
Biotechnol
. 16, 374-380.21. Shaligram, N. S., S. K. Singh, R. S. Singhal, G. Szakacs, and A. Pandey. 2008. Compactin production in solid-state fer- mentation using orthogonal array method by
Penicillium brevicompactum
.Biochem. Eng. J
. 41, 295-300.22. Shokri, D. and G. Emitiazi. 2010. Indol-3-acetic acid (IAA) production in symbiotic and non-symbiotic nitrogen-fixing bacteria and its optimization by Taguch design.
Curr.
Microbiol
. 61, 217-225.23. Sukumaran, R. K., R. R. Singhania, G. M. Mathew, and A.
Pandey. 2009. Cellulase production using biomass feed
초록: Bacillus amyloliquefaciens DL-3의 carboxymethylcellulase를 재조합 균주 E. coli JM109/DL-3에서 생산하는 배지의 염 농도를 최적화하기 위한 통계학적 실험 방법의 비교 이유정
1,2․김혜진
1,2․고와
1,2․정정한
2,3․이진우
2,3*
(
1동아대학교 대학원 의생명과학과,
2동아대학교 BK21 생물자원 실버바이오사업 인력양성단,
3동아대학교
생명공학과)
재조합 균주인 E. coli JM109/DL-3를 사용하여 carboxymethylcellulase를 생산하기 위한 배지의 최적 염 농도 를 orthogonal array method (OAM)과 response surface method (RSM) 등과 같은 통계학적인 방법으로 확립하 고 그 결과를 비교하였다. OAM에 기초를 한 Qualitek-4 Software를 사용하여 실험을 계획하고, 그 결과를 분석 한 결과는 K
2HPO
4가 균체의 생장 및 carboxymethylcellulase의 생산에 미치는 영향이 가장 크다는 사실을 확인 하였다. 균체의 생육에 최적인 K
2HPO
4, NaCl, MgSO
4∙7H
2O 및 (NH
4)
2SO
4의 농도는 10.0, 1.0, 0.2 및 0.6 g/l이었 으나, carboxymethylcellulase의 생산에 최적인 각 염들의 농도는 각각 5.0, 1.0, 0.4 및 0.6 g/l이었다. RSM에 기초 를 한 Design-Expert Software를 사용하여 실험을 계획하고, 그 결과를 분석한 결과는 K
2HPO
4가 균체의 생장 및 carboxymethylcellulase의 생산에 가장 중요한 인자라는 사실을 확인하였다. 균체의 생장에 최적인 K
2HPO
4, NaCl, MgSO
4∙7H
2O 및 (NH
4)
2SO
4의 농도는 7.44, 1.08, 0.22 및 0.88 g/l이었으나, carboxymethylcellulase의 생산 에 최적인 각 염들의 농도는 각각 5.84, 0.69, 0.28 및 0.54 g/l이었다. 기본적으로 OAM에 기초한 software를 사용
하여 얻은 결과는 RSM에 기초한 software를 사용하여 얻은 결과와 유사하였다. 최적 조건에서 재조합 균주 E.
coli JM109/DL-3이 생산하는 carboxymethylcellulase의 생산은 B. amyloliquifacience DL-에 비하여 1.92배 증가하 였다.
stock and its application in lignocellulose saccharification for bio-ethanol production.
Renew. Energy
34, 421-424.24. Takashima, S., H. Iikura, A. Nakamura, M. Hidaka, H.
Masaki, and T. Uozumi. 1998. Overproduction of recombi- nant
Trichoderma reesei
cellulases byAspergillus oryzae
and their enzymatic properties.J. Biotechnol
. 65, 163-171.25. Tomás-Pejó, E., M. Carcía-Aparicio, M. J. Negr, J. M. Oliva, and M. Ballesteros. 2009. Effect of different cellulase dosage on cell viability and ethanol production by
Kluyveromeces marxianus
in SSF process.Bioresource Technol
. 100, 890-895.26. Wei, G. Y., W. Gao, I. H. Jin, S. Y. Yoo, J. H. Lee, Chung CH, and J. W. Lee. 2009. Pretreatment and saccharification
of rice hulls for the production of fermentable sugars.
Biotechnol. Bioprocess Eng
. 14, 828-834.27. Xu, C. P., S. W. Kim, H. J. Hwang, J. W. Choi, and J. W.
Yun. 2003. Optimization of submerged culture conditions for mycelial growth and exo-biopolymer production by
Paecilomyces tenuips
C240.Process Biochem
. 38, 1025-1030.28. Yi, J. C., J. C. Sandra, A. B. John, and T. C. Shu. 1999.
Production and distribution of endoglucanase, cellobiohy- drolase, and β-glucosidase components of the cellulolytic system of