• 검색 결과가 없습니다.

The Effect of Airport Self-Service Characteristics on Passengers' Technology Acceptance and Behavioral Intention

N/A
N/A
Protected

Academic year: 2021

Share "The Effect of Airport Self-Service Characteristics on Passengers' Technology Acceptance and Behavioral Intention"

Copied!
9
0
0

로드 중.... (전체 텍스트 보기)

전체 글

(1)

1. Introduction

Some leading airports have recently tried to increase smart service, information and communication technology (ICT), and airport soft power during the process of passengers' entry with the objective of realizing Smart Airport combined with up-to-date SSTs. The Society of International Telecommunication of Airline (SITA) envisaged providing passengers with a smooth travel based on six

* First Author, PhD student, School of Business, Korea Aerospace University, South Korea.

Tel: +82-32-741-5259, E-mail: [email protected]

** Corresponding Author, Professor, School of Business, Korea Aerospace University, South Korea.

Tel: +82-2-300-0354, E-mail: [email protected]

© Copyright: Korean Distribution Science Association (KODISA)

This is an Open Access article distributed under the terms of the Creative Commons Attribution Non-Commercial License (https://creativecommons.org/licenses/by-nc/4.0/) which permits unrestricted non-commercial use, distribution, and reproduction in any medium, provided the original work is properly cited.

principal steps: check-in, luggage check, automatic immigration control, self-boarding, booking change, and checked luggage management on self-service while approximately 80% of the global passenger airlines were running a relevant program with the aim of realizing a trip based on self-service by 2020 (SITA, 2016).

A smart airport means an airport possibly operated more safely and efficiently by applying new ICTs, including artificial intelligence, robot technology, the internet of things, the mobile internet, and big data (Korea Transport Institute, 2017). Biometric systems, big data and smart phones are bound to radically change facilities and operations in future passenger buildings and improve passenger experience (Sofia Kalakou et al., 2015).

As the airport of each country intends to realize a smart airport by increasing SSTs, it is more necessary than ever for major international airports in South Korea to introduce and apply SSTs with the aim of becoming more globally competitive and to present a direction of policies for Print ISSN: 1738-3110 / Online ISSN 2093-7717

http://dx.doi.org/10.15722/jds.17.05.201905.29

The Effect of Airport Self-Service Characteristics on Passengers’

Technology Acceptance and Behavioral Intention

Jong-Hyeon KIM * , Jin-Woo PARK **

Received: March 27, 2019. Revised: March 28, 2019. Accepted: May 05, 2019.

Abstract

Purpose - This paper analyzes the effects of the SST characteristics at airports on behavioral intention through technology acceptance and customer satisfaction, and presents a strategic plan for introducing SSTs to airports providing differentiated services.

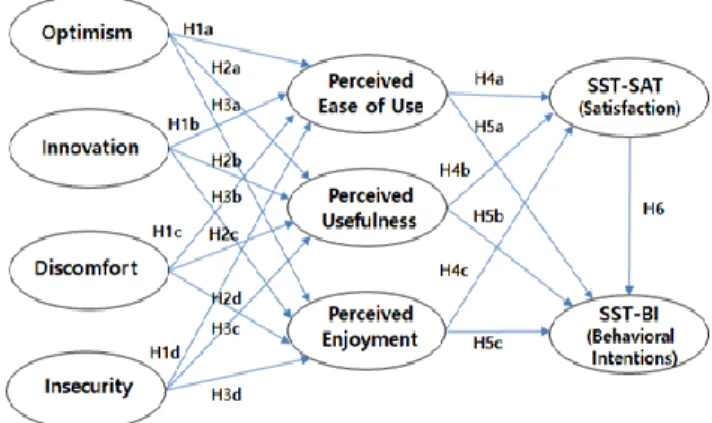
Research design, data, and methodology - We examine the role of airport self-service characteristics and access the influence of the Technology Acceptance Model (TAM) on both customer satisfaction and behavioral intentions towards SSTs.

To do this, a survey is conducted with passengers having used self-service technologies(SSTs) at Incheon International Airport. A total of 400 questionnaires are then analyzed using structural equation modeling.

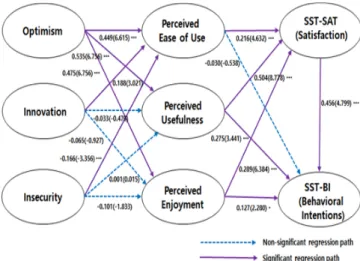
Results - According to the results, of the self-service characteristics, customer satisfaction and behavioral intention were affected by optimism through perceived ease of use, perceived usefulness, and perceived enjoyment and by innovativeness and insecurity through perceived ease of use.

Conclusions - According to the results of the study, the purpose of using TBSS in the airport is to save time and convenience. Therefore, it is necessary to closely analyze the differences in technology acceptance by age and generation, increase user self-efficacy, increasing satisfaction through effective management of cognitive and emotional waiting time will have a positive impact on behavioral intentions.

Keywords: Self-service Technologies (SSTs), Technology Readiness (TR), Technology Acceptance Model (TAM), Customer Satisfaction, Behavioral Intention.

JEL Classification: L93, N7, O31, O33, R4.

(2)

high-level SSTs. While SSTs at airports have steadily become more important, little research has been conducted on the effects of SSTs at airports on passengers' behavioral intention.

In particular, no study has been conducted on the effects of the SST characteristics on passengers' behavioral intention. This study analyzes the effects of the SST characteristics at airports on behavioral intention through technology acceptance and customer satisfaction, and presents a strategic plan for introducing SSTs to airports providing differentiated services.

2. Main discourse 2.1. Theoretical Background

Technology-based self-service (TBSS) means "every means of technological connection that enables customers to produce or use service, instead of interacting with a service provider" (Meuter et al., 2000). Many companies have introduced self-service technologies (SSTs) although not every customer wants to use or is able to use new technologies (Gelderman et al., 2011). SSTs at airports significantly benefit airport managers, airlines, and passengers. The application of TBSS can bring about positive effects by providing standardized services, by increasing options of service provision, by improving productivity and efficiency, by reducing costs, and by improving satisfaction (Liljabder et al., 2006).

Castillo-Manzano (2013) contend that an airport needs a management model to make the most use of given space, giving consideration to fixed costs and maintenance costs in building infrastructure as it became larger.

An integrated technology readiness (TR) and acceptance model has been developed to determine customers' adaptation to TBSS, with TR significantly affecting behavioral intention in TBSS (Liljabder et al., 2006; Lin et al., 2007).

TR refers to both one's own mental disposition in accepting a certain technology and one's own tendency to accept or use a new technology with the aim of achieving a goal at home or at workplace (Lin & Hsieh, 2007).

Parasuraman (2000) reported that TR is developed by four factors: optimism, innovativeness, discomfort, and insecurity.

These four factors are largely divided into active variables, such as optimism and innovativeness, which are positive ones, and inhibitory variables, such as discomfort and insecurity, which are negative ones.

To apply and expand a technology acceptance model (TAM), taking individual differences into account, Lin et al.

(2007) made the first attempt to integrate TR and TAM and, as a result, presented the Integrated Technology Readiness and Acceptance Model (TRAM). While many researchers examined the effects of the TR characteristics, Liljander et al. (2006) found that only optimism and innovativeness with

positive characteristics among the sub-areas of TR affected TBSS utilization attitude, behavior, and evaluation. In other words, discomfort and insecurity with negative characteristics among the sub-areas of TR had no effect on TBSS utilization attitude, behavior, or evaluation. Lin et al. (2007) examined the effects of TR on perceived usefulness, perceived ease of use, and behavioral intention and found that TR significantly positively affected utilization intention through the medium of perceived usefulness and perceived ease of use.

On the basis of the literature review, this study formulated the following hypotheses regarding the effects of TR characteristics:

H1a. Optimism will significantly affect perceived ease of use in terms of technology acceptance.

H1b. Innovativeness will significantly affect perceived ease of use in terms of technology acceptance.

H1c. Discomfort will significantly affect perceived ease of use in terms of technology acceptance.

H1d. Insecurity will significantly affect perceived ease of use in terms of technology acceptance.

H2a. Optimism will significantly affect perceived usefulness in terms of technology acceptance.

H2b. Innovativeness will significantly affect perceived useful- ness in terms of technology acceptance.

H2c. Discomfort will significantly affect perceived useful- ness in terms of technology acceptance.

H2d. Insecurity will significantly affect perceived useful- ness in terms of technology acceptance.

H3a. Optimism will significantly affect perceived enjoyment in terms of technology acceptance.

H3b. Innovativeness will significantly affect perceived enjoy- ment in terms of technology acceptance.

H3c. Discomfort will significantly affect perceived enjoyment in terms of technology acceptance.

H3d. Insecurity will significantly affect perceived enjoyment in terms of technology acceptance.

Davis (1989) presented a technology acceptance model (TAM) by expanding the theory of rational behavior suggested by Ajzen (1991) and Fishbein (1975).

Dabholkar (1996) and Meuter et al. (2000) indicated perceived usefulness and ease of use related to TBSS;

Dabholkar and Bagozzi (2002) noted that enjoyment in TBSS using interactions or intrinsic enjoyment related to a new aspect positively affected acceptance attitude and served as a crucial factor for users' satisfaction.

Perceived enjoyment had positive effects on ease of use as well as on usefulness perception in association with individuals' innovativeness (Agarwal & Prasad, 1999).

On the basis of the literature review, this study applied

such SST characteristics at airports, such as optimism,

innovativeness, discomfort, and insecurity to verify validity

and reliability and applied expanded TAM with perceived

(3)

ease of use, perceived usefulness, perceived enjoyment as principal factors to determine behavioral intention related to a new technology (Lee & Kim, 2009).

TAM is a model to determine individuals' behavioral intention related to a new technology and perceived ease of use and usefulness may positively affect customers' intention to use a new technology (Davis et al., 1989).

Perceived usefulness means the degree of belief that utilizing a certain system will make individuals more efficient and perceived ease of use refers to individuals' belief that utilizing a certain system will make them less physically and mentally tired (Shih & Sher, 2007).

Research on customer satisfaction was mainly based on Oliver's (1980) expectancy dis-confirmation theory to measure and determine customer satisfaction through such variables as expectation, practicality of products, and expectancy disconfirmation. Hellier et al. (2003) defined customer satisfaction as customers' expectation of service and needs for expectation confirmation and general joy and pleasure they perceive during service performance; Kotler and Keller (2007) defined it as customers' disappointment and joy from products in comparison with their known results.

Gopinath and Nyer (2009) indicated that satisfaction was composed of two factors cognition and emotion and Odekerken-Schroder et al. (2003) reported that satisfaction might include cognitive and emotional evaluation of certain goods or service. It can be said, therefore, that satisfaction is composed of cognitive and emotional factors. This study aimed to analyze the effects of technology acceptance related to TBSS on behavioral intention through customer satisfaction.

To assess customer satisfaction with the TBSS characteristics, cognitive satisfaction was measured using Oliver's (1997) customer satisfaction inventory, and emotional satisfaction as a type of emotional response to TBSS characteristics was measured using the adaptation of Martin's (2008) scale to this study.

Behavioral intention can be defined as utilization or use intention and implies a motivator affecting individuals' subjective state and behavior (Davis, 1989). In general, the greater the behavioral intention, the higher likelihood to perform the behavior (Ajzen, 1991). Zeithaml (1996) notes that behavioral intention is a concept that covers word-of- mouth or repurchase intention related to goods or service and can be divided into revisit and word-of-mouth intention according to experiences or awareness.

Word-of-mouth plays a positive role related to goods or service to be purchased because it tends to induce potential customers to make a revisit through recommending effects and to spread their own experiences positively (Wong &

Kwong, 2004). On the basis of the literature review, this study formulated the following hypotheses:

H4a. Perceived ease of use will significantly affect customer

satisfaction in terms of SSTs.

H4b. Perceived usefulness will significantly affect customer satisfaction in terms of SSTs.

H4c. Perceived enjoyment will significantly affect customer satisfaction in terms of SSTs.

H5a. Perceived ease of use will significantly affect behavioral intention in terms of SSTs.

H5b. Perceived usefulness will significantly affect behavioral intention in terms of SSTs.

H5c. Perceived enjoyment will significantly affect behavioral intention in terms of SSTs.

H6. Customer satisfaction will significantly affect behavioral intention in terms of SSTs.

2.2. Research model

This study aimed to perform empirical analysis to determine the structural association in the effects of the self-service characteristics at airports on behavioral intention through the medium of technology acceptance and customer satisfaction. To do this, the research model was presented, as shown in Figure 1, on the basis of the literature review.

Figure 1: Research Model

3. Methodology 3.1. Sample design

The questionnaire was developed by revising and complementing items in the preliminary survey based on the literature review. It covered TR and technology acceptance characteristics, customer satisfaction, behavioral intention, demographic characteristics, SST utilization behavior, and travelers' characteristics. It used the 7-point Likert scale, with scores ranging from 1 (strongly disagree) to 7 (strongly agree).

The measurement variables and measurement items used in

this research are shown in Table 1.

(4)

Table 1: Measurement Items

Construct Item

Optimism

(TRO1) (TRO2) (TRO3) (TRO4)

The latest technology provides better daily life.

Products and services with the latest technology are easy to use.

I prefer to use the latest technology possible.

The latest technology allows me to handle my work more efficiently.

Innovativeness

(TRI1) (TRI2) (TRI3) (TRI4)

Others come to me to get advice on new technology.

I can understand the products and services with the latest technology without the help of others.

In general, I tend to use the latest technology before the people around me.

I am aware of the latest technology trends.

Discomfort

(TRD1) (TRD2) (TRD3) (TRD4)

The technical support department(customer center) does not help because it explains in terms that I don’t understand.

I had the feeling that I was being used by the them when I received technical support from a provider of products and services.

I do not prefer products and services with the latest technology.

I am aware of the development trend of the latest technology.

Insecurity

(TRIS1) (TRIS2) (TRIS3) (TRIS4)

I have been anxious about using e-commerce.

I’m not confident in dealing with transactions only online.

I don’t think it’s safe to provide a credit card numbers through a computer.

I am worried that the information provided through the Internet seems to be being exposed to others.

Perceived Ease of Use

(PEOU1) (PEOU2) (PEOU3) (PEOU4)

The airport’s self-service technology is ease to use.

The airport’s self-service technology is ease to understand.

The airport’s self-service technology is convenient to use.

The use of self-service technology at the airport is simple.

Perceived Usefulness

(PU1) (PU2) (PU3) (PU4)

The airport’s self-service technology is useful.

You can save time by using the airport’s self-service technology.

The airport’s self-service technology will improve departure & entry procedures.

The self-service technology of the airport makes the departure & entry procedure efficient.

Perceived Enjoyment

(PE1) (PE2) (PE3) (PE4)

The airport’s self-service technology was a new service experience in that I had to do the whole process myself.

Using the airport’s self-service technology itself was interesting to me.

It was a pleasure to use the airport’s self-service technology.

The airport’s self-service was more enjoyable than the existing employee service.

Satisfaction with SSTs

(SSTS1) (SSTS2) (SSTS3) (SSTS4)

I am satisfied with the experience of using self-service technology.

It was a wise decision to choose self-service technology.

Self-service technology at the airport helped me.

I am more satisfied with the self-service technology service at this airport than other airports.

Behavioral Intention

(BI1) (BI2) (BI3) (BI4)

I will continue to use self-service technology provided by the airport in the future.

I will talk positively to people around me about the self-service technology of this airport.

I am willing to recommend this airport self-service technology to people around me.

I’ll choose this airport again if I have the opportunity.

The survey respondents were South Koreans who had utilized SSTs at airports from October 2 to 28, 2018.

Given that the respondents were SST users, a researcher made a personal visit to the boarding lounge in the airside passenger terminals at Incheon International Airport to convey a better understanding of the questionnaire and raise the response rate. Of the 450 questionnaires distributed, 438 copies were returned. 400 in total were analyzed after 37 copies that were incomplete or contained remarkably insincere answers were excluded.

3.2. Analysis

To test the hypotheses, the data from the survey of SST users at Incheon International Airport were analyzed using the SPSS 22.0 and AMOS 18.0 programs.

First, a frequency analysis was carried out to determine the respondents' demographic characteristics. Second, a confirmatory factor analysis (CFA) was performed to validate the instruments and determine inter-variable internal consistency.

The hypotheses were tested using structural equation modeling (SEM) to identify the path coefficient of the structural model.

3.3. Demographic analysis

From the frequency analysis, the general characteristics of

the sample were as presented in Table 2. Of the airport

SST users, 231 (57.8%) were male and 169 (42.3%) were

female; 123 (30.8%) were in their thirties, 113 (28.3%) in

their forties, 77 (19.3%) in their twenties, 69 (17.3%) in their

(5)

fifties, 12 (3.0%) in their sixties or older, and 6 (1.5%) teenagers. As for passengers' SST utilization, 279 persons (69.8%) were university graduates, 69 (17.3%) graduate school graduates, 32 (8.0%) college graduates, and 19 (4.8%) high school graduates.

152 persons (38.0%) used SSTs 3~4 times, 112 (28.0%) no more than twice, 73 (18.3%) ≥7 times, and 63 (15.8%) 5~6 times. 259 (64.8%) used SSTs to save time, 102 (25.5%) because of convenience, 34 (8.5%) because of recommendations from acquaintances, and 5 (1.3%) to use duty-free shops quickly. 41.3% used Korean Air, 29.0%

LCCs, 20.3% Asiana, and 9.5% foreign airlines. Within the past year, 291 persons had (72.8%) traveled abroad 1~3 times and 93 (23.3%) 4~6 times. 303 persons (75.8%) traveled for the purpose of tourism, 82 (20.5%) for business, 9 (2.3%) to visit relatives, and 6 (1.5%) for education/

studying abroad.

Table 2: Demographic information of sample

4. Empirical Results

4.1. Confirmatory factor analysis(CFA)

Before testing the hypotheses, this study validated the measurement model through a CFA. As for discomfort and insecurity, two items had squared multiple correlation (SMC)

<0.4 and one item had the standardized regression coefficient ≤0.7. As a result, each measurement variable had the standardized regression coefficient ≥0.7, and convergent validity was secured.

Customer satisfaction was analyzed with a factor composed of four variables to measure cognitive satisfaction and another factor composed of three variables to measure emotional satisfaction. The CFA of the measurement variables related to each component obtained the results, as presented in Table 3.

Table 3: Confirmatory factor analysis

Division Frequency

(persons) %

Gender Male 231 57.8

Female 169 42.3

Age

10s 6 1.5

20s 77 19.3

30s 123 30.8

40s 113 28.3

50s 69 17.3

≥60s 123.0

Education

High school 19 4.8

College 328.0

University 279 69.8

Graduate school 69 17.3

Others 1 0.3

No. of times using (TBSS)

≤2112 2 8.0

3-4 15238.0

5-6 63 15.8

≥7 73 18.3

Reason for (TBSS) use

Recommended by

acquaintances 34 8.5

Convenience 1022 5.5

To save time 259 64.8

To use duty-free

shop 5 1.3

Airline

Korean Air 165 41.3

Asiana 81 20.3

Foreign airline 38 9.5

LCC 116 29.0

No. of trips (within 1

year)

1-3 291 72.8

4-6 93 23.3

7-9 10 2.5

≥10 6 1.5

Purpose of trip

Tourism 303 75.8

Business 822 0.5

Visit to relatives 9 2.3

Education/study 6 1.5

Total No. of respondents 400 100%

Latent variable

Measure- ment

variable SMC Standardized regression coefficient

Non standardized regression coefficient Optimism

TRO1 0.635 0.797 1.000(Fix)

TRO20.659 0.812 1.42 7

TRO3 0.687 0.829 1.635

TRO4 0.784 0.886 1.411

Innovative- ness

TRI1 0.644 0.803 1.000(Fix)

TRI20.601 0.775 0.882

TRI3 0.786 0.886 1.102

TRI4 0.736 0.868 1.024

Discomfort

TRD1 0.4120.642 1.000(Fix)

TRD20.547 0.740 1.139

TRD3 0.273 0.522 0.799

TRD4 0.134 0.366 0.683

Insecurity

TRIS1 0.354 0.595 1.000(Fix)

TRIS20.2 12 0.461 0.663

TRIS3 0.728 0.853 1.365

TRIS4 0.6520.807 1.2 46

Perceived ease of use

PEOU1 0.8120.901 1.000(Fix)

PEOU20.798 0.893 1.014

PEOU3 0.805 0.897 1.047

PEOU4 0.813 0.9021.062

Perceived usefulness

PU1 0.569 0.754 1.000(Fix)

PU20.574 0.758 1.089

PU3 0.807 0.898 1.290

PU4 0.814 0.9021.2 79

Perceived enjoyment

PE1 0.590 0.768 1.000(Fix)

PE2 0.847 0.921 1.287

PE3 0.810 0.900 1.308

PE4 0.509 0.713 1.089

Satisfaction with SSTs

SSTS1 0.7520.867 1.000(Fix)

SSTS20.803 0.896 1.057

SSTS3 0.764 0.874 1.012

SSTS4 0.443 0.666 0.854

Behavioral intention

BI1 0.720 0.848 1.000(Fix)

BI20.897 0.947 1.12 4

BI3 0.821 0.906 1.130

BI4 0.557 0.747 0.906

(6)

4.2. Measurement model analysis

The CFA was followed by measurement model analysis to test goodness-of-fit of the model by combining all the factors. For the general goodness-of-fit of the model, χ

2

= 653.997, df=343, CMIN/DF=1.907, p=0.000, GFI=0.900, NFI=0.935, IFI=0.968, CFI=0.968, RMR=0.052, and RMSEA=

0.048, with each measure judged to fit CMIN/DF (≤3), GFI (≥0.9), NFI (≥0.9), IFI (≥0.9), CFI (≥0.9), RMR (≤0.08), and RMSEA (≤0.08).

Therefore, the model was found to be an empirical model with a high level of goodness-of-fit.

The measurement model analysis of the measurement variables related to each component obtained the results as presented in Table 4.

Table 4: Measurement model analysis

Note: α = Cronbach’ α

4.3. Hypothesis testing

For the goodness-of-fit indexes of the model, χ

2

= 678.538, df=349, CMIN/DF=1.994, p=0.000, GFI=0.896, NFI=0.933, IFI=0.966, CFI=0.966, RMR=0.056, and RMSEA=0.049,

indicating that the acceptable level of goodness-of-fit was met. Therefore, the structural model in this study is judged to be appropriate.

The results of hypothesis testing are as shown in Figure 2.

Figure 2: Result of research hypotheses testing

The SST characteristics significantly affecting perceived ease of use were optimism, innovation, and insecurity.

β=0.449 and C.R.=6.615 (p<0.05) for the effects of optimism on perceived ease of use; β=0.188 and C.R.=3.021 (p<0.05) for the effects of innovativeness on perceived ease of use; and β=-0.166 and C.R.=-3.356 (p<0.001) for the effects of insecurity on perceived ease of use; thus, each of them had statistically significant effects and H1a, H1b, and H1d were adopted.

β=0.535 and C.R.=6.756 (p<0.05) for the effects of optimism on perceived usefulness; thus, it had statistically significant effects and H2a was adopted. In contrast, β=

-0.033 and C.R.=-0.470 (p>0.05) for the effects of innovativeness on perceived usefulness; and β=0.001 and C.R.=0.015 (p>0.05) for the effects of insecurity on perceived usefulness; thus, each of them had no statistically significant effect. β=0.475 and C.R.=6.756 (p<0.05) for the effects of optimism on perceived enjoyment; thus, it had statistically significant effects and H3a was adopted In contrast, β=-0.065 and C.R.=-0.927 (p<0.05) for the effects of innovativeness on perceived enjoyment; and β=-0.101 and C.R.=-1.833 (p>0.05) for the effects of insecurity on perceived enjoyment; thus, each of them had no statistically significant effect.

As one of the factors related to negative emotions toward technologies, discomfort had no significant effect on perceived ease of use, usefulness, or enjoyment; however, insecurity negatively affected perceived ease of use alone.

This finding implies that as the factors arousing favorable emotions toward technologies, such as optimism and innovativeness, had stronger effects than those arousing unfavorable emotions, such as discomfort and insecurity, and Latent

variable

Measu- rement

variable SMC Standardized regression coefficient

standardized Non regression coefficient

α

Optimism

TRO1 0.544 0.737 0.691

0.890

TRO20.688 0.82 9 1.089

TRO3 0.750 0.866 1.277

TRO4 0.706 0.840 1.000(Fix) Innovative-n

ess

TRI1 0.645 0.803 0.974

0.899

TRI20.613 0.783 0.867

TRI3 0.770 0.877 1.061

TRI4 0.7420.862 1.000(Fix) Insecurity TRIS3 TRIS4 0.715 0.698 0.846 0.836 1.000(Fix) 1.050 0.828 Perceived

ease of use

PEOU1 0.743 0.8621.000(Fix) 0.943

PEOU20.72 1 0.849 1.008

PEOU3 0.828 0.910 1.109

PEOU4 0.846 0.920 1.133

Perceived usefulness

PU1 0.7420.861 1.043

0.901

PU20.710 0.843 1.105

PU3 0.577 0.760 0.997

PU4 0.597 0.773 1.000(Fix) Perceived

enjoyment

PE1 0.497 0.705 0.814

0.892

PE20.760 0.872 1.081

PE3 0.887 0.9421.2 14

PE4 0.545 0.738 1.000(Fix) Satisfaction

with SSTs

SSTS1 0.737 0.856 1.000(Fix) 0.892

SSTS20.816 0.903 1.078

SSTS3 0.733 0.877 1.028

Behavioral intention

BI1 0.733 0.856 1.119

0.920

BI20.891 0.944 1.2 42

BI3 0.819 0.905 1.252

BI4 0.5520.743 1.000(Fix)

(7)

most of the hypotheses regarding the factors related to unfavorable emotions were rejected, awareness of discomfort or insecurity in using TBSS weakened. It is consistent with the finding of Ok (2011) that an inhibitory variable of TR, insecurity, had no significant effect on behavioral intention.

β=0.216 and C.R.=4.632 (p<0.05) for the effects of the technology acceptance characteristic, perceived ease of use, on customer satisfaction; and β=0.504 and C.R.=8.778 (p<0.05) for the effects of perceived usefulness on customer satisfaction; thus, each of them had statistically significant effects. β=0.289 and C.R.=6.384 (p<0.05) for the effects of perceived enjoyment on customer satisfaction; thus, it had statistically significant effects. Therefore, each of them significantly affected customer satisfaction and H4a, H4b, and H4c were adopted. In contrast, β=-0.030 and C.R.=-0.538 (p>0.05) for the effects of perceived ease of use on behavioral intention; thus, it had no statistically significant effect. However, β=0.275 and C.R.=3.441 (p<0.05) for the effects of perceived usefulness on behavioral intention; and β=0.127 and C.R.=2.280 (p<0.05) for the effects of perceived enjoyment on behavioral intention; thus, each of them had statistically significant effects. Lastly, β

=0.456 and C.R.=4.799 (p<0.001) for the effects of customer satisfaction on behavioral intention in H6; thus, it had statistically significant effects. Ease of use was used as factor that increase technology-based self-service convenience (Yang et al., 2014).

5. Conclusion

This study aimed to determine the effects of the TBSS characteristics at airports on behavioral intention through technology acceptance and customer satisfaction. The empirical analysis of 400 passengers using SSTs at airports obtained the following results:

First, of the TBSS characteristics, optimism significantly positively affected perceived ease of use, usefulness, and enjoyment. This finding implies that those who believe that technologies make their daily life and work convenient are more likely to think that TBSS is easy to use and efficient.

Innovativeness significantly affected perceived ease of use alone. More innovative people are more likely to be early adopters and think that TBSS is easy to use because they generally have fear in use a new technology. Second, perceived ease of use, usefulness, and enjoyment significantly positively affected customer satisfaction.

Perceived usefulness, followed by perceived enjoyment and perceived ease of use, most significantly affected customer satisfaction; customers perceiving a high value of TBSS had their satisfaction more strongly affected. We have discovered that the feeling of easiness in use, technological usefulness, and its visiting intention for augmented reality technology can positively influence on the users’ purchasing intention (Cho et al., 2016).

Third, perceived usefulness and enjoyment significantly affected behavioral intention, whereas perceived ease of use had no significant effect on behavioral intention.

Fourth, customer satisfaction significantly affected behavioral intention; customer satisfaction positively affected behavioral and word-of-mouth intention. Positive TBSS users at airports were generally satisfied, intended to use it continuously, and even had their word-of-mouth intention affected. Therefore, as customers having greater perception of usefulness, ease of use, and enjoyment were more likely to have their satisfaction, behavioral intention, and word-of-mouth intention significantly affected, airport authorities and airlines need to make efforts to satisfy customers.

The practical implications of this study are as follows.

According to the results of the study, the purpose of using TBSS in the airport is to save time and convenience.

Therefore, it is necessary to closely analyze the differences in technology acceptance by age and generation, increase user self-efficacy, increasing satisfaction through effective management of cognitive and emotional waiting time will have a positive impact on behavioral intentions.

To gradually expand the application of TBSS and operate it stably, priority should be given to efforts to generate a platform for the integrated management of information in all the areas at airports, including information about aircraft and passenger flow, by integrating individual systems and by building information platforms. What is necessary at the same time is to expand TBSS by applying up-to-date technologies, including unmanned systems, which involve self check-in kiosks, self-tagging of checked luggage, self bag drops, and biometrics-based immigration systems. Also, This study are expected to be useful as basic data to aid strategies to develop and improve SSTs at Incheon International Airport.

The limitations of this study and further tasks are as follows. First, because this study was only surveyed South Korean TBSS users, the sample is hardly representative.

This limitation will be overcome by conducting a survey in a population containing broader range of nationalities. Second, while the empirical research found that the TBSS characteristics at airports significantly affected the technology acceptance, customer satisfaction, and behavioral intention, further research should be conducted regarding several resulting variables, including diverse situational effects, moderating variables, and customer satisfaction segmentation.

References

Agarwal, R., & Prasad, J. (1999). Are individual differences germane to the acceptance of new information technologies?

Journal of Decision Sciences, 30(2), 361-391.

Ajzen, I. (1991). The theory of planned behavior.

Organizational Behavior and Human Decision Processes,

(8)

50(2), 179-211.

Bobbitt, L. M., & Dabholkar, P. A. (2001). Integrating attitudinal theories to understand and predict use of technology-based self-service: The internet as an illustration. International Journal of Service Industry Management, 12(5), 423-450.

Cho, K. I., & Kim, C. J. (2016). The study on the influence of technology acceptance in the traditional markets for consumer purchasing intention: Based on augmented reality technology. Journal of Distribution Science, 14(12), 119-127.

Collier, S. E. (2013). Only if it is convenient:

understanding how convenience influences self-service technology evaluation. Journal of Service Research, 16(1), 39-51.

Dabholkar, M. L., Bobbitt, E. J., & Lee. (2003).

Understanding consumer motivation and behavior related to self-scanning in retailing: Implications for strategy and research on technology-based self-service.

International Journal of Service Industry Management, 14(1), 59-95.

Dabholkar, P. A. (1996). Consumer evaluations of new technology-based self-service options: An investigation of alternative models of service quality, International Journal of Research in Marketing, 13(1), 29-51.

Dabholkar, R. P., & Bagozzi, R. P. (2002). An attitudinal model of technology-based self-service. Journal of the Academy of Marketing Science, 30(3), 184-201.

Davis, F. D. (1989). Perceived usefulness, perceived ease of use, and user acceptance of information technology.

MIS Quarterly, 13(3), 318–339.

Fishbein, M., & Ajzen, I. (1975). Belief, Attitude, Intention, and Behavior: An Introduction to Theory and Research.

Reading, MA: Addison-Wesley.

Gelderman, C. J., Ghijsen, P. W. T., & Diemen, R. V.

(2011). Choosing self-service technologies or interpersonal services -The impact of situational factors and technology related attitudes-. Journal of Retailing and Consumer Services, 18(5), 414-421.

Hellier, P. K., Geursen, G. M., Carr, R. A., & Rickard, J.

A. (2003). Customer Repurchase Intention: A General Structural Equation Model. European Journal of Marketing, 37(11-12), 1762-1800.

Gopinath, M., & Nyer, P. U. (2009). The effect of public commitment on resistance to persuasion: The influence of attitude certainty, issue importance, susceptibility to normative influence, preference for consistency and source proximity. International Journal of Research in Marketing, 26(1), 60-68.

Kalakou, S., Psaraki-Kalouptsidi, V., & Moura, F. (2015).

Future airport terminals: New technologies promise capacity gains. Journal of Air Transport Management, 42(1), 203-212.

Karahanna, E., Straub, D. W., & Chervany, N. L. (1999).

Information technology adoption across time: A

cross-sectional comparison of preadoption and post-adoption beliefs. MIS Quarterly, 23(2), 183-213.

Kotler, P., & Keller, K. L. (2007). Marketing Management  (12 Eds.). Seoul, Korea: Seokjeong Publishing Co.

Lee, J. W., & Kim, Y. E. (2009). Perceived interaction in online classes and technology acceptance model to student satisfaction. Journal of Distribution science, 7(3), 25-48.

Liljander, V., Gillbert, F., Gummerus, J., & Riel, A.

(2006). Technology readiness and the evaluation and adoption of self-service technologies. Journal of Retailing

& Consumer Services, 13(1), 177-191.

Lin, J. S. C., & Hsieh, P. L. (2007). The influence of technology readiness on satisfaction and behavioral intentions toward self-service technologies. Journal of Computers in Human Behavior, 23(1), 1597-1615.

Lisha, C. F., Goh, S., Yifan, A., & Rasli. (2017).

Integrating guanxi into technology acceptance: An empirical investigation of WeChat. Journal of Telematics and Informatics, 34(1), 1125-1142.

Manzano, J. I., & López, L. (2013). Check-in services and passenger behavior: Self-service Technologies in airport systems. Journal of Computers in Human Behavior, 29(1), 2431-2437.

Martin, B. A. S., Sherrard, M. J., & Wentzel, D. (2005).

The role of sensation seeking and need for cognition on Web-site evaluations: A resource matching perspective. Psychology and Marketing, 4(1), 47-62.

Meuter, M. L., Ostrom, A. L., Roundtree, R. I., & Bitner, M.

J. (2000). Self-service technologies: understanding customer satisfaction with technology based service encounters. Journal of Marketing, 64(1), 50-64.

Odekerken-Schröder, G. J., De Wulf, K., & Schumacher, P.

(2003). Strengthening outcomes of retailer consumer relationships, the dual impact of relationship marketing tactics and consumer personality. Journal of Business Research, 56(1), 177-190.

Oliver, R. L. (1980). A cognitive model of the antecedents and consequences of satisfaction decisions. Journal of Marketing Research, 17(4) 460–469.

Oliver, R. L. (1997). Satisfaction: Behavioral Perspective on the Consumer. New York, NY: McGraw-Hill.

Ok, R. M. (2011). The Effects of Technology Readiness on the Usage Intention of Social Shopping. Graduate School, Hanyang University.

Parasuraman, A. (2000). Technology Readiness Index (TRI): A multiple-item scale to measure readiness to embrace new technologies. Journal of Service Research, 2(4), 307-320.

Pujari, D. (2004). Self-service with a smile?: Self-service technology (SST) encounters among Canadian business- to-business. International Journal of Service Industry Management, 15(2), 200-219.

Robertson, N., McDonald, H., Leckie, C., & McQuilken, L.

(2016). Examining customer evaluations across different

(9)

self-service technologies. Journal of Services Marketing, 30(1), 88-102.

Society of International Telecommunication of Airline.

(2016). Retrieved from www.scribd.com/doc/303592875/

SITA/360-Degree-Report-the-Future-is-Connected-2016.

Wong, C. S., & Kwong, W. Y. Y. (2004). Outbound tourists’ selection criteria for choosing all-inclusive package tours. Journal of Tourism Management, 25(5), 581-592.

Woodside, A. G., Frey, L., & Daiy, R. T. (1989). Linking Service Quality Consumer Satisfaction and Behavior Intention. Journal of Health Care Marketing, 9(4), 5-17.

Yang, H. S., Lee, S. H., Shim, K. Y., & Yun, M. K. (2014).

The Relationship between the Technology-Based Self-Service Convenience Orientation Factor and Convenience in Retail Stores. Journal of Distribution science, 12(10), 11-17.

Yoo, S. S., Huh, M. Y., & Min, K. D. (2017). Women as Consumers: An Analysis on Their Consumption Culture.

The Journal of Industrial Distribution & Business, 8(7), 31-38.

Zeithaml, V. A., Berry, L. L. & Parasuraman, A. (1996).

The behavioral consequence of service quality. Journal

of Marketing, 60(2), 31-46.

수치

Figure  1:  Research  Model
Table  1:  Measurement  Items Construct Item Optimism (TRO1)(TRO2) (TRO3) (TRO4)
Table  2:  Demographic  information  of  sample
Table  4:  Measurement  model  analysis

참조

관련 문서

Second, the early childhood teachers' digital literacy and technology self-efficacy significantly affected the components of attitude toward digital

Abstract This study intended to examine how customers of self-service technology of airlines perceive and adopt the technology, and how such perceptions affect

After the discussion, we investigated the effectiveness of our strategy using the Technology Acceptance Model and verified students' satisfaction and ability to

Key Words : Technology-based Airline Self-Service(기술기반 항공사 셀프서비스), UTAUT2 (Unified Theory of Acceptance and Use of Technology 2;

Second, the competence, among other factors of the human service quality, had positive influence on cognitive and emotional responses, while customer understanding affected

A study on the impact of Mobile Tourism Application Service Quality on consumer’s intention: Focusing on Technology Acceptance Model.. Influence

Second, as the result of analysis of the relationship between digital music service acceptance factors and customer satisfaction, diversity of digital

Service orientation and customer orientation significantly affected, but the results of the hypothesis testing, the usefulness of information system technology acceptance