Wavelet Based Semblance and Eigenvalue Analysis for Geomagnetic Variation Related to Micro-Earthquakes in the Korean Peninsula
Yoonsoo Ji, Seokhoon Oh*, and Kiyeon Kim
Department of Energy and Resources Engineering, Kangwon National University, Gangwon 200-701, Korea
Abstract: The objective of this paper is to apply a newly developed wavelet-based semblance filtering and eigenvalue analysis to investigate the geomagnetic variations in some micro-earthquakes that had occurred in the Korean Peninsula.
The wavelet-based filtering showed improved results in delineating the geomagnetic variations in relation to earthquake events from their background field. In addition, the eigenvalues analysis was also useful for the interpretation of three components geomagnetic fields during the earthquake events. The wavelet-based semblance analysis showed a prominent result for short-term geomagnetic variation related to the earthquake event, and the eigenvalue analysis was feasible to long-term geomagnetic variation. Considering the fact that the basement rock of the Korean Peninsula has a highly resistive electrical structure, it seems to be possible for small magnitude earthquakes to generate some distinguished geomagnetic variations.
Keywords: geomagnetic variation, eigenvalue analysis, wavelet based semblance, principal component
Introduction
Increasing evidence shows that the properties of candidate earthquake precursors seem to be dependent on a focal mechanism (Reasenberg, 1999; Tsuruoka et al., 1995; Wan et al., 2002). Test of earthquake precursors without its classification could be misleading (Wu, 1999). However, the purpose of this paper is to inquire whether the observation of geomagnetic series can be used to identify a geomagnetic variation relationship between some micro earthquakes. This is important to the prediction of earthquakes, because most current studies what deal with the geophysical precursors of earthquakes are based on the geomagnetic analysis. Likewise, this study was conducted to geomagnetic analysis related to some micro- earthquakes occurred in the Korean peninsula.
Historically, the effort to discover the physical phenomena occurring prior to a main earthquake has been perpetually frustrated. Among the many proposals, monitoring of geomagnetic field variations has been
accepted as the most practical method for the anticipation of a seismic event (Johnston, 1997; Rikitake and Honkura, 1985). The physical mechanism explaining the co-seismic or preliminary response of the magnetic field was proposed fairly long time ago (Molchanov and Hayakawa, 1998; Park et al., 1993). However, only in recent years has the success been reported in the analysis of the Ultra-Low-Frequency (ULF) band as a method for connecting geomagnetic field variation with seismic event (Harada et al., 2004; Hattori, 2002;
Hayakawa et al., 2000; Kawate et al., 1998). The interconnection has also been established for the magnetic field variations that accompany (Varotsos et al., 2003) the seismic electrical signals, which have been reported long time ago (Varotsos and Alexopoulos, 1984) to precede earthquakes. These positive results have been derived not only from the stable and accurate observation of magnetic fields with modernized equipment, but also from the application of up-to-date signal processing techniques that allowed scientists to separate weak precursory signals form noisy geomagnetic field with a high probability.
The Korean Peninsula, located between the seismically active island of Japan and the mainland of China, has been known to be generally safe from
*Corresponding author: [email protected]
*Tel: +82-33-250-6258
*Fax: +82-33-252-5550
Wavelet Based Semblance and Eigenvalue Analysis for Geomagnetic Variation Related to Micro-Earthquakes in the Korean Peninsula
409
seismic hazard, although it experienced earthquakes in the 20th century. Recently, however, with the frequently occurrences of earthquakes, geomagnetic variation related to earthquakes was observed for many times.
Therefore, social concernment increased for earthquakes that various research institution, including Korea Meteorological Administration (KMA), are progressing many studies, especially by geomagnetic analysis.
Prior to the analysis of geomagnetic variation relation to seismic event, three preliminary processes are required; Filling the missing data of geomagnetic time series, prediction of incoming geomagnetic series and geomagnetic background level, Kp-index (Oh, 2009).
Basically, observed geomagnetic time series, used in geomagnetic analysis, should be kept from missing data. However, during the observation of geomagnetic series, equipment error or inspection has making missing data, and it requires a process to fill the gap.
And geomagnetic analysis related to precursor of earthquakes need prediction of geomagnetic series.
This prediction is made based on the geomagnetic periodicity and temporal continuity. In this study, prediction of geomagnetic series and restoration were made based on the geostatistical kriging and Principal Component Analysis (PCA) method. (Ji et al., 2011) Variations in the Earth’s magnetic field can be measured horizontally or vertically at any given location on earth. Such measurements represent different components of the true field direction. The K-index is a measure of variations in the horizontal component of the field. The Estimated Planetary K- index, or Kp-index, is a combination of K-index readings from ground-based magnetometers around the world. The estimated Kp-index gives a good indication of how disturbed the Earth’s magnetic field
has been during the most recent three-hour period.
Kp<4 is a quiet field, Kp=4 is an unsettled field, and Kp>4 indicates a geomagnetic storm. In this study, Kp-index is concurrently considered to estimate the geomagnetic variation related to earthquakes.
This study has progressed by considering the primary two methods, i.e., wavelet based semblance and eigenvalue analysis. These methods are representative each short-term variation analysis and long-term variation analysis that related to earthquakes.
Results regarding a few case of geomagnetic series analysis are discussed in this paper.
Data and Analysis
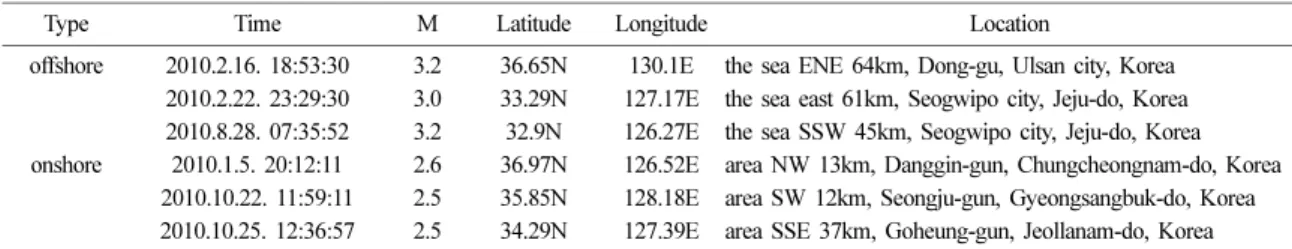
The data used in this study record of total and three component geomagnetic fields measured every second by the Korea Meteorological Administration (KMA), Cheong-yang geomagnetic observatory. Although the KMA measures the geomagnetic data at a rate of 1 Hz, decimation was applied to resample the data at a rate of 1 minute. Table 1 displays the earthquakes that used in this study in the analysis of short-term geomagnetic variation. During the period, earthquakes had been observed 6 times the there was no missing observation.
PCA based Prediction and Reconstruction of Geomagnetic series
Nordemann et al. (2008) analyzed geophysical time series by principal components and iterative regression analysis for the prediction and reconstruction of the series. This approach implements a least-square-based iterative regression method that is applied to the sine functions embedded in the principal components
Table 1. Earthquakes during the studying period
Type Time M Latitude Longitude Location
offshore 2010.2.16. 18:53:30 3.2 36.65N 130.1E the sea ENE 64km, Dong-gu, Ulsan city, Korea 2010.2.22. 23:29:30 3.0 33.29N 127.17E the sea east 61km, Seogwipo city, Jeju-do, Korea 2010.8.28. 07:35:52 3.2 32.9N 126.27E the sea SSW 45km, Seogwipo city, Jeju-do, Korea onshore 2010.1.5. 20:12:11 2.6 36.97N 126.52E area NW 13km, Danggin-gun, Chungcheongnam-do, Korea
2010.10.22. 11:59:11 2.5 35.85N 128.18E area SW 12km, Seongju-gun, Gyeongsangbuk-do, Korea 2010.10.25. 12:36:57 2.5 34.29N 127.39E area SSE 37km, Goheung-gun, Jeollanam-do, Korea
extracted from geophysical time series and represents a useful improvement over non-stationary time series periodicity quantitative analysis. The PCA method applied to the result of autocorrelation of geomagnetic time series is expected to extract eigenvalue and deduct principal component. Then, frequencies reflecting characteristic of principal components are extracted through Fourier transform. The main results of the method are the sine functions embedded in the series analyzed in decreasing order of significance, from the most important ones, with a physical meaning in the processes involved in the generation of the series, to the less important considered as the noise components.
Geomagnetic series with minimized noise components then can be used for reconstruction and prediction. In this study, reconstructed series are made on past representative principal components, and this method anticipates that there will be distinctive geomagnetic variations produced in a sudden earthquake.
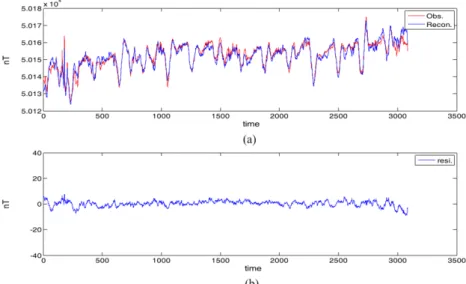
Figure 1 shows reconstructed series overwritten with the observed data and their residual at one of the earthquake cases occurred at offshore. Compared to observed series reconstructed and predicted series seem not to be always perfectly corresponding at every point. However, residual between observed and reconstructed series is steadily consistent and, residual between observed and predicted series maintains good correlation. Based on these preliminary processes for geomagnetic time series, following analysis by the wavelet based semblance is expected to providing some distinctive and prominent result around the earthquake event for reconstructed and predicted series.
Wavelet based Semblance
This section presents the wavelet based semblance method proposed by Cooper and Cowan (2008) for the interpretation of short period analysis of geomagnetic series related to an earthquake. Wavelet transform operation can characterize the localized structure of time series, which it is possible to analyze in the dimensions of frequency (scale) and position. The semblance analysis based on the Fourier transform
suffers from problem associated with that transform, particularly from its assumption that frequency content of data must not change with time (for time-series data) or location (for the data measured as a function of position).
The semblance filtering compares two datasets based on correlations between their phase angles, as a function of frequency. When the Fourier transforms of two datasets are calculated, the difference in their phase angles at each frequency can be computed simply (Christensen, 2003):
(1)
where R1(f ) and I1(f ) are the real and imaginary components of the Fourier transform of dataset 1, expressed as a function of frequency f (R2 and R2 are defined similarly for dataset 2). The semblance S can take on values from −1 to +1. A value of +1 implies perfect anti correlation (Cooper and Cowan, 2008).
The wavelet based approaches provide ability to account for temporal (or spatial) variability in spectral character. The continuous wavelet transform (CWT) of a dataset is a convolution of data with scaled version of the mother wavelet. Unlike the Fourier transform based semblance analysis, the wavelet transform does not assume that the frequency content of a dataset is constant with time (or position), and in fact allow changes in that behavior to be analyzed.
Figure 2 shows the results of the wavelet-based semblance. It depicts a noticeable change of semblance between the reconstructed and observed series over the time of the event. That is, during the earthquake event, the result of semblance is showing distinctive inverse correlation, which means the observed geomagnetic series produced different characteristics of phase with the predicted one. Furthermore, result of Fig. 2 by the semblance analysis of observed and reconstructed geomagnetic data applied to the Jeju earthquake occurred on Feb. 22, 2010 with M=3.0.
Jeju earthquake epic-center has occurred 61km east of Jeju Island. It was offshore earthquake. All of the variation seems to be clearly related with the
S cosθ f( ) R1( )Rf 2f() I+ 1 f()I2 f() R12( )If 12f()× R22f()I22f() ---
= =
Wavelet Based Semblance and Eigenvalue Analysis for Geomagnetic Variation Related to Micro-Earthquakes in the Korean Peninsula
411
Fig. 1. Reconstructed geomagnetic series compared with observed data (a) and residuals (b) of geomagnetic field based in 15 days of observation, Feb. 15-Mar. 1, 2010 at Cheongyang site, KMA.
Fig. 2. Wavelet-based semblance of Fig. 1. (a) represents the observed geomagnetic total field, (b) represents its continuous wavelet time (CWT) real part, (c) represents the reconstructed values from the principal component analysis, (d) represents its CWT real part and (e) indicates the semblance of the two sets of data. The dotted line indicates the events time of the earthquakes.
Fig. 3. Reconstructed geomagnetic series compared with observed data (a) and residuals (b) of geomagnetic field based in 15 days of observation, Aug. 21-Sep. 4, 2010 at KMA observatory..
Fig. 4. Wavelet-based semblance of Fig. 3. (a) represents the observed geomagnetic total field, (b) represents its Continuous Wavelet Time (CWT) real part, (c) represents the reconstructed values from the principal component analysis, (d) represents its CWT real part and (e) indicates the semblance of the two sets of data. The dotted line indicates the events time of the Jeju earthquake.
Wavelet Based Semblance and Eigenvalue Analysis for Geomagnetic Variation Related to Micro-Earthquakes in the Korean Peninsula
413
Fig. 5. Reconstructed geomagnetic series compared with observed data (a) and residuals (b) of geomagnetic field based in 9 days of observation, Jan. 1-9, 2010 at the KMA observatory.
Fig. 6. Wavelet-based semblance of Fig. 5. (a) represents the observed geomagnetic total field, (b) represents its Continuous Wavelet Time (CWT) real part, (c) represents the reconstructed values from the principal component analysis, (d) represents its CWT real part and (e) indicates the semblance of the two sets of data. Scale 1200. The dotted line indicates the events time of the Dang-jin earthquake.
Fig. 7. Wavelet-based semblance of Fig. 5. (a) represents the observed geomagnetic total field, (b) represents its Continuous Wavelet Time (CWT) real part, (c) represents the reconstructed values from the principal component analysis, (d) represents its CWT real part and (e) indicates the semblance of the two sets of data. The dotted line indicates the events time of the Dang-jin earthquake.
Fig. 8. Reconstructed geomagnetic series compared with observed data (a) and residuals (b) of geomagnetic field based in 9 days of observation, Oct. 17-25, 2010 at the KMA observatory.
Wavelet Based Semblance and Eigenvalue Analysis for Geomagnetic Variation Related to Micro-Earthquakes in the Korean Peninsula
415
earthquake event.
Figure 3 shows the reconstructed series overwritten with the observed data and residuals at one of the offshore case, comparing observed and reconstructed series together.
Figure 4 also shows the results by the semblance analysis of observed and reconstructed geomagnetic data applied to the Jeju earthquake occurred on Aug.
28, 2010 with M=3.2. The epicenter of Jeju earthquake was located 45 km north-west of Jeju Island.
Figures 5 and 8 show the reconstructed series overwritten with the observed data and residuals at onshore case, comparing observed and reconstructed series together.
Figures 6 and 7 show similar results by the semblance analysis of observed and reconstructed geomagnetic data applied to the Dang-jin earthquake occurred on Jan. 5, 2010 with M=2.6. Epic-center of
this earthquake was located 13 km north-west of Dang-jin province. It was onshore earthquake. Figure 6 shows the variation seems to be not clearly related with the earthquake event. But, when the scale of Y axis is extended to 1400 (Fig. 7), the variation seems to be clearly related with the earthquake event.
Figure 9 shows the similar results by the semblance analysis of observed and reconstructed geomagnetic data applied to the Sung-ju earthquake occurred on Oct. 22, 2010 with M=2.5. Epic-center of Sung-ju earthquake was located 12 km south-west of Sung-ju province. Figure 9 shows the variation seems to be clearly related with the earthquake event.
Offshore and onshore earthquake have different distance from geomagnetic observatory. The Offshore earthquake is more far than onshore. So, the distance effects may be appeared in the semblance analysis.
The offshore earthquake’s magnitude was over 3, but onshore magnitude was less 3. If earthquake occurred Fig. 9. Wavelet-based semblance of Fig. 8. (a) represents the observed geomagnetic total field, (b) represents its Continuous Wavelet Time (CWT) real part, (c) represents the reconstructed values from the principal component analysis, (d) represents its CWT real part and (e) indicates the semblance of two sets of data. The dotted line indicates the events time of the Sung-ju earthquake.
near the geomagnetic observatory, the wavelet-based semblance variation would be enhanced clearly.
However, it seems to be hard to related between offshore and onshore earthquake event. So, as more research on microearthquake-related geomagnetic variation is produced, our understanding will be robust.
PCA based Eigenvalue Analysis of Geomagnetic series
In eigenvalue analysis of geomagnetic time series, it was known that the first eigenvalue is related to the diurnal geomagnetic variation, the second and third eigenvalue provide earthquake-related information, when data from closely located three stations are available (Hattori et al., 2004). Korean Peninsula doesn’t have enough geomagnetic observatories for eigenvalue analysis. So, to overcome this problem,
eigenvalue analysis for single site was considered.
That is, three components of the geomagnetic field were used to make a covariance matrix. Since data from only single site is used, the result would not be stable compared to result from traditional three independent sites (Oh, 2012). However, in some regions with sparse distribution of geomagnetic observatory, this approach will overcome the problem more or less.
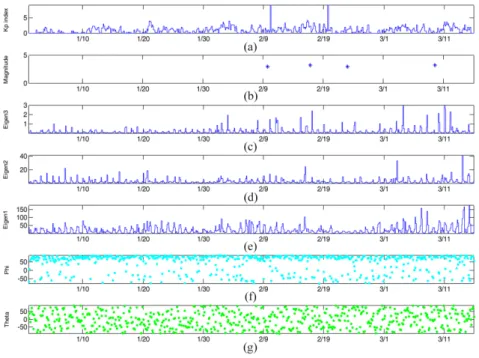
Figures 10, 12 and 14 show the result of eigenvalue analysis obtained by using KMA geomagnetic data.
Figures 10, 12 and 14 have different data length each other. Figure 10 is geomagnetic data based in 127 days of observation, Apr. 27-Aug. 31, 2009. Figure 12 is geomagnetic data based in 74 days of observation, Jan. 1-Mar. 15, 2010. And Fig. 14 is geomagnetic data based in 65 days of observation, Aug. 23-Oct.
26, 2010. Figures 10 and 12 show the earthquake Fig. 10. Eigenvalue analysis of three component geomagnetic data. (a) represents the Kp index, (b) represents the earthquake events plotted with its magnitude, (c) represents the third eigenvalue, (d) the second eigenvalue, (e) represents the first eigenvalue, (f) represents the degree Phi of eigenvector, (g) represents the degree Theta (degrees) of eigenvector (Hattori et al., 2002). The time reference for x axis is UTC+9.
Wavelet Based Semblance and Eigenvalue Analysis for Geomagnetic Variation Related to Micro-Earthquakes in the Korean Peninsula
417
magnitude over 3, but Fig. 14 is over 2. Figures 11, 13 and 15 show result of wavelet based semblance filtering of Kp-index and Eigenvalue of three components of geomagnetic data.
Figures 10, 12 and 14 show the eigenvalue pattern from PCA analysis of geomagnetic data from single site which it is unclear whether the geomagnetic variations are related to the earthquake. Only two eigenvalues are displayed for each horizontal magnetic component X and Y. The result is not clear to find any significant variation related to the earthquake event and the second eigenvalue seems to be seriously contaminated by 24 hours of diurnal magnetic oscillation that means the seismo-electric effect may be hindered (Oh, 2012). This semblance filtering is based on the notion that the Kp, which represents the earth’s background electromagnetic noise, is correlated with the geomagnetic field, so that the eigenvalue
series can be filtered into two parts. One is the components that are highly correlated with the Kp index, which are thought to originate from external electromagnetic sources and which appeared as the rejected part in the filtering analysis.
Figures 11, 13 and 15 show the filtered results of the eigenvalue series of this study. This criterion tends to reduce the residual by rejection. Figures 11, 13 and 15 are made up of only the eigenvalues series, the rejected part of the filtering process depicts a significant variation during the event, even for the small-magnitude earthquake (M<4.0). Figures 11, 13 and 15 show the same filtered pattern when no earthquake was observed. The rejected component of Eigenvalue from filtering with Kp-index patterns have a stable amplitude. And Figs. 11 and 13 show the unstable amplitude before the earthquake event occurred. The Kp index is a measure of geomagnetic Fig. 11. Result of wavelet based semblance filtering of Kp index and Eigenvalue of three components of geomagnetic data. (a) Kp index, (b) earthquake events plotted with its magnitude, (c) Rejected component of Eigenvalue from filtering with Kp index, (d) original eigenvalue. The time reference for x axis is UTC+9.
Fig. 12. Eigenvalue analysis of three component geomagnetic data. (a) represents the Kp index, (b) represents the earthquake events plotted with its magnitude, (c) represents the third eigenvalue, (d) the second eigenvalue, (e) represents the first eigenvalue, (f) represents the degree Phi of eigenvector, (g) represents the degree Theta (degrees) of eigenvector (Hattori et al., 2002). The time reference for x axis is UTC+9.
Fig. 13. Result of wavelet based semblance filtering of Kp index and Eigenvalue of three components of geomagnetic data. (a) Kp index, (b) earthquake events plotted with its magnitude, (c) Rejected component of Eigenvalue from filtering with Kp index, (d) original eigenvalue. The time reference for x axis is UTC+9.
Wavelet Based Semblance and Eigenvalue Analysis for Geomagnetic Variation Related to Micro-Earthquakes in the Korean Peninsula
419
Fig. 14. Eigenvalue analysis of three component geomagnetic data. (a) represents the Kp index, (b) represents the earthquake events plotted with its magnitude, (c) represents the third eigenvalue, (d) the second eigenvalue, (e) represents the first eigenvalue, (f) represents the degree Phi of eigenvector, (g) represents the degree Theta (degrees) of eigenvector (Hattori et al., 2002). The time reference for x axis is UTC+9.
Fig. 15. Result of wavelet based semblance filtering of Kp index and Eigenvalue of three components of geomagnetic data. (a) Kp index, (b) earthquake events plotted with its magnitude, (c) Rejected component of Eigenvalue from filtering with Kp index, (d) original eigenvalue. The time reference for x axis is UTC+9.
perturbation in a logarithmic scale, so it may not perfectly correct. So, Fig. 15 has many earthquake events and not good enough relation eigenvalue filtering variation. But some events show the good relation before or after the earthquake. The results show the eigenvalue analysis is good prediction method to long-term geomagnetic variation with earthquake events. However, some part of the eigenvalue analysis seems to be unrelated to the event is not understood, which indicates that this process requires more research on additional data.
Concluding Remarks
In this study, newly adopted signal processing techniques and the highly resistive basement of the Korean Peninsula play an important role in allowing the successful separation of the seismic related signal from the geomagnetic series, even in a relatively weak magnitude of earthquake. The principal components and iterative regression analysis of the geomagnetic field produced a reconstructed series, and its comparison with the observed series by means of the wavelet- based semblance showed a significant change of semblance at the moment of an earthquake event. The wavelet-based semblance analysis shows the good relation between short-term geomagnetic variation and the earthquake events. Furthermore, Offshore and Onshore earthquake have distance effect in the semblance analysis. In this study, it can be shown as the earthquake occurred near the geomagnetic observatory, the wavelet-based semblance variation enhanced clearly. But, it seems to be hard to related between offshore and onshore earthquake event.
For the long-term interpretation of geomagnetic series related to earthquake, concept of filtering technique for eigenvalue of geomagnetic series based on the wavelet transform was applied. As the result, the rejected component of eigenvalue from filtering with Kp-index patterns have a small amplitude in filtered result when the earthquake do not happen for long period. During the period of earthquake eigenvalue analysis shows the good relation between
long-term geomagnetic variation and the earthquake event. Before the earthquake, the filtering amplitude appeared to be stable. So, eigenvalue analysis shows a good relation between long-term geomagnetic variation and the earthquake event. However, the Kp index is a measure of geomagnetic perturbation in a logarithmic scale, so it may not perfectly correct. Finally, it seems to need more research on micro-earthquake related geomagnetic series and analysis with more observatory data.
Acknowledgments
This work was funded by the Korea Meteorological Administration Research and Development Program under Grant CATER 2012-8020.
References
Christensen, A.N., 2003, Semblance filtering of airborne potential field data. In: Extended Abstracts, 16th ASEG Conference and Exhibition, Adelaide.
Cooper, G.R.J. and Cowan, D.R., 2008, Comparing time series using wavelet-based semblance analysis. Computers
& Geosciences, 34, 95-102.
Harada, M., Hattori, K., and Isezaki, N., 2004, Transfer function approach to signal discrimination of ULF geomagnetic data. Physics and Chemistry of the Earth, 29, 409-417.
Hattori, K., Serita, A., Gotoh, K., Yoshino, C., Harada, M., Isezaki, N., and Hayakawa, M., 2004, ULF geomagnetic anomaly associated with 2000 Izu Islands earthquake swarm, Japan. Physics and Chemistry of the Earth, 29, 425-435.
Hattori, K., Takahashi, I., Yoshino, C., Nagao, T., Liu., J.Y., and Shieh, C.F., 2002, ULF Geomagnetic and Geopotential measurement at Chia-Yi, Taiwan. Journal of Atmospheric Electricity, 22, 217-222.
Hayakawa, M., Itoh, T., Hattori, K., and Yumoto, K., 2000, ULF electromagnetic precursors for an earthquake at Biak, Indonesia on February 17, 1996. Geophysical Research Letters, 27, 1531-1534.
Ji, Y., Oh, S., Suh, B., Lee, D., 2011, Restoration, prediction, and noise analysis of geomagnetic time- series data. Journal of the Korean Earth Science Society, 32, 613-628.
Johnston, M., 1997, Review of electric and magnetic fields accompanying seismic and volcanic activity. Surveys in Geophysics, 18, 441-475.
Wavelet Based Semblance and Eigenvalue Analysis for Geomagnetic Variation Related to Micro-Earthquakes in the Korean Peninsula
421
Kawate, R., Molchanov, O.A., and Hayakawa, M., 1998, Ultra-lowfrequency magnetic fields during the Guam earthquake of 8 August 1993 and their interpretation.
Physics of the Earth and Planetary Interiors, 105, 229- 238.
Molchanov, O.A. and Hayakawa, M., 1998, On the generation mechanism of ULF seismogenic electromagnetic emissions. Physics of the Earth and Planetary Interiors, 105, 201-210.
Nordemann, D.J.R., Rigozo, N.R., de Souza Echer, M.P., and Echer, E., 2008, Principal components and iterative regression analysis of geophysical series: Application to Sunspot number (1750-2004). Computers & Geosciences, 34, 1443-1453.
Oh, S., 2009, Variation analysis of geomagnetic data observed around the event of Andong earthquake (May 2, 2009). Journal of the Korean Earth Science Society, 30, 683-691.
Oh, S., 2012, Geomagnetic variation and its relation to microearthquakes in the seismically inactive Korean Peninsula. Geosciences Journal, 16, 47-58.
Park, S.K., Johnston, M.J.S., Madden, T.R., Morgan, F.D., and Morrison, H.F., 1993, Electromagnetic precursors to earthquakes in the ULF band: A review of observations
and mechanisms. Review of Geophysics, 31, 117-132.
Reasenberg, P.A., 1999, Foreshock occurrence before large earthquakes. Journal of Geophysical Research, 104, 4755-4768.
Rikitake, T. and Honkura, Y., 1985, Solid earth geomagnetism. Springer, London, UK, 385 p.
Tsuruoka, H., Ohtake, M., and Sato, H., 1995, Statistical test of tidal triggering of earthquakes: Contribution of the ocean tide loading effect, Geophysical Journal International, 122, 183-194.
Varotsos, P.A. and Alexopoulos, K., 1984, Physical properties of the variations of the electric field of the earth preceding earthquakes. Tectonophysics, 110, 73-98.
Varotsos, P.A., Sarlis, N.V., and Skordas, E.S., 2003, Electric fields that “arrive” before the time-derivative of the magnetic field prior to major earthquakes. Physical Review Letters, 91, 148-501.
Wan, Y.-G., Wu, Z.-L., Zhou, G.-W., Huang, J., and Qin, L.-X., 2002, Global test of seismic static stress triggering model. Acta Seismologica Sinica, 15, 318- 332.
Wu, Z.-L., 1999, Nature debates, http://helix.nature. com/
debates/ (June 29th 2012)
Manuscript received: July 11, 2012 Revised manuscript received: August 2, 2012 Manuscript accepted: August 24, 2012