*정회원,백석대학교 정보통신학부(교신저자)
**정회원,상지대학교 컴퓨터정보공학부 접수일자 2010.10.20 수정일자 2010.11.20 게재확정일자 2010.12.15
논문 2010-6-7
계층분석방법을 이용한 교차로망의 실시간 교통제어
Realtime Traffic Control of Traffic Networks using Analytic Hierachy Process
진현수*, 홍유식**
Hyun-Soo Jin*, Yoo-Sik Hong**
요 약 본문은 단일 교차로의 주기시간을 결정하는 시간 간격을 계층분석방법(Analytic Hierachy Process)을 이용하 여 도출하여 내었다. 주어진 불확실한 상황 가운데 결정적인 도출물을 얻기위해서는 비선형특성의 퍼지 적분이나 적 응 계수를 사용하여 얻어내어야 하는데 이를 기반으로한 방법이 계층분석방법이다. 계층분석방법을 사용한 제어기와 고정시간 제어를 한 교통제어기와의 비교를 위하여 모의 실험을 통한 결과를 가지고서 비교 검토하였다.
Abstract The paper presents a method for decision the optimal cycle time during the vehicle traffic control in single intersection with AHP. To solve this uncertainty optimization problem, the optimization index in the form of linear addition and fuzzy measurement is assumed and fuzzy integral is used. Examples of solution for two cases of optimal cycle time in two traffic controller are presented and compared.
Key Words : Traffic control, Analytic hierachy process, Optimal cycle time
I. Introduction
The most important factor that allows an increase in the traffic flow at a isolated intersection is reducing simultaneous cycle time and vehicle delay time.
Nowdays the most widely used traffic controller at a single intersection is T.O.D(Time of Date)method. The advances in traffic control algorithm and recent developements in microprocessor technology have made variable-cycle time traffic controller available.
These systems work in real time and designed on the basis of optimal control theory, adaptive control theory, using the classical webster controller etc.
The control of an isolated traffic intersection has
been addressed over the pasr sixty years by many different techniques which varied from rigid fixed time single plan control to complex real time adaptive algorithms. The traffic control problem can be described as an optimization of the controller output which is green time allocated to conflicting traffic streams with in the scope of desirable cycle time (phase green time) by minising the number of stops and the duration of delays. This paper aims to investigate the application of real time AHP algorithm.
The main objectives of this work are as follows.
II. Traffic engineering backround and isolated intersection mathematical
models
The first semaphore-type traffic signals were installed outside the House of Parlament, London, in 1868. This device appears to be the orgin of the three- colour signal which spread across the USA in the early 1920's. In Great Britain the first vehicle actuated lights were installed in the City of London in April, 1932.
Traditional control methods are based on an empirical transfer function between traffic counts and sets of green times - i.e. timing plan.
Webster formulae provide cycle length and green split (phase green time) expressed in seconds.
×
(1)
,
(2)
= cycle time in seconds
= traffic volume(critical) phase A in vehicles/hour;
= saturation flow, phase A in vehicles /hour;
= integration time(lost time),the total of yellow and all red time in the
Fixed-time control is implemented by a switching device which acts on a basis of a predetermined timing plan as derived from the formulas.
This method results in a significant waste of energy/fuel due to andis based on averaged historical data. It is considered not appropriate for the control of an isolated intersection.
Vehicle actuated control(VA) use inductive loops and detectors at all approaches to the intersection. Once a phase has been given right-of-way, it shall continue for a present minimum green time. Phase may be extended beyond the minimum green time by request from detector inputs. This method is very effective for isolated intersections and undersaturated conditions. In case of oversaturation the controller operates as fixed time controller with maximum green times.
Microprocessor Optimized Vehicle Actuation is a traffic responsive, self-optimizing method of traffic control. It
employs on-line minimizing logic for delays stops for undersaturated conditions and capacity maximizing logic for oversaturated conditions. MOVA is regarded as the state-of-art in the control of an isolated intersections.[1]
III. The Analytic Hierchy Process
1. Traffic criteria and hierachy
There are a number of factors underlying isolated intersection traffic control. Traffic situation control parameter is more complex than the present traffic control parameter which is only vehicle numbers. In order to a more comprehensive study of the traffic control process inclusive both easy-to-quantify vehicle volume factors and hard-to-quantify traffic equipments factors. Vehicle numbers are separated to other factors which are passing vehicle numbers and delayed vehicle numbers. In addition to the two major vehicle factors, traffic situation equipments are also important factors.
Road length and road width is necessary factors. In complex, the number of vehicles passing start-line at isolated intersections is considered not only passenger cars but also traffic equipments. At first, consider vehicles arriving at a fixed time traffic signal on a single-lane approach for only through traffic. The cycle time C of the signal consists of effective green and red periods of duration G and R respectively.[2]
2. Application of the AHP method
The afore mentioned factors affect the optimizing traffic control cycle time in vary degrees. It is essential that the order of importance of each factor be determined and be assigned a suitable priority. Measure to overcome the detrimental effect of these factors on the optimizing cycle time can then be implemented.
Factors having interrelated to passenger or delayed vehicles, have a greater impact on traffic control and hence warrent stronger remedial measures The Analytic Hierarchy Process has been used quite
effectively to pritorize these factors.[3]
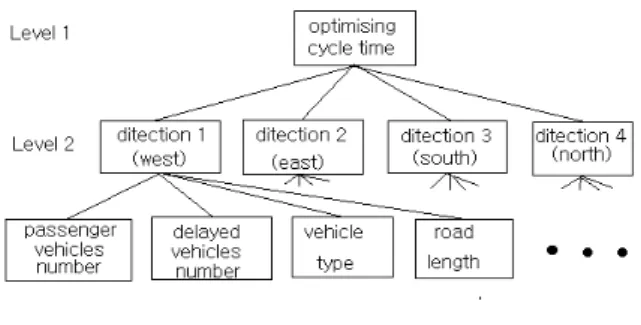
The decision schema analytic hierachy process is shown below
그림 1. AHP의 계층구조
Fig. 1. Traffic hierachy layer for AHP
A distinction is made between local and global priorities. a local priority reflects the importance (priority)of an element in a certain level with respect to an element immediately above it. A global priority reflects the importance of an element with respect to the focus of the problem. The derivation of local priorities is carried out through the use of a comparison scale and a pair-wise comparison matrix. A comparison matrix for deriving the priority vector
⋅⋅⋅ is associated with 3 elements in a specific level with respect to a single element in a level immediately about it. Such a matrix is denoted by A.[4]
A comparison is also being made of the jth element with the ith element. This results in the comparison matrix being a reciprocal matrix satisfying =
.
, where wis the priority vector and n is the comparison matrix whose element satisfy = a ik
for all ( ) In this consistent case the matrix A is written as a clad given by
(3)
In general we have = λmax ⋅ , where max is the largest or principal eigenvalue of the comparison
matrix, which can be shown to satisfy max≧,(
is the order of matrix) with equality holding true only in the perfectly consistency case. The consistency index(CI) is an indication of the accuracy of the method and defined as:
CI = ( max - n) / (n - 1) (4) This consistency index will assume the value zero only in the perfectly consistent case and will be positive otherwise.[5]
IV. Applicable of the AHP method to traffic problem
The decision scheme required for our specific problem is illustrated below. The overall goal and the factors which affect this goal are defined. The relative weights assigned to these factors by each of traffic situation parameter under consideration have to be determined. A glance at this global matrix tells us how important a certain factor is in comparison to the other factors. For this global matrix, the principal eigen value λmax, the consistency index(CI) and the consistency ratio are calculated. The random index (RI) for n=6 order matrix is 1.24.
1. Comparison between four isolated intersection direction
The next step is to compare the importance that each company assign to these factors. Four parameter matrices are constructed and pair-wise comparisons are performed between the elements.
The two matrices are multiplied are to obtain the overall weight of direction as shown below
a p a d a t a r bp b d bt br c p c d c t c r d p d d d t d r
pd rt
(5)
Overall weight of west direction A = a p⋅p+ a d⋅d+ a t⋅t+ a r⋅r
Overall weight of west direction B = b p⋅p+ bd⋅d+ bt⋅t+ b r⋅r
Overall weight of west direction C = c p⋅p+ c d⋅d+ c t⋅t+ c r⋅r
Overall weight of west direction D = d p⋅p+ d d⋅d+ d t⋅t+ d r⋅r
The order of priority assigned to the different factors by a traffic situation parameter is compared with the priotity assigned to the factors by a traffic observation.
2. Traffic control process
As far as it is known to the authors, no case of the best control method practically applied to urban road traffic signal systems. Nevertheless, the objective of traffic control process is to determine the optimized cycle time that will maximize transportation performance. Possible criteria to fix this order are the sequence of request, the kind of vehicle (bus or tram), proximity velocity, the rank of importance of the line, the schedule(being late or not),the number of transported people,the road length and width, etc.[6]
표 1. 동쪽방향의 AHP숫자
Table 1. AHP number of east direction passenge
vehicles delayed
vehicles vehicles
type Road length passenge
vehicles 1 3 3/2 2
delayed
vehicles 1/3 1 1/3 1/2
vehicles
type 2/3 3 1 4/3
road
length 1/2 2/1 3/4 1
표 2. 북쪽방향의 AHP숫자
Table 2. AHP number of north directon passenge
vehicles delayed
vehicles vehicles
type Road length passenge
vehicles 1 3/2 1 3
delayed
vehicles 2/3 1 2 1/3
vehicles
type 1 3/1 1 1
road
length 3/1 1/2 1 1
time of green phase is allowed and a better optimized cycle time is to possible many passenger vehicles can through the stop line of intersection.
Hence the next step is first employ AHP to obtain the overall priority weights from raw data from easy-to-quantify factors as well as hard-to-quantify factors. Next, we will employ optimizing programming(op) so as to maximize the sum of the overall priority weights from AHP. The direction selection is the outcome of the op optimization. This process is discussed in below.
⋅ (6)
: index of situation parameter = 1,⋅⋅⋅,
: index of direction, =
1(east),2(west),3(south),4(north),5(east-south),
⋅⋅⋅,
: estimated cycle time of direction
Mathematical expression (1) states that the objective is to maximize the sum of overall priority weights.
We's are from AHP. Expression(2) states that the total cycle time of the selected alternatives must be less than or equal to the optimized cycle time. Finally, constraint(3) states that the expected total one cycle time of alternatives allowances must be less than or
equal to the minimized cycle time. Thus far, the next step is developing the mathematical formulation of the OP programming. As mentioned previously, the overall priority weights of all alternatives. There are three projects under consideration , the overall priority weights for alternatives webster formula, Green shields's formula AHP methods. the overall priority weights for alternatives W,G,A are 0.3484, 0.3303, and 0.3213. At the same time, the one cycle time for minimized cycle time is 230 seconds. The expected green time per minimized one duration time, Webster formula, green shields formula, AHP. methods are 120 sec,50sec,220sec. The total cycle time available for minimized delayed time is 300 seconds. On the other hand, the green phase time of alternatives W,G, and A are 220 seconds,230 seconds 120 seconds, respectively.
Moreover, the estimated total cycle time or webster formula for alternatives Webster formula for alternatives W,G,A per one cycle time. Hence projects W,G,A are selected, the total cycle time is 550 seconds while the total delayed vehicle time is 220 seconds.
Finally, the sum of the priority weights at the optimality is 0.3246
V. Simulation results
Every 10 persons have made out comparison table for a intuitional comparison value each 20 seconds in the second investigation. Passing vehicles numbers is compared with one entry road and three entry roads which are allocated every three persons for the directions which is inspected traffic alternative plan of every one and Ansan City Hall - Chojikdong , Ansan City Hall - Kumsokgongdan are allocated every two persons and are inspected three traffic alternative plans at the same time. Statistical errors are got by comparison of measure value
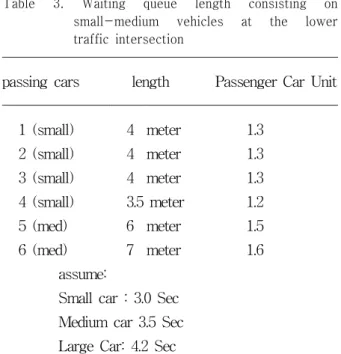
표 3. 사지교차로상의 지체차량숫자
Table 3. Waiting queue length consisting on small-medium vehicles at the lower traffic intersection
passing cars length Passenger Car Unit
1 (small) 4 meter 1.3
2 (small) 4 meter 1.3
3 (small) 4 meter 1.3
4 (small) 3.5 meter 1.2
5 (med) 6 meter 1.5
6 (med) 7 meter 1.6
assume:
Small car : 3.0 Sec Medium car 3.5 Sec Large Car: 4.2 Sec
In Fig.1, There are no large vehicles, No occurrence of spillback phenomenon.
Optimal Capacity < Upcap - Occv 4+4+4+3.5+6+7)=28.5 METER < 30 METER Upcap : Maximum upper intersection capacity Upcap equals 100 meter
Occv: Total occupied distance at the upper intersection
Optimal Capacity: ∑ wq(i) n=1
Total waiting vehicles length wq(i) : (4+4+4+3.5+6+7)=28.5 meter
Table 1a is shown the comparison of waiting vehicles per vehicles form and vehicles kinds are composed of small size, medium size, large size. Fig.
2 is results of modeling for the Ansan rotary circumference which is center of Ansan. Traffic situation of Ansan City Hall
This affect increase of period time of full period.
Small value of result value presents good effect and it shows many of permission passing vehicles numbers which is short of perid time for same passing vehicles ratio when fixed time period is criterion.
Ansan City Hall Intersection
EXIT 1 EXIT 2
EXIT 3 EXIT 4
그림 2. 안산시청 교차로의 주변교차로상황
Fig. 2. Peripheral region of Ansan City Hall intersection.
In this paper assume that It takes 3 seconds for a small car and 4.2 seconds for a large car to pass through a crossroad. Moreover, large car left-turn departure time is 1.3 seconds longer than straight departure time and a bus or a truck has a value of 1.5 times of a passenger car. In order to improve vehicle waiting time and spillback phenomenon, We must know how many vehicles come in the traffic intersection and if the vehicle is small or large.
Therefore, in this paper we proposed fuzzy AHP traffic light will improve average vehicle speed and spillback phenomenon.
표 4. AHP신호와 기존신호와의 지체차량수
Table 4. Comparisons between fuzzy AHP traffic light depending on saturation rate and conventional traffic light
rationsatu rate
vehicle speed
Conventional
method AHP
traffic light
% km/
hour T.O.D. waiting time WAL
K waiting time
83 17 30 7 sec 20 3 sec
71 12 30 11 sec 20 9 sec
85 18 30 10 sec 20 8 sec
62 08 30 4 sec 20 6 sec
55 36 30 6 sec 20 4 sec
34 32 30 12 sec 20 15 sec
47 25 30 10 sec 20 7 sec
38 27 30 17 sec 20 14sec
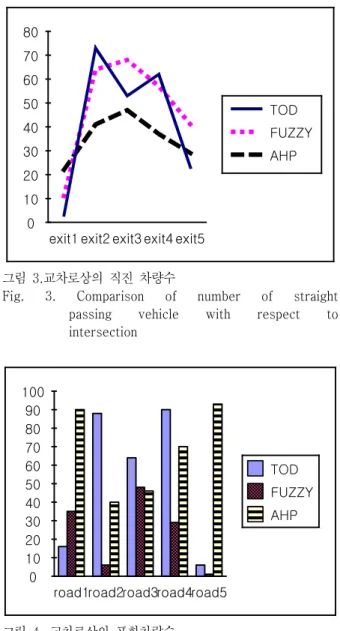
Fig. 2, Fig. 3 and Fig. 4 show comparison of waiting time of fuzzy traffic light and conventional traffic lightat peripheral region of Ansan City Hall intersection(Exit 1, Exit 2, Exit 3, Exit 4, Intersection IE). For the fuzzy AHP traffic controller, the average waiting time decreased by 15 percent when compared with the conventional controller.
0 10 20 30 40 50 60 70 80
exit1 exit2 exit3 exit4 exit5
TOD FUZZY AHP
그림 3.교차로상의 직진 차량수
Fig. 3. Comparison of number of straight passing vehicle with respect to intersection
0 10 20 30 40 50 60 70 80 90 100
road1road2road3road4road5
TOD FUZZY AHP
그림 4. 교차로상의 포화차량수
Fig. 4. Occupied vehicle number at each intersection, when straight passing car
Finally, the proposed AHP traffic controller system has been implemented using look up table method and tested with various types of traffic condition.
저자 소개 진 현 수(정회원)
․제 10권 4호 참조
․현 백석대학교 정보통신학부 교수
․<주관심분야: 로보틱스, 임베디드시스템 이동로봇 등>
홍 유 식(종신회원)
․제 10권 2호 참조
․현 상지대학교 컴퓨터공학부교수
․<주관신분야: 퍼지시스템, 전문가시스템 신경망, 교통제어>
VI. Conclusion
On single intersection case, results compared with a AHP controller and fixed time controller in aspect of vehicles delay showed that AHP controller has a very good result of simulation than a fixed time controller at point of view of "allowance of only straight passing vehicles" and "allowance of left turning vehicles". On coordinated intersection case, AHP controller has a good quality for preventing of the forward spillback than a fixed time controller and fuzzy logic controller on the view points of traffic performance index. AHP controller proposed a new cycle time considered directly the subject of traffic users and convert the direction weight to cycle decision time and process many traffic parameter simultaneously. Consequently, AHP controller has improved the reduction of delay time for vehicles about from 10 to 20 percent than a fixed time controller in intersection. In the future, based on this dissertation, the further study on AHP controller is required including traffic parameters such as road facilities, five branch intersection, working area in traffic zone.
References
[1] R. E. Allsop, "Delay at a Fixed Time Traffic Signal.I :Theoretical Analysis", Transp. Sci., vol.
6, No. 3, pp. 260-285, 1972
[2] K. G. Courage, S. M. Parapar, "Delay and Fuel consumption at Traffic Signals", Traffic Engineering, Vol. 45, Nov. pp. 23-27, 1975
[3] W. Brilon, N. Wu: Delay at Fixed Time Traffic Signals under Time Dependent Traffic conditions, Traff. Engng. Contol, vol. 31, No. 12, pp. 623-631, 1990.
[4] C. P. Pappis, E. H. Mamdani, "A Fuzzy Logic Controller for a Traffic Junction", IEEE Trans. Syst., Man, Cybern., vol. 7, No. 10, pp.
707-717, 1977.
[5] M. Jamshidi, R. Kelsey, K. Bisset,"Traffic Fuzzy Control: Software and Hardware Implementations", Proc. 5th IFSA, pp. 907-910, Seoul, Korea, 1993.
[6] H. S. Jin, "A Study on Fuzzy Traffic Signal Control using Analytic Hierarchy Process", Ph.
D dissertstion, Univ. of Seoul, 2000.