∙ Received: December 29, 2010. Accepted: March 7, 2011.
∙ Corresponding author: Jong Min Seung
Department of Nuclear Medicine, Seoul National University Hospital, 101 Daehang-ro, Jongno-gu, Seoul, 110-744, Korea
Tel: +82-2-2072-2535, Fax: +82-2-766-9083 E-mail: [email protected]
승종민⋅이형진⋅김진의⋅김현주⋅김중현⋅이재성 ⋅이동수
The Evaluation of Resolution Recovery Based Reconstruction Method, Astonish
Jong Min Seung1, , Hyeong Jin Lee1, Jin Eui Kim1, Hyun Joo Kim1, Joong Hyun Kim2Jae Sung Lee1,2 and Dong Soo Lee1,2
1Dept. of Nuclear Medicine, Seoul National Univ. Hospital, 2Dept. of Nuclear Medicine, Seoul National Univ.
Objective: The 3-dimensional reconstruction method with resolution recovery modeling has advantages of high spatial resolution and contrast because of its precise modeling of spatial blurring according to the distance from detector plane. The aim of this study was to evaluate one of the resolution recovery reconstruction methods (Astonish, Philips Medical), compare it to other iterative reconstructions, and verify its clinical usefulness.
Materials and Methods: NEMA IEC PET body phantom and Flanges Jaszczak ECT phantom (Data Spectrum Corp., USA) studies were performed using Skylight SPECT (Philips) system under four different conditions;
short or long (2 times of short) radius, and half or full (40 kcts/frame) acquisition counts. Astonish reconstruction method was compared with two other iterative reconstructions; MLEM and 3D-OSEM which vendor supplied.
For quantitative analysis, the contrast ratios obtained from IEC phantom test were compared. Reconstruction parameters were determined by optimization study using graph of contrast ratio versus background variability.
The qualitative comparison was performed with Jaszczak ECT phantom and human myocardial data. Results:
The overall contrast ratio was higher with Astonish than the others. For the largest hot sphere of 37 mm diameter, Astonish showed about 27.1% and 17.4% higher contrast ratio than MLEM and 3D-OSEM, in short radius study.
For long radius, Astonish showed about 40.5% and 32.6% higher contrast ratio than MLEM and 3D-OSEM. The effect of acquired counts was insignificant. In the qualitative studies with Jaszczak phantom and human myocardial data, Astonish showed the best image quality. Conclusion: In this study, we have found out that Astonish can provide more reliable clinical results by better image quality compared to other iterative reconstruction methods. Although further clinical studies are required, Astonish would be used in clinics with confidence for enhancement of images. (Korean J Nucl Med Technol 2011;15(1):58-64)
Key Words : Resolution recovery, MLEM, 3D-OSEM, Astonish
서 론
SPECT 영상에서의 resolution recovery를 기반으로 하는 3D 재구성 기법은 detector면으로부터 거리에 의한 공간적
blur를 보상하여 향상된 spatial resolution과 contrast를 가지 는 특징이 있다. 최근 본원에서는 이러한 기법 중의 하나인 Philips사의 Astonish를 myocardial SPECT 검사에 도입하였 다. 본 논문에서는 새로 도입한 Astonish 프로그램을 기존에 사용하고 있는 MLEM, 3D-OSEM과의 차이를 이해하고자 phantom 실험을 실시하여 비교해 보고 실제 환자 data에도 적용해 평가하여 임상적 유용성을 높이고자 하였다.
Fig. 1. This is NEMA IEC PET body phantom which consists of a body phantom, a lung insert and 6 fillable spheres (diameter: 10, 13, 17, 22, 28 and 37 mm).
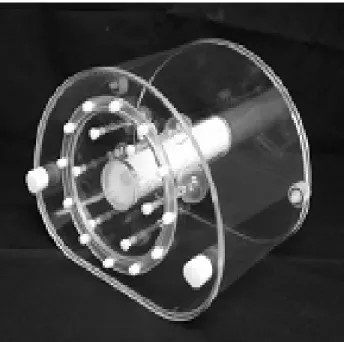
Fig. 2. This is Flanged Jaszczak ECT phantom which has solid spheres and numerous cold rods inside.
실험재료 및 방법
1. 실험기기 및 재료
모든 phantom 실험은 Skylight SPECT system (Philips, USA)에서 시행하였고 phantom은 NEMA IEC PET body phantom (Data Spectrum corp., USA)와 Flanged Jaszczak ECT phantom (Data Spectrum corp., USA)을 사용하였다 (Fig. 1, 2). 실제 환자의 myocardial SPECT data는 CardioMD (Philips, USA)에서 획득하여 비교하였다.
2. 영상 획득
두 가지의 phantom 실험에서 zoom factor는 1.0, matrix size는 128×128로 기본적인 영상 획득 인자는 동일하게 적용 하였다. 계수 획득과 거리의 변화에 대한 차이를 알아보기 위하여 lateral radius와 vertical radius를 조절하여 phantom과 detector 사이의 거리를 짧은 거리 (phantom과 detector가 최 대한 붙여진 거리)와 먼 거리 (짧은 거리보다 10 cm 더해진 거리)로 구분하고, full time (40 kcts/frame)과 half time (full time의 절반)으로 나누어 총 4가지의 조건에서 실험을 실시 하였다.
1) NEMA IEC PET body phantom의 sphere를 제외한 외
부의 background에 99mTc 3 mCi를 주입하고 나머지 6개의 sphere에는 background의 6배에 해당하는 activity로 채운 후 실험하였다.
2) Flanged Jaszczak ECT phantom에 물을 가득 채우고
99mTc 8 mCi를 주입하여 영상을 획득하였다.
3. 영상 재구성
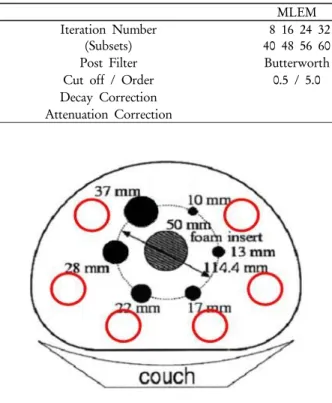
영상 획득 후 NEMA IEC PET body phantom의 data를 MLEM, 3D-OSEM, Astonish로 각각 재구성하였다. Post filter의 선택과 cut off 및 order값은 각 재구성 기법의 특성 에 맞도록 설정하였고 subset은 ‘8’로 고정하고 iteration 수를 8가지로 변화하면서 비교해 보았다. 3D-OSEM과 Astonish 는 3-10 (1간격씩 8가지), subset은 ‘8’로 설정하였고 MLEM 은 3D-OSEM과 Astonish의 subset을 고려하여 8-60 (8간격 씩 8가지)으로 설정하였다;
4. 영상 분석
최적의 iteration 수를 찾기 위하여 각 재구성법의 8개의 다른 iteration 수로 재구성된 영상에서 sphere와 background 에 대한 ROI (region of interest)를 그려보았다. NEMA IEC PET body phantom의 6개의 hot sphere의 ROI를 그리고 각 sphere와 동일한 크기의 6개의 ROI를 5개의 slice에 걸쳐 총
Decay Correction Yes
Attenuation Correction Yes (coefficient: 0.12)
Fig. 3. The six ROIs were drawn for each hot sphere and 30 ROIs in total were drawn in the background (6 same sized ROIs as each sphere × 5 slices).
<Percent contrast for each hot sphere j>
% 1 100 /
1 / , ,
, ×
−
= −
B H
j B j H j
H a a
C Q C
<Standard deviation of the background ROI counts in j>
30 , ) 1 /(
) (
1
2 , ,
, − − =
=
∑
=
K k C C SD K
k
j B k j B j
<Percent background variability for sphere j>
% 100
*
, j B
j
j C
N =SD
Fig. 4. These formulas were used for analysis of percent contrast and percent background variability.
Contrast ratio
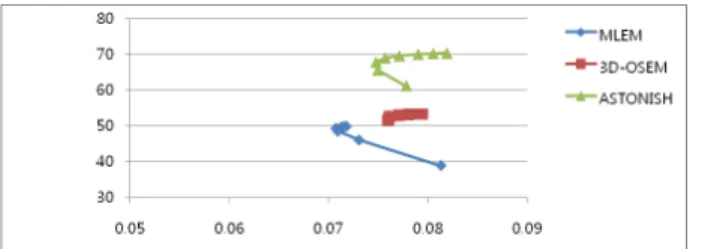
Fig. 5. The graph shows contrast ratio versus background variability for 8 sec long radius scan at 37 mm sphere.
Contrast ratio
Fig. 6. The graph shows contrast ratio versus background variability for 8 sec short radius scan at 37 mm sphere.
30개의 ROI를 background 부위에 그려 Fig. 4의 공식을 사 용하여 percent contrast ratio와 percent background variability를 구해 보았다(Fig. 3). 이로부터 세 가지의 각 재 구성법에서 background variability에 따른 contrast ratio의 변화 양상을 그래프로 나타내었고 background variability가 낮으면서 contrast ratio가 비교적 높은 iteration 수를 최적의 iteration 수로 정하여 찾아보았다. 이 최적의 iteration 수를 Flanged Jaszczak ECT phantom 영상의 재구성에 적용하여 비교하여 보고 실제 환자의 myocardial SPECT data에 대해 서도 육안적 평가를 실시하였다.
결 과
1. NEMA IEC PET body phantom의 background variability에 따른 contrast ratio
가장 큰 크기인 37 mm sphere에서의 background varia- bility에 따른 contrast ratio의 변화양상을 그래프로 나타내어 보았다(Fig. 5-8).
4가지 조건의 실험에서 모두 비슷한 형태의 그래프가 나 왔으며 대체적으로 contrast ratio가 높아짐에 따라 back- ground variability는 낮아지다가 다시 높아지는 형태를 보였다.
Fig. 7. The graph shows contrast ratio versus background
variability for 16 sec long radius scan at 37 mm sphere. Fig. 8. The graph shows contrast ratio versus background variability for 16 sec short radius scan at 37 mm sphere.
8 sec long radius scan
Spheres MLEM 3D-OSEM Astonish
10 mm 7.43 7.79 8.11
13 mm 9.42 10.45 10.12
17 mm 15.03 16.88 19.02
22 mm 23.6 24.63 37.17
28 mm 32.55 35.48 53.24
37 mm 49.99 52.71 70.00
Table 2. Contrast ratios at optimal iteration numbers of each reconstruction method for 8 sec long radius scan
8 sec short radius scan
Spheres MLEM 3D-OSEM Astonish
10 mm 6.57 6.67 5.25
13 mm 12.49 13.64 14.27
17 mm 27.68 31.58 35.60
22 mm 31.89 39.10 50.03
28 mm 38.97 44.83 57.31
37 mm 55.33 60.29 71.28
Table 3. Contrast ratios at optimal iteration numbers of each reconstruction method for 8 sec short radius scan
16 sec long radius scan
Spheres MLEM 3D-OSEM Astonish
10 mm 3.89 3.16 5.65
13 mm 8.74 9.48 11.92
17 mm 17.87 20.85 24.72
22 mm 26.02 28.74 40.76
28 mm 34.42 38.29 55.09
37 mm 49.37 52.56 69.60
Table 4. Contrast ratios at optimal iteration numbers of each reconstruction method for 16 sec long radius scan
16 sec short radius scan
Spheres MLEM 3D-OSEM Astonish
10 mm 10.47 10.89 10.05
13 mm 11.91 13.80 13.37
17 mm 21.43 23.57 28.49
22 mm 29.44 32.43 44.06
28 mm 36.74 39.08 51.65
37 mm 51.16 54.95 64.08
Table 5. Contrast ratios at optimal iteration numbers of each reconstruction method for 16 sec short radius scan
2. 최적의 iteration 수
위와 같은 그래프에서 각 재구성법 별로 비교적 back- ground variability가 낮으면서 contrast ratio가 높은 iteration 수를 찾아내어 최적의 iteration 수로 정하였다. 단, contrast ratio가 높다고 해서 그 수를 선택하지 않았고 iteration 수가 커질수록 재구성하는 시간이 길어지는 것을 감안하여 결정하 였다. MLEM은 32, 3D OSEM은 4, Astonish는 7로 정하였다.
3. 최적의 iteration 수에서의 각 재구성법의 contrast ratio
앞서 정한 최적의 iteration 수에서의 각 sphere 별로 contrast ratio을 비교하였다. 전반적인 contrast ratio는 Astonish가 높았지만 작은 사이즈의 sphere에서는 MLEM이 나 3D-OSEM이 다소 높은 수치를 나타내기도 하였다.
Contrast ratio의 격차는 sphere의 크기가 커질수록 두드러졌 으며 대체적으로 MLEM, 3D-OSEM, Astonish 순으로 향상 되는 것을 볼 수 있었다(Table 2-5).
4. Flanged Jaszczak ECT phantom에 최적의 itera- tion 수를 적용한 영상 비교
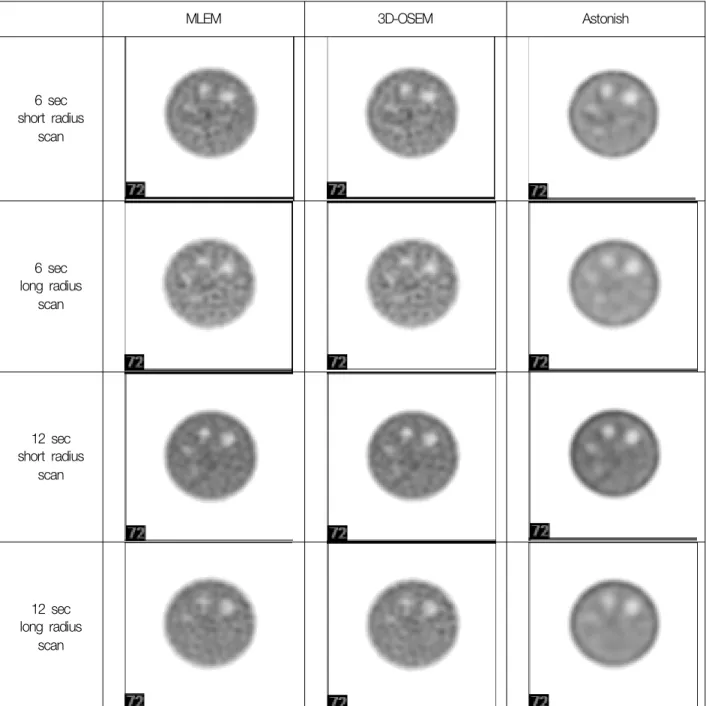
NEMA IEC PET body phantom test에서 정하였던 각 재 구성법의 최적의 iteration 수를 Flanged Jaszczak ECT phantom에 적용하여 재구성하였다. MLEM과 3D-OSEM에 서는 sphere의 윤곽이 불분명하고 sphere 외의 background가 거친 반면에 Astonish에서는 비교적으로 sphere의 윤곽이 원 형의 형태로 드러나고 전체적인 sphere 외의 background가 균일한 것을 볼 수 있었다(Fig. 9).
short radius scan
6 sec long radius
scan
12 sec short radius
scan
12 sec long radius
scan
Fig. 9. Flanged Jaszczak ECT phantom images were reconstructed with optimal iteration numbers of each method which were chosen with NEMA IEC PET body phantom test.
5. 실제 환자의 영상 비교
2009년에 본원에 내원한 환자의 myocardial SPECT 영상 이다. CardioMD (Philips)를 이용하여 영상을 획득하였으며 기존의 재구성법인 MLEM, 추가적으로 3D-OSEM과 Astonish로 재구성해 보았다. Full counts로 획득한 영상이었 기 때문에 육안적으로 영상의 질적인 차이는 크게 나지 않지 만 상대적으로 MLEM과 3D-OSEM에 비해 Astonish의 영상
에서의 심근의 모양이 좀 더 선예해졌음을 알 수 있었다. 1년 후, 2010년에 재 방문한 동일 환자의 영상은 획득 counts를 약 30% 감소시켰고 Astonish를 이용하여 재구성하였다. 획 득한 counts는 줄었지만 영상의 질적인 면에서는 비슷한 수 준으로 유지가 되었고 MLEM와 3D-OSEM보다 영상의 육 안적인 향상이 있음을 알 수 있었다(Fig. 10-13).
Fig. 10. Myocardial SPECT images with full counts were
reconstructed with MLEM (Feb. 2009). Fig. 11. Myocardial SPECT images with full counts were reconstructed with 3D-OSEM (Feb. 2009).
Fig. 12. Myocardial SPECT images with full counts were reconstructed with Astonish (Feb. 2009).
Fig. 13. Myocardial SPECT images with 30% reduced counts were reconstructed with Astonish (Apr. 2010).
결론 및 고찰
본원에 새로 도입한 Astonish의 특성을 좀 더 이해하고자 기존의 MLEM과 3D-OSEM과의 비교를 해보았다. 제조사 에서 Astonish라는 재구성법이 영상 획득 시간을 획기적으로
논문에서는 좀 더 영상의 질적인 면에서 접근하여 보았다.
결론적으로 Astonish가 다른 iterative 재구성법에 비하여 전 반적으로 나은 contrast ratio를 보여주었고 육안적 평가에서 도 향상된 영상을 보여주었다. 하지만 본 논문에서는 영상의 질에 영향을 주는 다양한 인자들을 모두 고려하기에는 어려
될 것이라 사료된다.
요 약
SPECT 영상에서의 resolution recovery를 기반으로 하는 3D 재구성 기법은 detector면으로부터 거리에 의한 공간적 blur를 보상하여 높은 spatial resolution과 contrast를 가지는 특징이 있다. 본 논문에서는 이러한 재구성 기법 중의 하나 인 Philips사의 Astonish 프로그램을 phantom 실험을 통하여 기존의 재구성 기법과 비교, 평가하고 임상적 유용성을 높이 고자 하였다.
Skylight SPECT system (Philips)에서 NEMA IEC PET body phantom과 Flanges Jaszczak phantom (Data Spectrum corp.)을 이용하여 시간과 거리에 따른 4가지의 다른 입력 조 건에서 실험을 실시하였다. 가까운 거리와 먼 거리 (짧은 거 리보다 10 cm 더해진 거리)에서 각각 full time (40 kcts/frame)과 half time (full time의 절반)을 적용하여 영상을 얻고, iteration 수에 변화를 주어 MLEM, 3D-OSEM, Astonish로 영상을 재구성하였다. NEMA IEC PET body phantom의 각 sphere에서 background variability에 따른 contrast ratio의 변화양상을 확인하고 각 재구성 기법에서의 최적의 iteration 수를 찾아보았다. 이로부터 얻은 최적의
짧은 거리에서는 Astonish가 MLEM과 3D-OSEM보다 각각 27.1%와 17.4%의 더 높은 contrast ratio를 보였고, 먼 거리 에서는 40.5%와 32.6%로 더 높았다. 그러나 시간에 따른 변 화의 차이는 크게 나타나지 않았다. 또한, 육안적 평가에서 Astonish가 다른 두 재구성 기법에 비하여 더 좋은 영상을 보 였다.
이 실험에서는 정량적 분석 및 육안적 평가를 통하여 Astonish가 기존의 영상 재구성 기법인 MLEM과 3D-OSEM 에 비하여 시간을 단축시켜 업무의 효율성을 높일 뿐만 아니 라 질적으로도 우수한 영상을 구현하여 임상적으로 신뢰성 이 높은 검사 결과를 제공할 수 있음을 확인하였다.
REFERENCES
1. Jinghan Ye, Xiyun Song, Mary K. Durbin, Margaret Zhao, Ling Shao, Jody Garrard et al. SPECT image quality improvement with Astonish software. www.medical.philips.com 2006;1-8
2. Philips Medical Systems. Increased image quality or reduced scan times. www.medical.philips.com 2007;1-4
3. Philips Medical Systems. Philips Astonish advanced reconstruc- tion algorithm. www.medical.philips.com 2009;1-6
4. Shaun Marczak, Bobby Lang, Carlyn Johnson. Half-time myocardial perfusion imaging with Philips Astonish reconstruction. J Nucl Med 2008;49:435