1. 서 론
대사증후군은 심혈관계 질환(atherosclerotic cardiovascu-
lar disease)의 직접적인 위험지표로 잘 알려져있는 대사질환 위험 인자들의 집합체로 정의하고 있다(Grundy et al., 2005).
대사증후군은 기관에 따라 진단기준이 차이가 있으나 국립
†
Corresponding author: 김경윤, [email protected], 광주광역시 북구 용봉로77(용봉동), 전남대학교 식품영양학과 Information available at the Culinary Society of Korea (http://www.culinary.re.kr/)
Culinary Science & Hospitality Research
Journal & Article Management System: https://cshr.jams.or.kr/
그림 21~28
http://dx.doi.org/10.20878/cshr.2017.23.8.018
혈당 수준에 따른 대상자의 커피 섭취와 대사증후군 위험 지표와의 관련성 연구 : 2015년 제 6기 국민건강영양조사 자료를 바탕으로
김경윤†
전남대학교 식품영양학과
Relationship between Coffee Intake and Metabolic Syndrome Risk Factors according to Blood Glucose Level
: From the Sixth Korea National Health and Nutrition Examination Survey (KNHANES Ⅵ-3) 2015
Kyoung Yun Kim
†Dept. of Food and Nutrition, Chonnam National University
KEYWORDS ABSTRACT Prediabetic state,
Coffee intake, Blood pressure, Triglycerides.
The purpose of this study was to investigate the relationship between coffee intake and metabolic
syndrome, which has increased the burden of social illness, based on the data of the 6
thNational Health
and Nutrition Survey in 2015. The subjects' coffee intake level was divided into <1 cup/a day, 1 ~2
cups/a day, and ≥3 cups/a day and the general characteristics of the subjects were examined according
to the classification. The effect of coffee consumption on the risk factors of metabolic syndrome was
evaluated by OR value. The age of the subjects was higher than that of the other groups in the < 1
cup/day group and the TG in the prediabetic group was above the normal level in the ≥3 cups/day
group. In the normal group of blood glucose, coffee intake was the highest in <1 cup/day group and
BP was significantly different according to intake. In the multiple regression analysis conducted to
identify the causal relationship between the risk of metabolic syndrome and coffee intake, BP was
significantly decreased in ≥3 cups/day coffee group in normal group. In order to control the level of
blood lipids in pre-diabetic subjects, it is necessary to establish dietary guidelines for foods that are
frequently consumed, and various situations and long-term studies are needed to determine the precise
effect of coffee intake on BP.
콜레스테롤 교육 과정 성인 치료 패널(National Cholesterol Education Program-Adult Treatment Panel Ⅲ, NCEP ATP Ⅲ) 이 제시한 기준은 다음과 같다. 복부비만이 허리둘레(waist circumference, WC) 남성 90 cm, 여성 85 cm 이상인 경우, 혈중 중성지방(triglyceride, TG) 농도가 150 mg/dL 이상인 경 우, 고밀도 콜레스테롤(high density lipoprotein cholesterol, HDL- cholesterol) 이 남성 40 mg/dL, 여성 50 mg/dL 미만인 경우, 공복 혈당(fasting blood glucose, FBG)은 100 mg/dL 이 상 또는 당뇨병 치료 중인 경우, 혈압(blood pressure, BP)은 수축기혈압(systolic blood pressure, SBP) 130 mmHg 이상 또 는 이완기혈압(diastolic blood pressure, DBP) 85 mmHg 이상 인 경우에서 5가지 지표 가운데 3가지 이상이 해당되면 대 사증후군이라고 진단한다(National Institutes of Health, 2002).
대사증후군은 제2형 당뇨병과 심혈관질환의 발병 위험을 높 이는 것으로 보고되고 있으며(Alberti, 2009), 2007년 실시한 역학조사 결과 생활방식 특히, 식습관이 대사질환과 관련한 위험인자들에 분명한 관련성이 있음을 보여주었다(Getz &
Reardon, 2007). 또한 2016년 국제학술지인 유럽영양학회지 (European Journal of Nutrition)에 Rodríguez-Monforte 등 (2016)이 대사증후군과 식사패턴과의 연관성을 연구한 메타 분석에 따르면 채소가 풍부한 건강한 식습관이 대사증후군 의 발병 위험을 낮추어주며, 육류 섭취 빈도가 높은 서구식 의 식습관이 대사증후군의 발병 위험을 높인다고 보고하였 고, 2008년 연구(Lutsey, Steffen, & Stevens, 2008)에서도 유제 품 섭취가 대사증후군에 대한 보호효과를 가진다고 밝혀 식 사와 질병과의 관련성이 있음을 보여주는 연구 사례가 다수 보고되었다.
커피는 세계에서 소비가 증가하는 음료 중 하나이며 세계 커피 생산량은 2000~2010년까지 해마다 약 0.5%씩 상승하 여 2001~2002년도에 111백만 bag(60 kg per bag)이었고 2008 ~2009년도에는 133백만 bag에 이르렀다고 하며, 한국 은 2012년도에 비하여 2016년도에 커피 소비가 7.3% 증가하 였다고 보고되었다(International Coffee Organization, 2017).
커피 시장 보고서에 따르면, 국내 소비자는 다양하고 세련 된 커피의 맛을 즐겨함에도 불구하고 Arabica 원두를 이용 하여 제조되는 인스턴트 커피가 2011년 국내 커피 시장의 90%를 차지했다고 하였다(USDA'S Global Agriculture Infor- mation Network, 2011). 하지만 인스턴트 커피에 과도한 설탕 과 크림이 함유되어 있어 혈압, 공복혈당과 같은 대사증후 군 위험 인자를 높일 수 있다는 연구 결과(Kim, Cho, Jacobs,
& Park, 2014) 도 보고되었다. 이와는 달리 커피 섭취가 장- 뇌 축(Gut-Brain Axis)에 영향을 미쳐 대사이상을 줄여줌으 로써 건강효과를 주는 이점을 가진다는 연구 결과도 보고되 었고(Holtmann & Talley, 2014) 자주 또는 많이 섭취할 수록 당뇨병 발병 위험에 역의 연관성을 보인다는 결과(Ding et
al., 2014)도 보고되었다. 또한 커피 섭취와 심혈관계질환에 대한 연구를 보고한 Chrysant(2015)에 따르면 1주에 28잔 이 상(> 28 cups/ a week)의 커피 섭취자가 아니라면 전-고혈압 과 전-심혈관질환 대상자도 커피를 삼가야 할 필요는 없고 오히려 커피 섭취로 인하여 중립의 혹은 긍정적인 건강효과 를 볼 수 있다고 하였다. 하지만 지금까지의 연구 결과는 커 피 섭취와 건강과의 일관된 연관성을 규정짓기에는 무리가 있다. 2015년도 질병관리본부에서 실시하는 국민건강영양 조사(Ministry of Health and Welfare, 2015)에서 한국인의 다 빈도 기호식품을 조사한 결과 식품섭취빈도 조사에 포함된 112개 음식 항목 중 주당 섭취빈도가 높은 상위 5개 항목에 커피가 11.6회로 포함된다고 보고되었기 때문에 커피가 건 강효과에 미치는 영향에 대한 연구가 필요하다고 여겨진다.
또한 커피가 섭취량에 따라 제 2형 당뇨병과 만성질환의 유 병률에 유의적인 연관성을 보인다는 연구 결과에 따라 한국 인의 기호식품이며 다빈도 식품인 커피의 섭취 실태를 혈당 수준에 따라 2015년도 국민건강영양조사 자료를 토대로 조 사하여 대사증후군 위험인자에 미치는 영향을 분석하고자 하였다.
2. 이론적 배경
대사증후군은 국제당뇨병연맹(International Diabetes Fede- ration, IDF) 에서 혈압과 복부지방의 상승, 지질대사와 당질 대사이상과 같은 증상이 개인에게 복합적으로 발생하는 것 이라고 정의하였으며, 비감염성질환(non-communicable di- seases, NCDs)인 제2형당뇨병(type-2 diabetes mellitus, T2DM), 심혈관계질환(cardiovascular disease, CVD)의 발병 원인(Cor- nier et al., 2008) 이라고 알려져 있는 지질 대사(DeFronzo &
Ferrannini, 1991)의 비정상적인 조절과 인슐린 저항성(Rea-
ven, 1988)에 중요한 발생학적 원인으로 지목되고 있다. 식
사 요인인 커피는 Bae 등(2014)이 보고한 바에 의하면 탄수
화물, 지질, 비타민과 무기질, 페놀 화합물 등의 복잡한 화학
물질로 구성되어 있다고 하였다. 커피의 다양한 성분으로
인하여 심혈관계질환 뿐만 아니라 최근에는 정신건강과의
연관성에 대한 연구도 보고되고 있다(Baspinar, Eskici, & Oz-
celik, 2017). 보고에 따르면 카페인이 혈압 상승, 대사 속도
증가, 이뇨에 영향을 미치며 반대로 간 손상에 대한 보호효
과를 보이며, 섭취 수준에 따라 대사증후군을 포함한 제 2형
당뇨병의 발병 위험을 감소시킨다고 하였다. 하지만 커피
섭취와 질환과의 연관성 결과는 선행 연구 결과에서 보듯이
모순적이기 때문에 한국인의 다빈도 기호식품으로 조사된
커피 섭취가 대사증후군 위험인자에 미치는 영향을 분석하
여 적절한 섭취 수준을 제안하는 것은 질병 발생 위험을 관
리하기 위하여 필요하다고 판단된다.
3. 연구방법
3.1. 연구 설계와 연구대상자
본 연구는 혈당 수준에 따라 대상자들의 커피섭취와 대사 증후군 위험지표와의 가능한 연관성을 분석하기 위하여 KNHANES 제 6기 3차년도(2015) 자료를 활용하였고, *****
생명윤리위원회(IRB: Institute Review Board)의 승인을 받아 실시하였다(IRB KGU-20170414-HR-013). 보건복지부와 질 병관리본부가 실시하는 KNHANES는 국민 전체를 모집단으 로 하는 순환표본조사(rolling sampling survey)이며 횡단 연 구이다.
2015년 1월부터 12월까지 실시된 조사에서 혈액 검진 및 영양 섭취 조사에 모두 참여한 30세 이상 65세 미만 성인 총 3,455명 중 연구 결과에 영향을 미칠 수 있다고 판단된 만성질환자와 혈당 조절 약물 복용 중인 자, 혈압 관련 약물 을 복용 중인 자, 호르몬 치료를 받고 있는 자, 비만 치료 중인 자, 하루의 섭취 열량이 500 kcal 미만인 자와 5,000 kcal 이상을 섭취한 자, 임신부, 수유부를 포함한 1,466명을 제외 하였다. 본 연구의 주요 변수인 커피 섭취조사, 체질량지수 (body mass index, BMI) 대사적 지표에 결측자료가 없으며, 24시간 회상법을 통한 식사섭취조사에서 평상시 식사섭취 량과 유사하였다고 응답한 자를 포함하여 총 1,402 명을 대 상자로 선정하였다. 총 1,402명의 대상자는 미국당뇨협회 (American Diabetes Association, ADA) 에서 정의하는 기준에 근거(American Diabetes Association, 2010)하여 공복 혈당 (fasting blood glucose, FBG) 100 mg/dL 미만인 자를 혈당 정상 군(n=1,133)으로 정하였고, 공복혈당이 100 mg/dL 이상 126 mg/dL 미만인 경우를 전당뇨병군(n=269)이라고 하였다.
3.2. 일반적 특성과 신체계측
대상자의 일반적 특성과 신체계측은 2015년 KNHANES 의 자료를 이용하였다. KNHANES 연구 대상자의 건강 설문 조사는 가구 조사, 교육 현황 조사, 경제 수준, 이환, 음주, 흡연, 신체활동을 포함하며, 신체계측 검진을 실시하여 체 중, 신장, 허리둘레를 측정하였다. 신체계측 및 혈압측정은 표준화된 방법으로 숙련된 조사자에 의해 시행되었다. 대상 자는 일회용 검진가운을 착용한 후 체중과 신장을 측정하였 으며 체중은 0.1 kg, 신장은 0.1 cm까지 측정하였고, 체중 및 신장에 의한 BMI를 산출하였다. 허리둘레(waist circumference, WC)는 피부에 힘이 가해지지 않게하여 마지막 늑골 하단과 장골능선의 윗부분 두 지점의 0.1 cm까지 측정하였다. 정확 한 혈압을 측정하기 위해 측정하기 5분 전 안정을 취한 후, 팔 둘레에 따른 적절한 커프를 선택 한후 혈압계에 연결하 여 수은 혈압계로 측정하였다.
3.3. 생화학적 검사
생화학적 검사는 2015년 KNHANES의 자료를 활용하였 다. 공복혈당 검사를 위하여 최소 8시간 공복상태를 유지한 후 정맥 채혈하여 냉장 보관하였다가 분석을 실시하였다.
FBG, 중성지방(triglyceride, TG), 고밀도 콜레스테롤(high den- sity lipoprotein cholesterol, HDL-C), 저밀도 콜레스테롤(low density lipoprotein cholesterol, LDL-C), 총 콜레스테롤(total cholesterol, TC) 은 Hitachi automatic analyzer 7600-210(Hitachi automatic analyzer 7600-210, Hitachi, Japan) 을 이용하여 효소 법으로 측정하였다. 당화혈색소(glycated hemoglobin, HbA1c) 는 Tosoh G8(Tosoh G8, Tosoh, Japan)을 활용하여 고성능 액 체 크로마토그래피(high performance liquid chromatography) 방법으로 측정하였다. 글루탐산 옥살아세트산 아미노 전이 효소(glutamic oxalacetic transaminase, GOT), 글루탐산 피루 브산 아미노 전이 효소(glutamic pyruvate transaminase, GPT) 는 Hitachi automatic analyzer 7600-210(Hitachi automatic analyzer 7600-210, Hitachi, Japan)을 이용하여 효소법으로 측정하였다.
백혈구(white blood cell, WBC), 적혈구(red blood cell, RBC)와 헤모글로빈은 XN-9000(Sysmex, Kobe, Japan)을 이용하여 측 정하였고, 고감도 C-반응 단백질(high sensitivity C-reactive protein, hs-CRP)는 Cobas(Cobas, Roche, Germany)을 이용하 여 면역비탁법으로 측정하였다. 혈중요소질소는 Hitachi auto- matic analyzer 7600-210(Hitachi automatic analyzer 7600-210, Hitachi, Japan)으로 kinetic UV assay법에 의하여 측정되었다.
3.4. 식사섭취조사
식사량 조사는 2015년 KNHANES 자료를 통하여 얻어진 영양소 섭취 자료를 활용하였다. KNHANES에서 실시된 영 양조사는 숙련된 면접자의 직접 면접으로 대상자의 24시간 회상법으로 실시되었다. 조사 1일전 24시간 동안의 식사정 보, 섭취음식정보, 섭취식품정보 항목을 조사하였다. 연구대 상자의 커피 섭취 수준의 분포를 파악하기 위하여 최근 1년 동안 일상적으로 섭취한 커피 양상을 파악하기 위하여 식품 섭취빈도조사법(Food Frequency Questionnaire, FFQ)을 활용 하였다. FFQ는 1일 3회, 1일 2회, 1일 1회, 1주 5~6회, 1주 2 ~4회, 1주 1회, 1달 2~3회, 1달 1회, 거의 안 먹음의 9개 범주로 구분되어 조사되었다. 본 연구에서는 커피 섭취의 영향을 조사하기 위해 보다 임상 적으로 적용 가능한 방법 으로 9가지 응답을 <1 cup/a day, 1~2 cups/a day, ≥3 cups/a day의 3개 그룹으로 재구성하여 분석을 실시하였다.
3.5. 통계분석
KNHANES 설계는 단순임의표본(simple random sampling)
이 아닌 2단계 층화된 집락표본(two-stage stratified cluster
sampling)을 활용하여 추출되어 자료 분석 단계에서는 복합 표본설계(complex sampling) 내용을 반영하여 분석하였다.
분석은 SPSS 18.0(IBS SPSS Statistics, Armonk, NY, USA)으 로 수행되었다. 각 변수에 따른 기술통계 자료는 mean±stan- dard deviation(SD)로 표기하였다. 대상자의 성별과 커피 섭 취 수준에 따른 일반적 특성을 분석하기 위하여 일반선형모 델(general linear model; GLM)을 활용하였으며, 질적인 변수 의 분석에서는 카이제곱 검정(chi-square test)을 실시하였다.
섭취 수준에 대한 분석은 <1 cup/day, 1~2 cups/day, ≥3 cups/day 의 3개 그룹으로 구분하여 실시하였다. 전당뇨병군 과 혈당 정상군에서의 커피 섭취 수준에 따라 대사증후군 위험인자의 발병 위험(odds ratio, OR value)과 95% 신뢰도 (confidence interval, CI) 를 분석하기 위하여 다항 로지스틱 회귀분석(multiple logistic regression analysis)을 실시하였다.
그리고 분석에 영향을 미칠 수 있는 혼동 인자(confounding
Table 1. General characteristics of subjects according to blood glucose Subjects
P-value
1)Total (n=1,989) Normal (n=1,594) Prediabetes (n=395)
Sex, n (%)
Male 780(39.2)
2)579(36.3) 201(50.9)
0.000
3)Female 1,209(60.8) 1,015(63.7) 194(49.1)
Age (year) 47.1±9.5
2)45.9±9.4 52.0±8.3 0.000
Clinical and nutritional characteristics
Height (cm) 163.5±8.8 163.3±8.7 163.9±9.1 0.164
Weight (kg) 63.4±12.0 61.9±11.4 69.5±12.6 0.000
Waist circumference (cm) 81.1±9.4 79.4±8.8 87.7±8.7 0.000
Body mass index (kg/m²) 23.6±3.3 23.1±3.1 25.8±3.5 0.000
SBP (mmHg) 115.6±15.9 113.8±15.2 123.1±16.6 0.000
DBP (mmHg) 76.4±10.2 75.5±10.0 80.2±10.3 0.000
Fasting blood glucose (mg/dL) 93.6±9.3 90.9±5.6 108.3±6.4 0.000
HbA1c (%) 5.4±0.3 5.3±0.2 5.9±0.2 0.000
Total cholesterol (mg/dL) 194.2±33.9 191.8±32.7 203.7±37.1 0.000
HDL cholesterol (mg/dL) 52.6±12.9 53.7±12.9 48.3±12.1 0.000
Triglyceride (mg/dL) 131.4±102.8 119.5±92 179.7±127.1 0.000
LDL cholesterol (mg/dL) 116.7±30.4 115±29.5 123.6±32.8 0.000
hs-CRP (mg/L) 1.0±1.9 0.9±1.8 1.4±2.3 0.000
All estimates were weighted and calculated taking into account the complex study design.
1)
P value were obtained form Chi-square test for categorical variable and from general linear model (GLM) for continuous variables.
A p value of less than 0.05 was regarded as statistically significant.
2)
Data are expressed as the number of subjects for each category(%) or mean±standard deviation..
Abbreviation: SBP, systolic blood pressure; DBP, diastolic blood pressure; hs-CRP, high sensitivity C-reactive protein.
factor)들을 보정하기 위하여 Model 1은 보정없는 군, Model 2은 성별을 보정한 군, Model 3은 연령과 성별을 보정한 군, Model 4는 Model 3에 BMI를 추가로 보정한 군으로 정하여 4가지 회귀분석 모델을 분석하였다. 통계적인 유의성은 유 의수준 0.05를 기준으로 검증되었다.
4. 결 과
4.1. 혈당에 따른 대상자의 일반적 특성
혈당 수준에 따라 전당뇨병군과 혈당 정상군 대상자들의 성별과 연령 분포 양상, 생화학적 특성에 대한 유의적 차이 를 분석하여 Table 1에 제시하였다. 전체 대상자 1,989명 중 1,594명은 혈당 정상군에, 395명은 전당뇨병군에 속하였다.
혈당 정상군 총 1,594명 중 남성은 579명(36.3%)이고, 여성
은 1,015명(63.7%)이었으며, 전당뇨병 총 395명 중에서 남성
은 201명(50.9%)이고 여성은 194명(49.1%)으로 나타났다. 혈 당 정상군과 전당뇨병군 대상자 간 성별은 유의적인 차이를 보였다(p<0.000). 혈당 정상군 평균 연령은 45.9세, 전당뇨병 군 평균 연령은 52.0세로 조사되었고, 유의적인 차이를 보였 다(p<0.000). 연구대상자의 생화학적, 영양학적 특성은 전당 뇨병군 대상자의 체중, WC, BMI, 수축기혈압(systolic blood pressure, SBP), 이완기혈압(diastolic blood pressure, DBP), HbA1c, TC, TG, LDL-C, hs-CRP 이 혈당 정상군 대상자보다 유의적 으로 높았고(p<0.000), 고밀도 콜레스테롤(high density lipo- protein cholesterol, HDL-C) 은 혈당 정상군이 전당뇨병군 대 상자보다 유의적으로 높았다(p<0.000).
4.2. 커피 섭취 수준에 따른 대상자의 일반적 특성
커피 섭취 수준에 따른 전당뇨병군과 혈당 정상군 대상자 의 일반적, 생화학적 특성을 분석하여 Table 2에 제시하였 다. 전당뇨병군(n=269) 대상자는 커피 섭취 <1 cup/day 군(n=
214)이 연령 52.8세, 1~2 cups/day(n=34)이 51.7세, ≥3 cups/
day(n=21)이 48.2세로 조사되었고 섭취군에 따라 연령의 유 의적 차이를 보였다(p=0.039). 전당뇨병군 대상자의 커피 섭 취군에 따른 생화학적 특성 중 혈중 TG 수준은 <1 cup/ day 군 167.8 mg/dL, 1~2 cups/day 군 200.6 mg/dL, ≥3 cups/ day 군 228.2 mg/dL로 섭취군에 따른 유의적 차이를 나타냈다 (p<0.049). 전당뇨병군 대상자의 커피 섭취군에 따른 영양소 섭취 특성은 유의적 차이를 보이지 않았다. 혈당 정상군 (n=1,133) 대상자는 커피 섭취 <1 cup/day 군(n=825)이 연령 47.3세, 1~2 cups/day(n=144)이 42.7세, ≥3 cups/day(n=164) 이 40.7세로 조사되어 섭취군에 따른 연령의 유의적 차이를 보였다(p<0.001). 생화학적 특성 중 SBP 수준은 <1 cup/day 군 114.9 mmHg, 1~2 cups/day 군 110.9 mmHg, ≥3 cups/day 군 109.3 mmHg으로 섭취군에 따른 유의적 차이를 나타냈다 (p<0.001). 또한 hs-CRP 농도는 <1 cup/day 군 1.0 mg/L, 1~2 cups/day 군 0.7 mg/L로 유의적 차이를 보였으며, 영양소 섭 취 분석 결과 탄수화물, 지방, Monounsaturated fatty acids (MUFAs), Polyunsaturated Fatty Acids(PUFAs), 니아신, 칼슘 의 섭취가 유의했다(p<0.05).
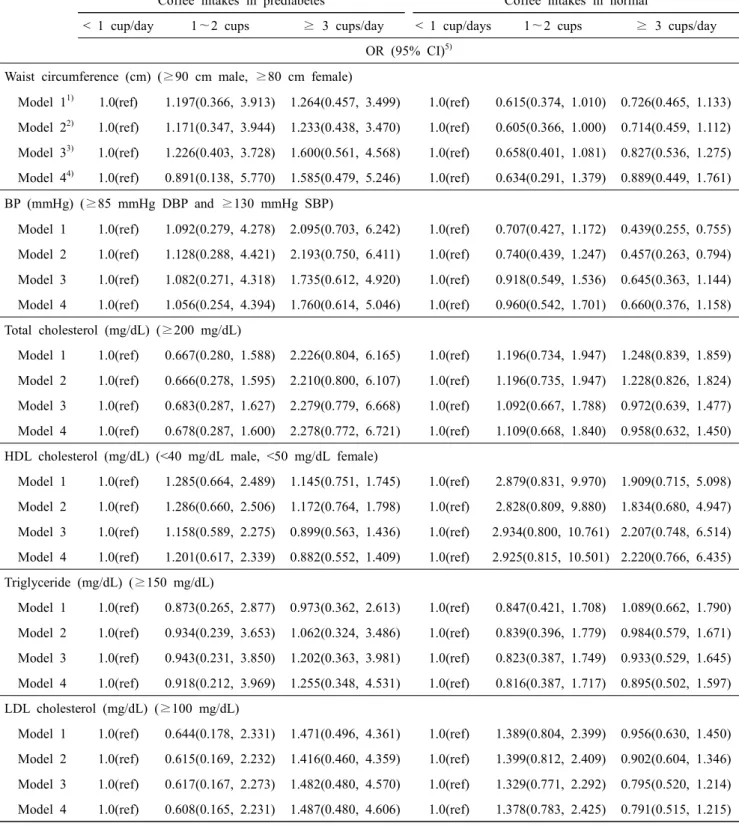
4.3. 대상자의 커피 섭취 수준에 따른 대사증후군 위험인자의 Odds ratio
전당뇨병군과 혈당 정상군에서 커피 섭취와 대사증후군 위험인자 간의 인과관계를 통계적 방법에 의해 추정하기 위 하여 연령, 성별, 체질량지수를 혼동인자로 간주하여 보정시 킨 후 다중회귀분석을 실시하여 제시하였다(Table 3). 전당 뇨병군 대상자의 커피 섭취군에 따른 대사증후군 위험인자 간의 인관관계는 유의적인 결과를 보이지 않았다. 혈당 정
상군의 ≥3 cups/day 군에서 ≥85 mmHg 이완기 혈압과 ≥ 130 mmHg 수축기 혈압일 확률이 model 1에서 0.439배(95%
CI: 0.255~0.755), Model 2에서 0.457배(95% CI: 0.263~
0.794) 유의적으로 감소하였다.
5. 결론 및 시사점
본 연구는 전당뇨병군과 혈당 정상군을 대상으로 커피 섭 취 수준에 따라 일반적인 특성과 생화학적 특성, 영양소 섭 취 특성을 분석하고, 대사증후군 위험인자에 미치는 영향을 분석하였다. 총 1,402명을 대상으로 혈당 기준에 따라 전당 뇨병군 269명, 혈당 정상군 1,133명을 선별하였다. 전당뇨병 군에서 커피 섭취가 <1 cup/day 군의 대상자 연령이 1~2 cups/day 군, ≥3 cups/day 군에 비하여 높았다. 즉, 전당뇨병 군에서 평균적으로 연령이 높은 대상자들이 커피 섭취가 적 은 것으로 평가할 수 있으며 이는 2014년도 50세 이상 건강 한 한국인 성인의 커피 섭취 변화에 대한 연구 수행 결과에 서(Lee & Oh, 2014) 하루 평균 섭취하는 커피 잔 수가 1.92이 며 10년 전 연구 결과보다 ‘하루 1회 이상’ 커피를 섭취하는 성인이 23.7% 증가하였다고 조사한 수준보다는 적은 섭취 수준을 보인 것으로 평가된다. 섭취 수준의 차이를 보인 원 인 중에는 대상자의 건강상태 차이를 고려할 수 있다. 선행 연구(Tabák, Herder, Rathmann, Brunner, & Kivimäki, 2012) 에 서 전당뇨병이 정상 범위의 혈당 수준보다 높아 당뇨병으로 진행할 위험이 큰 상태이며 식생활의 개선을 통하여 40~
70% 정도의 상대적 위험 감소 효과를 볼 수 있다고 보고하 였다. 대한당뇨병학회에서 2016년 발표한 자료(Korean Dia- betes Association, 2016.) 에서 30세 이상 한국인 성인 중 공복 혈당장애(Impaired fasting glucose, IFG) 상태인 당뇨병 전 단 계 유병률이 24.8%로 성인의 약 1/4이 이에 해당하며 특히, 50~59세 성인 남성의 경우는 37.9%의 유병률을 보였다고 하였기 때문에 본 연구에서와 같이 당뇨병으로의 진행을 늦 추기 위하여 고위험군 대상자의 식습관 실태를 조사하여 식 이적 연관성을 연구하는 것은 큰 의미가 있다고 생각한다.
전당뇨병군 대상자의 커피 섭취 수준에 따른 혈중 TG 농도
는 섭취에 따라 유의적으로 증가하였다. 커피는 Cafestol과
kahwoel이라는 커피 오일에서 발견된 터핀류(terpene)를 함
유하고 있어 섭취로 인하여 혈중 지질 농도와 LDL-C 수준
을 높인다고 알려져 있으며 커피를 섭취하는 방식에 따라
종이 필터에 걸러서 섭취를 할 경우 대부분 터핀류가 일정
량 제거된다고 하였다(Jee et al., 2001). 인스턴트 커피의 주
요 원료는 원두와 백설탕, 원유로 역학 연구 결과에 따르면
설탕이 함유된 음료의 섭취는 혈중 지질 농도의 증가(Welsh,
Sharma, Cunningham, & Vos, 2011)와 인슐린 저항성(Bre-
mer, Auinger, & Byrd, 2009), 지방간(Nimer et al., 2008), 제2
T a b le 2 . S u b je c ts c h a ra c te ri s ti c s a c c o rd in g to c o ff e e in ta k e s a n d th e p re s e n c e o f p re d ia b e te s (n = 1 ,4 0 2 )
T o ta l in p re d ia b et es (n = 2 6 9 ) T o ta l in n o rm al (n = 1 ,1 3 3 ) < 1 cu p /d ay (n = 2 1 4 ) 1~ 2 cu p s (n = 3 4 ) ≥ 3 cu p s/ d ay (n = 2 1 ) P -v al u e
1)< 1 cu p /d ay (n = 8 2 5 ) 1~ 2 cu p s (n = 1 4 4 ) ≥ 3 cu p s/ d ay (n = 1 6 4 ) P -v al u e
1)S ex , n (% ) M al e 1 0 1 (4 7 .2 )
2)1 5 (4 4 .1 ) 1 2 (5 7 .1 ) 0 .6 2 3 2 9 5 (3 5 .8 ) 4 3 (2 9 .9 ) 4 8 (2 9 .3 ) 0 .1 4 5 F em al e 1 1 3 (5 2 .8 ) 1 9 (5 5 .9 ) 9 (4 2 .9 ) 5 3 0 (6 4 .2 ) 1 0 1 (7 0 .1 ) 1 1 6 (7 0 .7 ) A g e (y ea r) 5 2 .8 ± 7 .9
2)5 1 .7 ± 9 .6 4 8 .2 ± 6 .9 0 .0 3 9 4 7 .3 ± 9 .2
2)4 2 .7 ± 8 .2 4 0 .7 ± 8 .0 0 .0 0 0 In co m e le v el , n (% ) L o w 2 1 (9 .8 ) 0 (0 ) 1 (4 .8 ) 0 .0 3 0
3)6 3 (7 .6 ) 8 (5 .6 ) 7 (4 .3 ) 0 .0 0 0 6 6 (3 0 .8 ) 1 0 (2 9 .4 ) 4 (1 9 .0 ) 1 9 8 (2 4 ) 2 2 (1 5 .3 ) 1 9 (1 1 .6 ) 6 3 (2 9 .4 ) 5 (1 4 .7 ) 5 (2 3 .8 ) 2 7 4 (3 3 .3 ) 5 2 (3 6 .1 ) 4 5 (2 7 .4 )
L o w -i n te rm ed ia te U p p er -i n te rm ed ia te H ig h 6 4 (2 9 .9 ) 1 9 (5 5 .9 ) 1 1 (5 2 .4 ) 2 8 9 (3 5 .1 ) 6 2 (4 3 .1 ) 9 3 (5 6 .7 ) C li n ic al an d n u tri ti o n al ch ara ct eri st ic s 1 6 3 .3 ± 8 .9 1 6 5 .6 ± 1 0 .2 1 6 6 .2 ± 8 .3 0 .1 7 7 1 6 2 .9 ± 8 .8 1 6 3 .6 ± 8 .4 1 6 4 .3 ± 8 .2 0 .1 3 5 6 9 .3 ± 11 .6 7 2 .7 ± 1 6 .8 7 3 .7 ± 1 6 .5 0 .1 4 8 6 2 .0 ± 11 .2 6 1 .4 ± 11 .5 6 1 .9 ± 11 .1 0 .8 5 9 8 7 .8 ± 8 .1 8 8 .2 ± 9 .9 8 9 .9 ± 9 .7 0 .5 4 5 7 9 .8 ± 8 .8 7 8 .1 ± 8 .2 7 7 .9 ± 8 .5 0 .0 0 9 2 5 .9 ± 3 .3 2 6 .2 ± 3 .6 2 6 .5 ± 4 .3 0 .7 4 0 2 3 .2 ± 3 .1 2 2 .8 ± 2 .9 2 2 .8 ± 3 .1 0 .1 1 8 1 2 2 .9 ± 1 5 .2 1 2 1 .2 ± 1 7 .1 11 7 .8 ± 1 0 .6 0 .2 9 1 11 4 .9 ± 1 5 .6 11 0 .9 ± 1 6 .3 1 0 9 .3 ± 1 2 .0 0 .0 0 0 8 0 .1 ± 9 .5 7 8 .7 ± 9 .3 7 9 .1 ± 9 .1 0 .6 6 4 7 5 .9 ± 9 .8 7 4 .0 ± 1 0 .4 7 3 .6 ± 9 .2 0 .0 0 4 6 .0 0 ± 0 .2 5 .9 ± 0 .2 5 .9 ± 0 .2 0 .2 2 2 5 .3 1 ± 0 .2 3 5 .3 ± 0 .2 5 .3 ± 0 .2 0 .0 9 1 1 0 8 .3 ± 6 .4 1 0 8 .7 ± 7 .3 1 0 7 .4 ± 4 .9 2 0 .7 8 4 8 9 .0 ± 5 .9 8 9 .9 ± 4 .9 8 9 .5 ± 5 .6 0 .6 9 1 2 0 3 .4 ± 3 7 .1 1 9 7 .2 ± 3 9 .0 2 1 4 .3 ± 4 1 .1 0 .2 6 4 1 9 3 .0 ± 3 3 .1 1 9 3 .3 ± 3 1 .7 1 9 0 .5 ± 3 3 .3 0 .6 5 6 4 9 .1 ± 1 2 .0 4 5 .1 ± 1 2 .2 4 9 .4 ± 1 5 .5 0 .2 1 5 5 3 .6 ± 1 3 .0 5 3 .7 ± 1 2 .0 5 5 .1 ± 1 3 .1 0 .4 3 9 1 6 7 .8 ± 1 0 5 .6 2 0 0 .6 ± 1 7 4 .5 2 2 8 .2 ± 1 8 2 .6 0 .0 4 9 11 9 .0 ± 9 0 .4 11 2 .2 ± 8 7 .6 11 0 .8 ± 7 3 .6 0 .4 3 2 1 2 3 .9 ± 3 3 .5 11 6 .6 ± 2 8 .4 1 2 6 .4 ± 4 1 .5 0 .4 4 9 11 6 .2 ± 3 0 .9 11 8 .2 ± 2 6 .9 11 3 .8 ± 3 0 .3 0 .4 3 0 2 7 .6 ± 1 7 .9 2 5 .1 ± 9 .2 2 1 .0 ± 6 .9 0 .1 7 9 2 1 .6 ± 7 .7 1 9 .7 ± 8 .2 1 9 .6 ± 5 .9 0 .0 0 1
H ei g h t (c m ) W ei g h t (k g ) W ai st ci rc u m fe re n ce (c m ) B o d y m as s in d ex (k g /m ²) S B P (m m H g ) D B P (m m H g ) F as ti n g b lo o d g lu co se (m g /d L ) H b A 1 c (% ) T o ta l ch o le st ero l (m g /d L ) H D L ch o le st ero l (m g /d L ) T ri g ly ce ri d e (m g /d L ) L D L ch o le st ero l (m g /d L ) G O T (IU /L ) G P T (IU /L ) 3 1 .4 ± 3 4 .3 2 9 .7 ± 2 0 .3 2 3 .6 ± 1 0 .4 0 .5 4 8 1 9 .4 ± 1 2 .4 1 6 .7 ± 8 .9 1 7 .3 ± 1 0 .5 0 .0 0 8
T a b le 2 . C o n ti n u e d
T o ta l in p re d ia b et es (n = 2 6 9 ) T o ta l in n o rm al (n = 1 ,1 3 3 ) < 1 cu p /d ay (n = 2 1 4 ) 1~ 2 cu p s (n = 3 4 ) ≥ 3 cu p s/ d ay (n = 2 1 ) P -v al u e
1)< 1 cu p /d ay (n = 8 2 5 ) 1~ 2 cu p s (n = 1 4 4 ) ≥ 3 cu p s/ d ay (n = 1 6 4 ) P -v al u e
1)1 4 .2 ± 1 .8 1 4 .3 ± 1 .7 1 4 .4 ± 1 .3 0 .7 0 3 1 3 .9 ± 1 .5 1 3 .8 ± 1 .6 1 3 .6 ± 1 .5 0 .0 2 6 4 2 .9 ± 4 .6 4 3 .2 ± 4 .6 4 3 .5 ± 4 .1 0 .7 8 1 4 2 .3 ± 4 .1 4 1 .7 ± 4 .3 4 1 .2 ± 3 .9 0 .0 0 6 1 5 .3 ± 4 .7 1 4 .6 ± 3 .6 1 3 .9 ± 3 .4 0 .3 4 7 1 3 .6 ± 3 .8 1 3 .9 ± 11 .2 1 2 .8 ± 3 .3 0 .1 0 4 0 .9 ± 0 .5 0 .8 ± 0 .2 0 .9 ± 0 .2 0 .8 6 5 0 .8 ± 0 .3 0 .9 ± 1 .1 0 .8 ± 0 .1 0 .1 1 8
H em o g lo b in (g /d L ) H em at o cri t (% ) B lo o d u re a n it ro g en (m g /d L ) B lo o d cre at in in e (m g /d L ) h s-C R P (m g /L ) 1 .6 ± 2 .9 1 .2 ± 1 .9 1 .1 ± 0 .9 0 .5 3 4 1 .0 ± 2 .1 0 .7 ± 1 .0 0 .7 ± 0 .9 0 .0 4 0 N u tri en ts in ta k es (d ay ) 2 ,0 6 6 .1 ± 7 8 3 .4 2 ,0 2 3 .5 ± 6 7 3 .4 2 ,1 3 8 .0 ± 6 9 8 .1 0 .8 6 4 2 ,0 8 2 .7 ± 9 1 8 .2 1 ,9 4 0 .9 ± 8 1 8 .7 2 ,1 7 4 .5 ± 9 8 7 .5 0 .0 8 0 3 1 2 .9 ± 1 0 7 .0 2 8 9 .8 ± 8 9 .1 3 0 2 .1 ± 1 2 6 .8 0 .4 7 7 3 1 7 .0 ± 1 3 0 .7 2 7 7 .9 ± 9 9 .6 3 1 8 .9 ± 1 4 6 .9 0 .0 0 3 7 1 .4 ± 3 6 .4 7 2 .7 ± 2 8 .7 7 9 .4 ± 2 7 .8 0 .6 0 0 7 2 .3 ± 4 0 .0 7 1 .7 ± 3 9 .7 7 5 .1 ± 3 6 .0 0 .6 7 5 4 4 .0 ± 3 0 .0 4 9 .9 ± 2 8 .6 4 8 .8 ± 2 3 .2 0 .4 5 8 4 6 .4 ± 3 3 .5 4 9 .2 ± 3 5 .6 5 4 .4 ± 3 3 .6 0 .0 2 1 1 .6 ± 1 .5 1 .6 ± 1 .4 1 .8 ± 1 .3 0 .8 3 7 1 .7 ± 1 .7 1 .6 ± 2 .0 1 .9 ± 1 .8 0 .1 6 0 9 .0 ± 6 .9 9 .9 ± 5 .5 1 0 .8 ± 5 .2 0 .4 2 4 9 .9 ± 8 .5 1 0 .6 ± 1 2 .7 11 .9 ± 9 .0 0 .0 5 0 1 4 .1 ± 11 .4 1 6 .0 ± 1 0 .8 1 5 .4 ± 8 .4 0 .6 0 1 1 4 .7 ± 1 2 .0 1 5 .7 ± 11 .6 1 7 .5 ± 11 .8 0 .0 1 7 1 0 .6 ± 7 .8 11 .4 ± 5 .9 1 2 .6 ± 6 .1 0 .4 4 9 11 .6 ± 9 .5 1 2 .2 ± 1 4 .3 1 3 .7 ± 1 0 .2 0 .0 4 5 7 3 8 .1 ± 6 4 0 .3 8 6 8 .4 ± 1 ,7 1 5 .1 6 0 2 .4 ± 3 3 3 .7 0 .5 0 8 7 3 5 .8 ± 7 2 4 .8 6 8 1 .7 ± 5 5 2 .8 7 5 5 .7 ± 7 3 7 .1 0 .6 2 7 3 ,7 1 2 .5 ± 3 7 1 6 .3 2 ,5 6 7 .9 ± 2 0 3 2 .8 2 ,8 9 5 .5 ± 1 ,9 0 8 .6 0 .1 4 0 3 ,6 0 3 .8 ± 3 ,6 6 6 .4 3 ,2 5 7 .9 ± 3 ,0 5 4 .5 3 ,5 1 5 .1 ± 3 ,4 0 1 .5 0 .5 5 6 9 1 .4 ± 1 0 5 .2 4 0 6 .1 ± 1 7 4 4 .9 1 0 6 .8 ± 8 7 .5 0 .0 2 4 11 7 .6 ± 3 7 4 .9 11 7 .4 ± 2 0 7 .8 1 3 7 .7 ± 4 2 7 .3 0 .8 1 0 1 7 .3 ± 9 .4 2 1 .5 ± 8 .8 0 .0 9 6 1 7 .2 ± 9 .9 1 9 .7 ± 9 .3 0 .0 0 8
T o ta l en er g y in ta k es (k ca l) C arb o h y d ra te (g ) P ro te in (g ) F at (g ) n -3 F A s (g ) n -6 F A s (g ) M U F A s (g ) P U F A s (g ) V it A (μ g R E ) C aro te n e (μ g ) R et in o l (μ g ) N ia ci n (m g ) C al ci u m (m g )
1 6 .8 ± 9 .4 5 2 1 .2 ± 2 9 5 .0 4 7 6 .6 ± 1 9 0 .6 5 2 2 .8 ± 2 11 .1 0 .6 8 1
1 7 .1 ± 9 .8 5 0 5 .8 ± 2 8 1 .2 4 8 1 .2 ± 2 4 5 .9 5 7 1 .3 ± 3 2 1 .4 0 .0 1 0 A ll es ti m at es w er e w ei g h te d an d ca lc u la te d ta k in g in to ac co u n t th e co m p le x st u d y d es ig n .
1)P -v al u e w er e o b ta in ed f o rm C h i- sq u ar e te st f o r ca te g o ri ca l v ar ia b le a n d f ro m g en er al l in ea r m o d el ( G L M ) fo r co n ti n u o u s v ar ia b le s. A p v al u e o f le ss t h an 0 .0 5 w as r eg ar d ed a s st at is ti ca ll y si g n if ic an t.
2)D at a ar e ex p re ss ed as th e n u m b er o f su b je ct s fo r ea ch ca te g o ry (% ) o r m ea n ± st an d ar d d ev ia ti o n . A b b re v ia ti o n : S B P , sy st o li c b lo o d p re ss u re ; D B P , d ia st o li c b lo o d p re ss u re ; G O T , g lu ta m ic o x al ac et ic tr an sa m in as e; G P T , g lu ta m ic p y ru v at e tr an sa m in as e; h s- C R P , h ig h se n si ti v it y C -r ea ct iv e p ro te in ; M U F A s, m o n o u n sa tu ra te d fa tt y ac id s; P U F A s, p o ly u n sa tu ra te d fa tt y ac id s.
Table 3. Odds ratio and 95% confidence interval of the metabolic syndrome risk factors according to coffee intake
in subjects (n=1,402)
Coffee intakes in prediabetes
n
Coffee intakes in normal
< 1 cup/day 1 ~2 cups ≥ 3 cups/day < 1 cup/days 1 ~2 cups ≥ 3 cups/day OR (95% CI)
5)Waist circumference (cm) (≥90 cm male, ≥80 cm female)
Model 1
1)1.0(ref) 1.197(0.366, 3.913) 1.264(0.457, 3.499) 1.0(ref) 0.615(0.374, 1.010) 0.726(0.465, 1.133) Model 2
2)1.0(ref) 1.171(0.347, 3.944) 1.233(0.438, 3.470) 1.0(ref) 0.605(0.366, 1.000) 0.714(0.459, 1.112) Model 3
3)1.0(ref) 1.226(0.403, 3.728) 1.600(0.561, 4.568) 1.0(ref) 0.658(0.401, 1.081) 0.827(0.536, 1.275) Model 4
4)1.0(ref) 0.891(0.138, 5.770) 1.585(0.479, 5.246) 1.0(ref) 0.634(0.291, 1.379) 0.889(0.449, 1.761) BP (mmHg) (≥85 mmHg DBP and ≥130 mmHg SBP)
Model 1 1.0(ref) 1.092(0.279, 4.278) 2.095(0.703, 6.242) 1.0(ref) 0.707(0.427, 1.172) 0.439(0.255, 0.755) Model 2 1.0(ref) 1.128(0.288, 4.421) 2.193(0.750, 6.411) 1.0(ref) 0.740(0.439, 1.247) 0.457(0.263, 0.794) Model 3 1.0(ref) 1.082(0.271, 4.318) 1.735(0.612, 4.920) 1.0(ref) 0.918(0.549, 1.536) 0.645(0.363, 1.144) Model 4 1.0(ref) 1.056(0.254, 4.394) 1.760(0.614, 5.046) 1.0(ref) 0.960(0.542, 1.701) 0.660(0.376, 1.158) Total cholesterol (mg/dL) (≥200 mg/dL)
Model 1 1.0(ref) 0.667(0.280, 1.588) 2.226(0.804, 6.165) 1.0(ref) 1.196(0.734, 1.947) 1.248(0.839, 1.859) Model 2 1.0(ref) 0.666(0.278, 1.595) 2.210(0.800, 6.107) 1.0(ref) 1.196(0.735, 1.947) 1.228(0.826, 1.824) Model 3 1.0(ref) 0.683(0.287, 1.627) 2.279(0.779, 6.668) 1.0(ref) 1.092(0.667, 1.788) 0.972(0.639, 1.477) Model 4 1.0(ref) 0.678(0.287, 1.600) 2.278(0.772, 6.721) 1.0(ref) 1.109(0.668, 1.840) 0.958(0.632, 1.450) HDL cholesterol (mg/dL) (<40 mg/dL male, <50 mg/dL female)
Model 1 1.0(ref) 1.285(0.664, 2.489) 1.145(0.751, 1.745) 1.0(ref) 2.879(0.831, 9.970) 1.909(0.715, 5.098) Model 2 1.0(ref) 1.286(0.660, 2.506) 1.172(0.764, 1.798) 1.0(ref) 2.828(0.809, 9.880) 1.834(0.680, 4.947) Model 3 1.0(ref) 1.158(0.589, 2.275) 0.899(0.563, 1.436) 1.0(ref) 2.934(0.800, 10.761) 2.207(0.748, 6.514) Model 4 1.0(ref) 1.201(0.617, 2.339) 0.882(0.552, 1.409) 1.0(ref) 2.925(0.815, 10.501) 2.220(0.766, 6.435) Triglyceride (mg/dL) (≥150 mg/dL)
Model 1 1.0(ref) 0.873(0.265, 2.877) 0.973(0.362, 2.613) 1.0(ref) 0.847(0.421, 1.708) 1.089(0.662, 1.790) Model 2 1.0(ref) 0.934(0.239, 3.653) 1.062(0.324, 3.486) 1.0(ref) 0.839(0.396, 1.779) 0.984(0.579, 1.671) Model 3 1.0(ref) 0.943(0.231, 3.850) 1.202(0.363, 3.981) 1.0(ref) 0.823(0.387, 1.749) 0.933(0.529, 1.645) Model 4 1.0(ref) 0.918(0.212, 3.969) 1.255(0.348, 4.531) 1.0(ref) 0.816(0.387, 1.717) 0.895(0.502, 1.597) LDL cholesterol (mg/dL) (≥100 mg/dL)
Model 1 1.0(ref) 0.644(0.178, 2.331) 1.471(0.496, 4.361) 1.0(ref) 1.389(0.804, 2.399) 0.956(0.630, 1.450) Model 2 1.0(ref) 0.615(0.169, 2.232) 1.416(0.460, 4.359) 1.0(ref) 1.399(0.812, 2.409) 0.902(0.604, 1.346) Model 3 1.0(ref) 0.617(0.167, 2.273) 1.482(0.480, 4.570) 1.0(ref) 1.329(0.771, 2.292) 0.795(0.520, 1.214) Model 4 1.0(ref) 0.608(0.165, 2.231) 1.487(0.480, 4.606) 1.0(ref) 1.378(0.783, 2.425) 0.791(0.515, 1.215)
1)
Model 1: unadjusted.
2)
Model 2: adjusted for sex.
3)
Model 3: adjusted for age and sex.
4)
Model 4: adjusted for age, sex and BMI
5)
OR, odds ratio; CI, confidence interval.
By multiple logistic regression analysis. A p value of less than 0.05 was regarded as statistically significant.
형 당뇨병(Bhupathiraju, Pan, & Malik, 2013), 심혈관질환(Ko- ning, Malik, Kellogg, Rimm, & Willett, 2012), 대사증후군 (Chan et al., 2014)을 야기한다고 밝혔다. Stanhope(2016)에 따르면 이는 설탕에 함유된 과당으로 인하여 간에서 대사되 는 VLDL의 혈중 농도가 증가되어 이상지질혈증과 심혈관 계질환, 전신의 인슐린 저항성을 유발시키는 것과 관련 있 다고 보고하였다. 본 연구의 전당뇨병 대상자의 혈중 TG 수 준은 ≥3 cups/day 군에서 228.2 mg/dL로 한국인의 이상지질 혈증 진단 기준(Committee for Guidelines for Management of Dyslipidemia, 2015) 에서 높음에 해당되는 200~499 mg/dL 수준이다. 선행 연구(Jun et al., 2010)에서 높은 TG 농도가 다른 위험인자와는 독립적으로 심혈관계질환의 위험과 연 관이 있다고 알려져 있으므로 혈중 TG와 혈중 지질 농도 조절을 위한 식생활 조절이 필요하다고 생각한다. 또한 이 수치는 혈당 정상군 대상자의 수준보다 대략 2배 높은 수치 이므로 식생활 조절을 위한 당뇨병 고위험 상태인 전당뇨병 대상자의 식사가이드라인 제시도 시급하다고 여겨진다. 한 국인 다빈도 식품인 커피 섭취와 대사질환인 심혈관계질환 의 발병 위험에 미치는 영향을 분석하기 위하여 일본의 40~
64세 여성 426명을 대상으로 10.3년 추적 연구한 결과(Sugi- yama et al., 2010) 에 따르면 커피를 섭취하지 않은 경우에 비해 0~1 cup/day인 경우 0.56배(95% CI, 0.36~0.86), 1~2 cups/day인 경우 0.48배(95% CI, 0.29~0.80), 3 cups/day 이상 인 경우 0.45배(95% CI, 0.20~1.03) 발병 위험이 감소한다고 하였다. 하지만 커피 섭취와 대사질환의 발병 위험 간 역의 연관성을 보여주는 이런 결과에도 불구하고 대사질환 진단 기준의 차이, 커피 섭취 빈도, 섭취 커피의 유형, 대상자의 건강 상태, 연구 조사 방법의 상이함으로 인하여 섭취와 질 병과의 일관성 있는 관련성을 설명하기에는 타당성이 부족 하다. 본 연구에서도 전당뇨병군 대상자의 커피 섭취와 질 병과의 유의적 차를 보이지 않아 인과 관련성을 규정지을 수 없었다. 국민건강영양조사에서 조사된 커피 1 cup의 기준 량은 10 mL(Korea Health Statistics [KHS], 2015)로 선행 연구 에서 조사하는 섭취 커피 양의 차이에 따라 대사적 지표의 결과가 달랐을 것으로 생각되며, 추후 대사 질환에 영향을 줄 수 있는 커피 섭취량의 분석을 위해 섭취 커피의 유형과 섭취 방법을 고려한 지속적인 연구가 필요하다고 생각된다.
혈당 정상군에서는 커피 섭취로 인하여 혈압 수준이 Mo- del 1군에서 0.439배, Model 2군에서 0.457배 유의적으로 감 소됨을 확인하였다. Ishizaka, Yamakado, Toda, Tani, & Ishi- zaka(2013) 에 따르면 커피가 hydroxycinnamates라고 불리는 페놀성 항산화 물질을 함유하여 대표적인 항산화 급원 식품 으로 알려져 있으며 이로 인하여 남성 대상자에서 1일 3 cups 이상 섭취 시 산화스트레스와 역의 상관성을 보여 혈압에 좋은 영향을 미친다고 하였으며, 다른 연구에서도 2~3컵에
200~250 mg의 카페인이 함유되어 있지만 이로 인하여 커 피 섭취가 혈압을 상승시킬 위험성이 있다고 단정하기 어려 우며 오히려 습관적인 커피 섭취가 혈압을 낮추는 효과를 보였다고 보고하였다(Higdon, & Frei, 2006). 따라서 연령, 성 별, 질병 유무에 따른 다양한 상황과 대상자를 고려하여 장 기간의 커피 섭취가 건강에 미치는 영향을 연구하는 것이 필요하다고 제언한다.
본 연구는 혈당 수준에 따라 혈당 정상군과 대사증후군과 제 2형 당뇨병의 고위험군인 전당뇨병 대상자의 식품 섭취 수준에 따른 대사증후군 위험인자 간의 관련성을 조사한 점 에 의의가 있지만, 사전 설계된 설문 조사에서 수행된 분석 의 횡단 연구로 몇 가지 한계점을 가진다. 우선 대사증후군 과 커피 섭취 간의 인관관계를 설명할 수 없으며, KHANES 의 커피 섭취 조사 단위가 cup으로 측정하였기 때문에 대상 자의 섭취 커피의 정확한 분량을 평가하기 어렵다는 제한점 이 있다. 또한 본 연구는 전당뇨병 대상자와 혈당 정상 대상 군의 자료를 분석한 연구 결과이므로 다수의 대상자들에게 일반화 할 수 없다. 이런 제한점에도 불구하고 본 연구는 분 석 과정에서 정확한 식사섭취조사를 위해 영향을 미칠 수 있는 약물 복용자 및 다른 대사적 질환을 가진 대상자를 제 외하였고, 식사섭취와 질병 간 연구 결과에 발생할 수 있는 편향을 줄이기 위하여 선행연구(Montonen et al., 2005)에서 분석한 자료를 토대로 연령, 성별, BMI를 혼동인자(con- founding factor)로 하여 보정(adjusted)을 실시하여 분석을 수 행하였다. 본 연구는 국민통계자료를 분석하여 신뢰성과 대 표성을 가지며 커피 섭취와 대사질환의 발병 위험 요인과의 관련성을 규명한 기초 자료로 활용될 수 있으며 추후 혈관 의 지질 농도를 조절해야 하는 대상자를 위한 식사가이드라 인 제시를 위하여 정확한 연구 설계를 바탕으로 당류 함유 량에 따른 섭취 커피 유형을 세분화하여 대사적 지표와의 연관성을 분석하기 위한 지속적인 연구 수행이 필요하다고 제언한다.
REFERENCES