391
Open Access
Dual Pulsed-Wave Doppler Tracing of Right Ventricular Inflow and Outflow:
Single Cardiac Cycle Right Ventricular Tei Index and Evaluation of Right Ventricular Function
Jin-Oh Choi, MD
1, Joon Hyouk Choi, MD
1, Hyun Jong Lee, MD
1, Hye Jin Noh, MD
1, June Huh, MD
2,
I Seok Kang, MD
2, Heung Jae Lee, MD
2, Sang-Chol Lee, MD
1, Duk Kyung Kim, MD
1and Seung Woo Park, MD
11
Departments of Medicine and
2Pediatrics, Samsung Medical Center, Sungkyunkwan University School of Medicine, Seoul, Korea
ABSTRACT
Background and Objectives: The reliability and usefulness of the right ventricular (RV) Tei index (RTX) remains contro- versial because it has not been possible to simultaneously measure RV inflow and outflow. However, dual pulsed-wave Dop- pler (DPD) enables flow velocities to be obtained at different sampling sites simultaneously. In this study we evaluated the fea- sibility and reliability of RTX values obtained by DPD (RTX
DPD). Subjects and Methods: Forty-one patients who underwent cardiac catheterization and echocardiography for RV volume or pressure overloading conditions were evaluated. Symptom- limited exercise treadmill testing with expired gas analysis was performed and maximal exercise capacity was measured. Re- sults: RTX by conventional flow Doppler (RTX
CFD, 0.262±0.164) was similar to RTX
DPD(0.253±0.117, p=NS), whereas RTX by tissue Doppler echocardiography (RTX
TDE, 0.447±0.125) was significantly larger than RTX
DPD(p<0.001). Based on multi- ple regression analysis, maximal exercise capacity was independently related to RTX
DPD(β=-0.60, p<0.001), mid-RV dimension (β=-0.26, p=0.012), left ventricular ejection fraction (β=0.22, p=0.023), and early diastolic tricuspid annular velocity (β=0.21, p=0.048). Conclusion: It is feasible and reliable to evaluate RV function using RTX
DPDvalues. However, to evaluate the clinical usefulness of RTX
DPD, additional studies are required with a large number of patients and long-term follow-up. (Korean Circ J 2010;40:391-398)
KEY WORDS: Echocardiography; Echocardiography, Doppler, pulsed; Cardiac function; Right ventricle.
Received: December 28, 2009 Revision Received: February 19, 2010 Accepted: March 10, 2010
Correspondence: Seung Woo Park, MD, Department of Medicine, Sam- sung Medical Center, Sungkyunkwan University School of Medicine, 50 Irwon-dong, Gangnam-gu, Seoul 135-710, Korea
Tel: 82-2-3410-3419, Fax: 82-2-3410-3849 E-mail: [email protected]
cc
This is an Open Access article distributed under the terms of the Cre- ative Commons Attribution Non-Commercial License (http://creativecom- mons.org/licenses/by-nc/3.0) which permits unrestricted non-commer- cial use, distribution, and reproduction in any medium, provided the ori- ginal work is properly cited.
Introduction
The Tei index (also known as the myocardial performance index), has been reported to reflect both systolic and dia- stolic ventricular function.
1-5)However, there are some con- cerns about the reliability of the Tei index since it cannot be calculated in a single cardiac cycle, particularly for the right
ventricle (RV).
6)7)Moreover, this shortcoming has seriously limited the application of the RV Tei index (RTX) in the pres- ence of substantial heart rate fluctuations. Efforts have been made to overcome this limitation by using tissue Doppler echo- cardiography (TDE) to determine Tei indices,
7)8)but the values measured by conventional flow Doppler (CFD) and TDE dif- fer slightly.
9)Recently, dual pulsed-wave Doppler (DPD) echo- cardiography was introduced, which allows flow velocities at different points to be measured using two independent sam- ple volumes.
Using this technique, one can measure the parameters re- quired to calculate RTX values in a single cardiac cycle (RTX-
DPD
), which might overcome the limitations of CFD. Accord- ingly, we evaluated the feasibility and reliability of RTX
DPDversus RTX by CFD (RTX
CFD) and TDE (RTX
TDE). In addi- tion, we also investigated the clinical usefulness of RTX
DPDby correlation analysis using invasively-measured RV pressures
and exercise capacity.
Subjects and Methods
Study subjects
This study was approved by the Ethical Review Board of Samsung Medical Center in Seoul, Korea. Forty-one patients who underwent both right cardiac catheterization and echo- cardiography for RV volume or pressure overloading condi- tions, or for congenital heart diseases with cardiac shunts were evaluated. The study patients also underwent treadmill exer- cise testing with expired gas analysis. Patients meeting any of the following criteria were excluded: atrial fibrillation or he- modynamic instability, age <10 years, echocardiographic win- dows too poor for analysis purposes, and unwillingness to participate in the study. Fifteen healthy persons were also eval- uated as the normal healthy control group for comparison of echocardiographic parameters, including RTX values.
Echocardiographic examinations
Comprehensive conventional two-dimensional (2-D) echo- cardiographic examinations were performed with an Accuvix
XQ
®cardiovascular ultrasound system (Medison, Seoul, Ko- rea). The ultrasound examinations included measurements of the mid- and basal-transverse RV diameters, and the lon- gitudinal diameter in an apical 4-chamber view, according to the recommendations of the American Society of Echocar- diography.
10)Left atrial volumes were calculated using the ellipsoidal method and indexed with respect to body surface area.
11)The peak early diastolic mitral inflow velocity (E) and mitral annular velocity (E’
MV) were measured in the apical 4-chamber view and the E/E’
MVratio was calculated.
Annular velocities of the tricuspid valve (TV) were obtained in the apical 4-chamber views. The tricuspid annular velocities included the peak systolic TV annular velocity (S’
TV), peak early diastolic velocity (E’
TV), and late peak diastolic velocity (A’
TV).
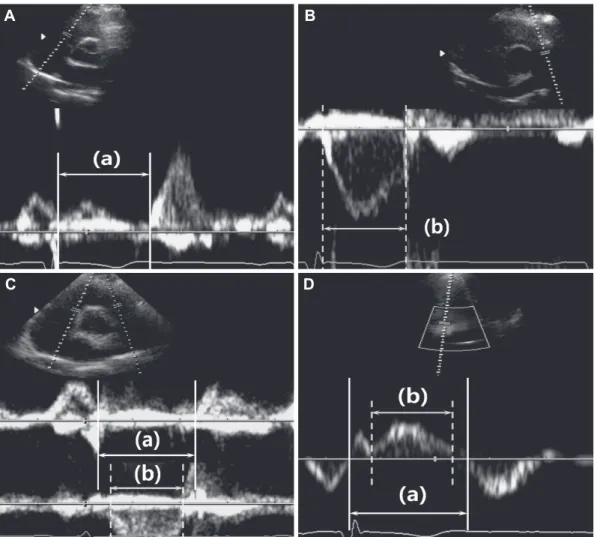
12)Tricuspid inflows and pulmonary ejection flows were measured in the parasternal short axis view and used to deter- mine the RTX
CFDand RTX
DPDvalues (Fig. 1A, B and C). The RTX was defined as the sum of the isovolumic contraction time (ICT) and relaxation time (IRT) divided by the pulmo- nary ejection time (PET), as follows: RTX=(ICT+IRT)/PET. To A
D B
C
Fig. 1. Measurement of right ventricular Tei index (RTX) by (A and B) the conventional flow Doppler method (RTX
CFD), (C) the dual pulsed-
wave Doppler method (RTX
DPD), and by (D) tissue Doppler echocardiography (RTX
TDE). RTX was defined as [(a)-(b)]/(b), where (a) is the
time from tricuspid valve inflow cessation to onset for RTX
CFDand RTX
DPDand time from the end of A’
TVto the onset of E’
TVfor RTX
TDE, and
(b) is the pulmonary ejection time for RTX
CFDand RTX
DPDor the duration of S’
TVfor RTX
TDE. A’
TV: late diastolic tricuspid annular velocity, E’
TV:
early diastolic tricuspid annular velocity, S’
TV: systolic tricuspid annular velocity.
derive the sum of the ICT and IRT, the PET was subtracted from the time between the cessation to onset of tricuspid valve inflow.
7)To calculate the RTX
TDE, the sum of the ICT and IRT was de- rived by subtracting the S’
TVduration from the time interval between the end of the A’
TVand the onset of the E’
TV(Fig. 1D).
Each of these parameters was measured using three consec- utive beats and then averaged.
Right cardiac catheterization and cardiopulmonary exercise testing
Right cardiac catheterization was performed using a bal- loon-tipped pulmonary artery catheter in all patients. The RV systolic pressure (RVSP) was measured for three consec- utive beats and then averaged. The study subjects were group- ed according to the RVSP values using a cutoff value of 40 mmHg as follows: group A with a high RVSP (≥40 mmHg, n=
18) and group B with a normal RVSP (<40 mmHg, n=23).
A symptom-limited exercise treadmill test with expired gas analysis was performed in all 41 study subjects. The peak O
2consumption rate (VO
2max) was measured at peak exer- cise. The VO
2max was indexed versus body weight and peak exercise capacity {metabolic equivalents (METs)} was calculat-
ed by dividing the measured VO
2max values by 3.5 mL/kg/min.
Statistical analysis
Statistical analysis was performed using SPSS 17.0 (SPSS In- teractive Graphics, version 17.0; SPSS, Inc., Chicago, IL, USA).
P<0.05 were considered statistically significant. Data are pre- sented as the means±SD or as frequencies. Continuous vari- ables were compared via one-way analysis of variance with post-hoc test using Bonferroni’s correction method, and cat- egorical data was analyzed using a Chi-squared or Fisher’s exact test. Comparison between the mean values of the RTX measured using different methods was done with a paired t- test. The 2-tailed Pearson method was used to evaluate corre- lations between the RTX and other echocardiographic pa- rameters.
In addition, stepwise multiple linear regression models were developed to predict exercise capacity. To investigate intra- and inter-personal measurement variability, measure- ments were performed off-line by two investigators on 20 randomly selected cases. The intraclass correlation coefficient of the RTX
DPDfor intra- and inter-observer measurements was 0.93 (n=20; p<0.001; 95% CI, 0.84-0.97) and 0.83 (n=20;
p<0.001; 95% CI, 0.62-0.93).
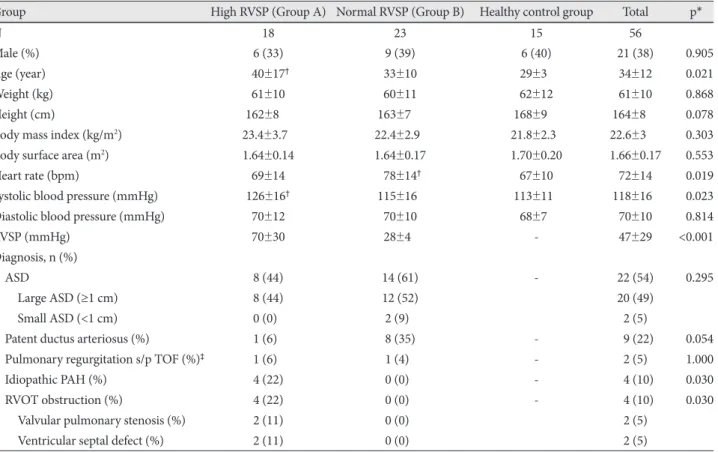
Table 1. Baseline clinical data of study patients according to the right ventricular systolic pressure
Group High RVSP (Group A) Normal RVSP (Group B) Healthy control group Total p*
N 18 23 15 56
Male (%) 6 (33) 9 (39) 6 (40) 21 (38) 0.905
Age (year) 40±17
†33±10 29±3 34±12 0.021
Weight (kg) 61±10 60±11 62±12 61±10 0.868
Height (cm) 162±8 163±7 168±9 164±8 0.078
Body mass index (kg/m
2) 23.4±3.7 22.4±2.9 21.8±2.3 22.6±3 0.303
Body surface area (m
2) 1.64±0.14 1.64±0.17 1.70±0.20 1.66±0.17 0.553
Heart rate (bpm) 69±14 78±14
†67±10 72±14 0.019
Systolic blood pressure (mmHg) 126±16
†115±16 113±11 118±16 0.023
Diastolic blood pressure (mmHg) 70±12 70±10 68±7 70±10 0.814
RVSP (mmHg) 70±30 28±4 - 47±29 <0.001
Diagnosis, n (%)
ASD 8 (44) 14 (61) - 22 (54) 0.295
Large ASD (≥1 cm) 8 (44) 12 (52) 20 (49)
Small ASD (<1 cm) 0 (0)0 2 (9)0 02 (5)0
Patent ductus arteriosus (%) 1 (6)0 8 (35) - 09 (22) 0.054
Pulmonary regurgitation s/p TOF (%)
‡1 (6)0 1 (4)0 - 02 (5)0 1.000
Idiopathic PAH (%) 4 (22) 0 (0)0 - 04 (10) 0.030
RVOT obstruction (%) 4 (22) 0 (0)0 - 04 (10) 0.030
Valvular pulmonary stenosis (%) 2 (11) 0 (0)0 02 (5)0
Ventricular septal defect (%) 2 (11) 0 (0)0 02 (5)0
Data are presented as the means±SD or as numbers (%). *p were calculated using an independent t-test or Chi-squared test between groups
A and B. Fisher,s exact tests were used when applicable. One-way analysis of variance with post-hoc analysis using the Bonferroni correction
method was also used for comparison of the parameters between three groups,
†p<0.05 compared with the healthy control group in post-hoc
analysis,
‡Patients that developed chronic pulmonary regurgitation after surgical treatment of tetralogy of Fallot (TOF). RVSP: right ventricu-
lar systolic pressure, ASD: atrial septal defect, PAH: pulmonary arterial hypertension, RVOT: right ventricular outflow tract
Results
Baseline characteristics of the study population The baseline clinical characteristics and the diagnoses of the study subjects are shown in Table 1. The mean age of the 56 enrolled subjects was 34±12 years, and 21 subjects (38%) were males. In group A (i.e., a RVSP ≥40 mmHg), the mean RVSP was 70±30 mmHg, which was significantly greater than group B (28±4 mmHg, p<0.001). No significant differences in baseline characteristics were observed between these two groups, except for a slightly higher heart rate and lower sys- tolic blood pressure in group B (p=0.073 and p=0.065, respec- tively). The clinical diagnoses in group B were mainly atrial septal defects (n=14, 61%) or patent ductus arteriosus (n=8, 35%). However, patients with idiopathic pulmonary arterial hypertension (n=4, 22%) as well as RV outflow tract obstruc- tion (n=4, 22%) were also included in group A.
Echocardiographic data and cardiopulmonary func- tion testing
Echocardiographic data are presented by patient group in Table 2. No significant differences were observed between gr-
oups A and B in terms of cardiac chamber size or ejection fr- action, although the mid-RV dimension measured in the api- cal 4-chamber view was significantly larger in group A (44±
11 mm vs. 37±8 mm, p=0.028). In contrast, the S’
TVand E’
TVwere significantly lower in group A (11.2±2.9 cm/sec and 10.1±3.9 cm/sec vs. 14.8±3.9 cm/sec, and 14.6±4.5 cm/sec, p=0.003 and p=0.001, respectively), whereas the RTX
CFDand RTX
DPDwere significantly higher in group A (0.353±0.202 vs. 0.192±0.076, p<0.001, and 0.326±0.139 vs. 0.196±0.047, p<0.001). However, the RTX
TDEvalues were not significantly different (p=0.160). Moreover, patients in group A had a short- er duration of exercise and a lower maximal exercise capaci- ty (7.1±3.2 minutes vs. 10.2±1.4 minutes, p<0.001, and 6.3±2.4 METS vs. 9.6±1.7 METS, p<0.001, respectively).
Correlation analysis between the right ventricular Tei index and other parameters
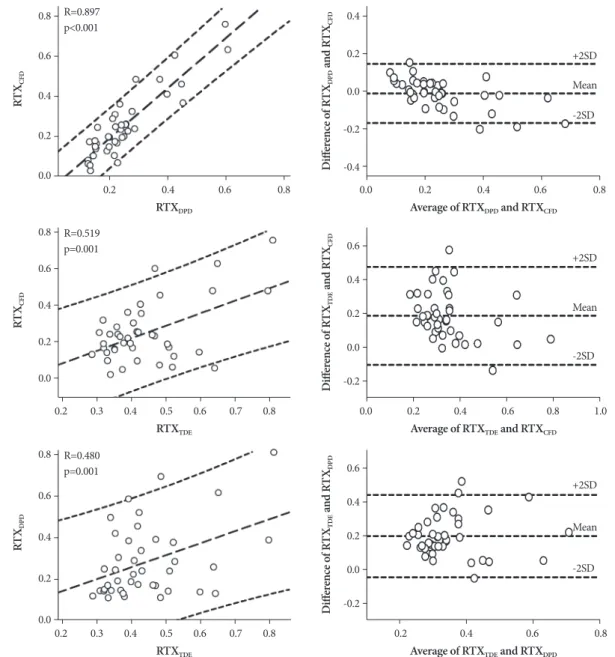
The mean RTX
CFD(0.262±0.164) was similar to the mean RTX
DPD(0.253±0.117, p=0.440), whereas the mean RTX
TDE(0.447±0.125) was significantly higher than the mean RTX
DPD(p<0.001) by paired t-tests. The RTX
CFDand RTX
DPDvalues agreed and correlated well with each other by Pearson’s cor- Table 2. Echocardiography and cardiopulmonary function test results
Group High RVSP (Group A) Normal RVSP (Group B) Healthy control group Total p*
N 18 23 15 56
LV end-diastolic dimension (mm) 043.6±9.3 047.2±8.5 047.1±4.1 046.0±7.9 0.302
LV end-systolic dimension (mm) 028.3±8.3 029.1±5.9 027.0±3.1 028.3±6.2 0.593
LV ejection fraction (%) 00.58±10
†00.62±7 00.67±3 00.62±8 0.004
Left atrial volume index (mL/m
2) 023.9±11.6 020.6±5.1 018.3±3.0 021.1±7.7 0.110
Mitral E velocity (m/sec) 00.68±0.24
†00.79±0.20 00.89±0.16 00.78±0.21 0.021
E’
MV(cm/sec) 011.7±4.6
†‡016.8±4.5 017.3±2.0 015.3±4.7 <0.001
E/E’
MV006.2±2.2
‡004.9±1.5 005.2±1.1 005.4±1.7 0.049
Right atrial size (mm) 00.49±13
†00.43±8
†00.34±2 00.43±11 <0.001
RV long-axis dimension (mm) 00.84±14
†00.80±9 00.71±8 00.79±11 0.003
Mid RV dimension (mm) 00.44±11
†‡00.37±8 00.31±4 00.37±10 <0.001
Basal RV dimension (mm) 00.38±10
†00.34±6
†00.28±3 00.34±8 0.001
S’
TV(cm/sec) 011.2±2.9
†‡014.8±3.9 015.1±2.5 013.7±3.7 0.001
E’
TV(cm/sec) 010.1±3.0
†‡014.6±4.5
†018.3±3.4 014.1±4.9 <0.001
A’
TV(cm/sec) 013.6±5.9 013.9±4.9 010.5±2.6 012.9±4.9 0.082
RTX by CFD 0.353±0.202
†‡0.192±0.076 0.132±0.071 0.227±0.156 <0.001
RTX by TDE 0.486±0.154
†0.416±0.088 0.389±0.084 0.431±0.117 0.040
RTX by DPD 0.326±0.139
†‡0.196±0.047 0.157±0.068 0.227±0.114 <0.001
Exercise duration (min) 007.1±3.2 010.2±1.4 - 008.8±2.8 <0.001
VO
2max (mL/min) 00.22±8.3 033.7±6 - 028.5±9.2 <0.001
Exercise capacity (METS) 006.3±2.4 009.6±1.7 - 008.2±2.6 <0.001
Data are presented as the means±SD or as numbers (%). *p calculated using the independent t-test or one-way analysis of variance with post- hoc analysis by the Bonferroni correction method,
†p<0.05 compared with the healthy control group,
‡p<0.05 compared with group B. RVSP:
right ventricular systolic pressure, LV: left ventricle, E: early diastolic mitral inflow velocity, E’
MV: early diastolic mitral annular velocity, E/E’
MV: E to E’
MVratio, RV: right ventricle, S’
TV: peak systolic tricuspid annular velocity, E’
TV: peak early diastolic tricuspid annular velocity, A’
TV: peak late diastolic tricuspid annular velocity, RTX: RV Tei index, CFD: conventional flow Doppler, TDE: tissue Doppler echocardiography, DPD:
dual pulsed-wave Doppler, VO
2max: peak oxygen consumption rate, METS: metabolic equivalents
relation analysis (r=0.90, p<0.001) and Altman and Bland curve analysis (Fig. 2). However, there was only a weak rela- tionship between the RTX
TDEand RTX
DPD(r=0.48, p=0.001).
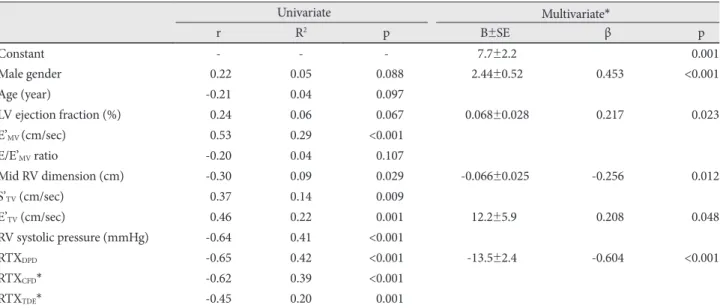
While the RTX
CFDand RTX
DPDcorrelated moderately with the S’
TV(r=0.57, p=0.001 and r=0.59, p=0.001), there was no correlation between the RTX
TDEand S’
TV(Fig. 3). Moreover, the RTX
CFDand RTX
DPDcorrelated well with maximal exer- cise capacity (r=0.62, p<0.001 and r=0.65, p<0.001), whereas the RTX
TDEwas only correlated weakly (r=0.45, p=0.004) (Fig. 3).
Multiple linear regression analysis and prediction of maximal exercise capacity
Multiple stepwise linear regression analyses were performed to identify those parameters that independently predicted
maximal exercise capacity (Table 3). The mid-RV dimension, S’
TV, E’
TV, RVSP, and RTX
DPDwere related to maximal exer- cise capacity by simple linear regression analysis, and subse- quent multiple linear regression analysis showed that male gender (β=0.45, p<0.001), LV ejection fraction (β=0.22, p=
0.023), E’
TV(β=0.30, p=0.003), mid-RV dimension (β=-0.26, p=0.012), and RTX
DPD(β=-0.60, p<0.001) were independent- ly related to maximal exercise capacity (adjusted R
2=0.67).
Based on a multiple regression model, including the RTX
CFDand other independent variables, the RTX
CFDwas also inde- pendently related to maximal exercise capacity (β=-0.56, p<
0.001, adjusted R
2=0.64). However, based on multiple regres- sion analysis including the RTX
TDEas an independent vari- able, the RTX
TDEwas independently related to the exercise ca- pacity, but the relationship was not as strong (β=-0.31, p=
Fig. 2. Correlation (left column) and Altman-Bland plots (right column) between right ventricular Tei indexes (RTX) using conventional flow Doppler (CFD) and dual pulsed-wave Doppler (DPD; upper row); RTX using CFD and tissue Doppler (TDE; mid-row); and RTX using the DPD and TDE methods.
0.8
0.6
0.4
0.2
0.0
0.8
0.6
0.4
0.2
0.0
0.8
0.6
0.4
0.2
0.0
0.4
0.2
0.0
-0.2
-0.4
0.6
0.4
0.2
0.0
-0.2
0.6
0.4
0.2
0.0
-0.2 RTX
DPDRTX
TDERTX
TDEAverage of RTX
DPDand RTX
CFDAverage of RTX
TDEand RTX
CFDAverage of RTX
TDEand RTX
DPDRT X
CFDRT X
CFDRT X
DPDD iff er en ce o f R TX
DPDan d RT X
CFDD iff er en ce o f R TX
TDEan d RT X
CFDD iff er en ce o f R TX
TDEan d RT X
DPD0.2 0.4 0.6 0.8
0.2 0.3 0.4 0.5 0.6 0.7 0.8
0.2 0.3 0.4 0.5 0.6 0.7 0.8
0.0 0.2 0.4 0.6 0.8 +2SD
+2SD
+2SD Mean
Mean
Mean -2SD
-2SD
-2SD 0.0 0.2 0.4 0.6 0.8 1.0
0.2 0.4 0.6 0.8 R=0.897
p<0.001
R=0.519 p=0.001
R=0.480
p=0.001
Fig. 3. Correlation plots of the right ventricular Tei index (RTX) vs. the S’
TV(upper row), E’
TV(mid-row), and maximal exercise capacity (lower row). Horizontal axes in the leftmost column represent RTX values determined using conventional flow Doppler (RTX
CFD); the middle column represents RTX values determined using tissue Doppler echocardiography (RTX
TDE); and the right column RTX values determined using the dual pulsed-wave Doppler method (RTX
DPD). S’
TV: systolic tricuspid annular velocity, E’
TV: early diastolic tricuspid annular velocity.
0.25 0.20 0.15 0.10 0.05 0.00
0.25 0.20 0.15 0.10 0.05 0.00
60 50 40 30 20 10 0
60 50 40 30 20 10 0
60 50 40 30 20 10 0 0.25
0.20 0.15 0.10 0.05 0.00
0.25 0.20 0.15 0.10 0.05 0.00
0.25 0.20 0.15 0.10 0.05 0.00
0.25 0.20 0.15 0.10 0.05 0.00 RTX
CFDRTX
CFDRTX
CFDRTX
TDERTX
DPDRTX
TDERTX
TDERTX
DPDRTX
DPDS’
TV(m /se c) E’
TV(m /se c) V
O2m ax (m L/ m in ) V
O2m ax (m L/ m in ) V
O2m ax (m L/ m in )
S’
TV(m /se c) E’
TV(m /se c) S’
TV(m /se c) E’
TV(m /se c)
0.2 0.4 0.6 0.8 1.0
0.2 0.4 0.6 0.8 1.0
0.0 0.2 0.4 0.6 0.8 0.2 0.3 0.4 0.5 0.6 0.7 0.8 0.2 0.4 0.6 0.8 0.2 0.4 0.6 0.8 1.0
0.2 0.4 0.6 0.8 1.0
0.1 0.2 0.3 0.4 0.5 0.6 0.7
0.1 0.2 0.3 0.4 0.5 0.6 0.7 r=-0.574
p<0.001
r=-0.438 p=0.004
r=-0.626
p<0.001 r=-0.445
p=0.004 r=-0.650
p<0.001 r=-0.091
p=0.573
r=-0.324 p=0.039
r=-0.594 p<0.001
r=-0.451 p=0.003
Table 3. Multiple linear regression analysis and the prediction of maximal exercise capacity (METS)
Univariate Multivariate*
r R
2p B±SE β p
Constant - - - 7.7±2.2 0.001
Male gender -0.22 0.05 <0.088 2.44±0.52 -0.453 <0.001
Age (year) -0.21 0.04 <0.097
LV ejection fraction (%) -0.24 0.06 <0.067 0.068±0.028 -0.217 0.023
E’
MV(cm/sec) -0.53 0.29 <0.001
E/E’
MVratio -0.20 0.04 <0.107
Mid RV dimension (cm) -0.30 0.09 <0.029 -0.066±0.025 -0.256 0.012
S’
TV(cm/sec) -0.37 0.14 <0.009
E’
TV(cm/sec) -0.46 0.22 <0.001 12.2±5.9 -0.208 0.048
RV systolic pressure (mmHg) -0.64 0.41 <0.001
RTX
DPD-0.65 0.42 <0.001 -13.5±2.4 -0.604 <0.001
RTX
CFD* -0.62 0.39 <0.001
RTX
TDE* -0.45 0.20 <0.001
N=41, dependent variable as METS. R
2=0.79, Adjusted R
2=0.75, standard error of the estimate=1.32. The backward stepwise approach was
used to select best model fits to predict the METS. *RTX
CFDand RTX
TDEwere excluded for the multiple regression model in this table (see
text for details). LV: left ventricle, E’
MV: early diastolic mitral annular velocity, E/E’
MV: E to E’
MVratio, RV: right ventricle, S’
TV: systolic tricuspid
annular velocity, E’
TV: early diastolic tricuspid annular velocity, RTX: RV Tei index, DPD: dual pulsed-wave Doppler, CFD: conventional flow
Doppler, TDE: tissue Doppler echocardiography
0.025, adjusted R
2=0.45).
Discussion
The primary findings of this study were that the RTX
DPDis correlated well with the RTX
CFD, but not with the RTX
TDE, in patients with a RV volume or pressure overloading condition, and the RTX
DPDcan be reliably measured during single car- diac cycles. Furthermore, the RTX
DPDwas an independent predictor of exercise capacity by multiple regression analysis.
RTX
CFDdeterminations assume that each cardiac cycle has the same cardiac length, and thus these determinations are limited in patients with significant beat-to-beat variability or atrial fibrillation. Using the DPD method, we were able to obtain a flow signal at two independent sites simultaneously, and this method allowed precise determinations of ICT, IVT, and ET during single cardiac cycles. Thus, this method over- comes the limitation of the RTX
CFD. In a previous study, the RTX
TDEwas shown to be reliable for evaluating RV function in pediatric patients.
7)However, in the present study, the RTX-
DPD
did not concur with the RTX
TDE, although excellent con- cordance existed between the RTX
DPDand RTX
CFD. In a recent study performed in children, slight differences were found between the RTX
TDEand RTX
CFD, especially in larger and old- er children.
9)Because the patients enrolled in this study were
>10 years of age, our results support the opinion that the RTX
TDE