© 2017 The Korean Ophthalmological Society
This is an Open Access article distributed under the terms of the Creative Commons Attribution Non-Commercial License (http://creativecommons.org/licenses /by-nc/3.0/) which permits unrestricted non-commercial use, distribution, and reproduction in any medium, provided the original work is properly cited.
Original Article
Initial Pattern of Optic Nerve Enhancement in Korean Patients with Unilateral Optic Neuritis
Dae Yong Son1, Kyung-Ah Park1, Su Sie Seok2, Ju-Yeun Lee1, Sei Yeul Oh1
1Department of Ophthalmology, Samsung Medical Center, Sungkyunkwan University School of Medicine, Seoul, Korea
2Center for Clinical Specialty, Department of Ophthalmology, National Cancer Center, Goyang, Korea
Purpose: The purpose of this study was to demonstrate whether the pattern of optic nerve enhancement in magnetic resonance imaging (MRI) can help to differentiate between idiopathic optic neuritis (ON), neuromyeli- tis optica (NMO), and multiple sclerosis (MS) in unilateral ON.
Methods: An MRI of the brain and orbits was obtained in patients with acute unilateral ON. Patients with ON were divided into three groups: NMO, MS, and idiopathic ON. The length and location of the abnormal optic nerve enhancement were compared for ON eyes with and without NMO or MS. The correlation between the pattern of optic nerve enhancement and the outcome of visual function was analyzed.
Results: Of the 36 patients with ON who underwent an MRI within 2 weeks of the onset, 19 were diagnosed with idiopathic ON, 9 with NMO, and 8 with MS. Enhancement of the optic nerve occurred in 21 pa tients (58.3%) and was limited to the orbital segment in 12 patients. Neither the length nor the location of the optic nerve en- hancement was significantly correlated with visual functions other than contrast sensitivity or the diagnosis of idiopathic ON, MS, or NMO. Patients with greater extent of optic nerve sheath enhancement and more poste- rior segment involvement showed higher contrast sensitivity.
Conclusions: Our data revealed that the pattern of optic nerve enhancement was not associated with diagno- sis of idiopathic ON, NMO, or MS in Korean patients with unilateral ON. We believe further studies that include different ethnic groups will lead to a more definitive answer on this subject.
Key Words: Magnetic resonance imaging, Multiple sclerosis, Neuromyelitis optica, Optic nerve, Optic neuritis
Optic neuritis (ON), one of the most common optic neu- ropathies in adults [1], is a common manifestation in multi- ple sclerosis (MS) or neuromyelitis optica (NMO) and can also present in isolation. NMO is considered to pathogenet- ically differ from MS or idiopathic ON. In NMO, necrosis
and cavitation affect the gray and white matter in the spi- nal cord and optic nerve lesions with extensive macro- phage infiltration associated with large numbers of peri- vascular granulocytes, eosinophils, and rare T cells [2,3].
Prominent vascular fibrosis and hyalinization are found in both active and inactive lesions [2-6]. Compared to NMO, inflammatory demyelination is regarded as a pathologic hallmark of disease in MS. Axons are relatively preserved in MS compared to NMO. The treatment and prognosis of MS and NMO also differ somewhat. For instance, interfer- on beta–the most commonly used therapy for MS–is ac-
Received: July 3, 2016 Accepted: August 10, 2016
Corresponding Author: Sei Yeul Oh, MD. Department of Ophthalmolo- gy, Samsung Medical Center, #81 Irwon-ro, Gangnam-gu, Seoul 06351, Korea. Tel: 82-2-3410-3566, Fax: 82-2-3410-0074, E-mail: syoh@skku.
edu
knowledged to be generally harmful to patients with NMO [7-10]. Reports have also suggested that natalizumab, which is also used for treating MS, could be harmful in some patients with NMO [11,12].
Despite pathogenic differences, discriminating among idiopathic ON, MS, and NMO is often challenging because of the similarities in clinical manifestations, especially when a unilateral ON is the only neurologic symptom. Ef- forts have been made to differentiate these conditions us- ing NMO-immunoglobulin G (IgG) testing, magnetic res- onance imaging (MRI), and spinal fluid analysis. The sensitivity and specificity of NMO-IgG are high, reported- ly 76% and 94%, respectively [13]. However, false nega- tives still occur at a rate of about 6% to 24%, and NMO- IgG testing is not routinely used for ON in the absence of suspicion for NMO. An MRI of the brain is generally rec- ommended for every patient with ON for prognostic pur- poses of MS. Contrast enhancement of the optic nerve is a sensitive finding in acute ON, reported in up to 94% of cases [14]. There has been speculation as to whether there are certain features on the optic nerve in an MRI image in patients with acute ON that suggest NMO rather than MS [15]. The studies carried out to assist in this distinction re- ported a higher propensity of NMO-related ON affecting the more posterior parts of the optic nerve, including the optic chiasm [16,17]. The study participants included eight African Americans and nine Caucasians, and the time pe- riod of the MRI varied up to 6 weeks from the onset of ON. Considering the striking differences in the character- istics of ON between races and the acuteness of the pro- cess, we believed it was necessary to carry out an analysis of different ethnic groups with MRI performed in the acute stage and with a large sample size. In this current study, we analyzed the patterns of optic nerve enhance- ment in Korean patients with ON and determined if it could help to discriminate among idiopathic ON, NMO, and MS. Bilaterality itself is a strong clue for diagnosis of NMO and is one of the diagnostic criteria for NMO. Am- biguity in diagnosis of NMO mostly occurs because of the approach to unilateral idiopathic ON. We only included patients with unilateral ON as a presenting symptom in this study because we wanted to determine whether the pattern of optic nerve enhancement could help to differen- tiate among idiopathic ON, NMO, and MS in unilateral ON.
Materials and Methods
This comparative, observational, case series study was performed at a single center according to the tenets of the Declaration of Helsinki. The study was approved by the institutional review board of Samsung Medical Center, and written informed consent was obtained from all patients prior to enrollment. All enrolled patients had a clinical epi- sode of unilateral ON at presentation, including visual loss and dyschromatopsia. Orbit and brain MRI within 2 weeks after the symptom onset of ON; other blood tests, such as NMO IgG, erythrocyte sedimentation rate, C-reactive pro- tein, angiotensin-converting enzyme, antinuclear antibod- ies, and rapid plasma reagin test; serologic tests for toxoca- riasis, cat scratch disease, and Lyme disease; and a genetic test of Leber hereditary optic neuropathy were performed.
Patients with idiopathic demyelinating ON were enrolled.
Patients were recruited from the Neuro-ophthalmology de- partment over a 3-year period, from March 2009 to April 2012. The diagnosis of an ON episode was based on docu- mented findings of decreased visual acuity, visual field de- fect, color vision loss, relative afferent pupil defect, pain with eye movements, and a compatible fundus examina- tion. Patients with any of the following conditions were ex- cluded: age less than 20 years, previous ON episode within 6 months, refractive error greater than –6.0 diopters or +3.0 diopters (spherical equivalent), and any other ocular pathology that could affect visual functions and optical co- herence tomography (OCT) measurements including glau- coma or retinal disease. NMO was diagnosed based on the NMO diagnostic guideline suggested by Wingerchuk et al.
[13] MS was diagnosed based on the McDonald criteria [18].
All patients underwent a full ophthalmologic assessment including a visual acuity test, color vision test, slit lamp biomicroscopy, and fundus examination. Before vision testing, all subjects underwent a detailed refraction analy- sis. Corrected visual acuities were transformed to the loga- rithmic scale (logarithm of the minimal angle of resolution [logMAR]) for statistical analysis. Color vision was tested with Ishihara charts. The score was recorded as the frac- tion of the number of correctly identified tables over the total number of tables (e.g., 9 / 14).
Contrast sensitivity was measured with Vistech sine wave gratings (Vistech Consultants, Dayton, OH, USA) using the manufacturer’s recommended testing procedure.
Measurements were performed monocularly with the opti- mal refractive correction, natural pupil size, a chart lumi- nance of 120 cd/m2, and a working distance of 3 m. The farthest plate on each row that was correctly seen by the subject determined contrast sensitivity. Subjects were al- lowed to state that they could not see any gratings. Con- trast sensitivity values were converted to a logarithmic scale for statistical analysis. The visual field was tested us- ing a Humphrey field analyzer with the 30-2 SITA-stan- dard protocol. Only reliable visual fields were considered (≤33% false positives, false negatives; fixation losses
<20%), and the mean deviation was recorded. Peripapillary spectrum domain OCT (SD-OCT) retinal nerve fiber layer (RNFL) thickness measurements were performed with a Spectralis OCT (Heidelberg Engineering, Vista, CA, USA), which provides 40,000 A scans per second with 7 mm optical and 3.5 mm digital axial resolution. The scan circle around the optic nerve is 12 degrees in diameter.
Therefore, the scan circle diameter in millimeters depends on the axial length of the eye. For a typical eye length, the circle would be approximately 3.5 to 3.6 mm in diameter.
The Spectralis OCT software (ver. 4.0) allows for automat- ic segmentation of the upper and lower borders of the RNFL to calculate the average RNFL thickness. Peripapil- lary RNFL thickness values are divided into four quad- rants. The superior and inferior quadrants are further di- vided into nasal and temporal sectors.
NMO-IgG positivity was tested in all patients by cell- based indirect immunofluorescence assay at Samsung Medical Center according to the in-house protocol de- scribed in detail elsewhere [19].
Structural imaging of the optic nerves and brain was performed in all subjects with a 3.0-tesla unit MRI system (Achieva; Philips Medical Systems, Best, The Netherlands) (Fig. 1). The MRI protocol consisted of T1- and T2-weight- ed images with fat suppression with and without gadolini- um-enhancement, diffusion weighted imaging (repetition time 2,500 ms, echo time 75 ms, matrix number 128 × 128, 2 b values of 0 and 1,000 s/mm2, slice thickness 5 mm, in- terslice gap 2 mm, 20 axial slices, and field of view 240 mm), T2 fluid-attenuated inversion recovery (using a fast- spin echo sequence with repetition time / echo time 11,000 / 125 ms, inversion time 2,800 ms, and a 320 × 252 matrix), and gradient-echo (645 ms repetition time, 16 ms echo time, 18° flip angle, 256 × 256 matrix, slice thickness 5 mm, interslice gap 2 mm, 20 axial slices, and field of view
240 mm). A single, blinded observer (JYL) calculated the length of optic nerve enhancement using T1-weighted axi- al images with fat suppression and gadolinium enhance- ment, after the lesions were identified by an experienced radiologist (HJK). The intraobserver reproducibility coef-
Fig. 1. Axial views of gadolinium-enhanced T1-weighted fat-sup- pressed magnetic resonance imaging showing abnormal enhance- ment of the orbital segments of the left optic nerve.
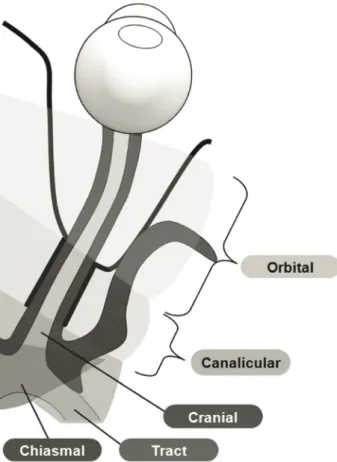
Fig. 2. Illustrations of the segments of the optic nerve used in this study.
ficient of variation was 4.8%. The location of enhancement was determined by segment: orbital (1), canalicular (2), prechiasmal intracranial (3), chiasmal (4), and optic tract (5) (Fig. 2).
Statistical analyses were performed using SAS ver. 9.4 (SAS Inc., Cary, NC, USA). Correlation analysis was per- formed using the Spearman rank correlation two-tailed test on the final visual function including best-corrected visual acuity, color vision test score, contrast sensitivity, mean defect on visual field test, disc NFL thickness, and the diagnosis of idiopathic ON, MS, or NMO with the lo- cation of the optic nerve enhancement and length of the enhancement. The locations of optic nerve enhancement were grouped for analysis in two ways as orbital (1) vs. in- tracranial (2, 3, 4, and 5) and as prechiasmal (1, 2, and 3) vs. chiasmal & optic tract segments (4 and 5). The analysis of variance test and Kruskal-Wallis test were used to com- pare the age, time between the onset and the date of MRI examination, time between the onset and the final visual function test, logMAR visual acuity, color vision, contrast sensitivity, visual field defect, and disc NFL thickness be- tween the ON subgroups, as appropriate. The Pearson’s chi-square test was used to compare age between ON sub- groups. A p-value less than 0.05 was regarded as statisti- cally significant.
Results
Of the 36 patients with ON who underwent orbit and brain MRI within 2 weeks, 20 (55.6%) were female. The mean age was 44.03 ± 13.77 years (mean ± standard devia- tion) . The mean time between the onset of symptoms and the date of the brain MRI was 6.31 ± 4.16 days. The mean time between the onset of symptoms and initial SD-OCT was 9.93 ± 25.65 months (range, 0.5 to 110 months). Most
of the OCT (80.6%) was performed within 2 weeks of the onset of symptom, except that of seven patients (19.4%).
The mean time between the onset of symptoms and the date of the final visual function test and SD-OCT was 22.72 ± 24.13 months. Of the total patients, 19 (52.8%) were diagnosed as idiopathic ON, 9 (25.0%) as NMO, and 8 (22.2%) as MS. The baseline characteristics of ON sub- groups of NMO, MS, and idiopathic ON did not signifi- cantly differ, except age (Table 1). Overall, 26 patients (72.2%) showed only one ON episode, while 10 patients (27.8%) showed more than two ON episodes. The mean number of ON episodes, which was 1.64 ± 1.20 in whole patients, 1.42 ± 0.90 in idiopathic ON, 2.11 ± 1.54 in NMO, and 1.63 ± 1.41 in MS, showed no significant difference among subgroups (p = 0.372, analysis of variance). Table 2 shows the optic disc NFL thicknesses and the descriptive statistics of the functional and vision tests. There were no significant differences between the ON subgroups of NMO, MS, and idiopathic ON for any clinical parameters or for optic disc NFL thicknesses.
Enhancement of the optic nerve occurred in 21 of 36 pa- tients (58.3%) with ON. Among 21 patients with enhance- ment of the optic nerve, 11 (52.4%) were diagnosed with idiopathic ON, 5 (23.8%) with NMO, and 5 (23.8%) with MS. There was no significant difference in characteristics, such as age, sex, final visual acuity, color vision, spherical equivalent, occurrence number of ON, or RNFL thickness between enhancement and non-enhancement groups (p = 0.657, 0.446, 0.590, 0.612, 0.568, 0.141, 0.294, respectively, Mann-Whitney test). Patients with optic nerve enhance- ment showed a higher contrast sensitivity for a spatial fre- quency of 18 cycles per degree (r = 0.448, p = 0.008; Spear- man rank correlation two-tailed test). The other outcomes of final visual function, OCT parameters, and the diagno- ses of idiopathic ON, MS and NMO were not significantly associated with the presence of optic nerve enhancement.
Table 1. Demographic and clinical characteristics of study participants
Idiopathic ON (n = 19) NMO (n = 9) MS (n = 8) p-value
Age (yr) 49.89 ± 12.14 39.44 ± 9.57 35.25 ± 16.01 0.017*
Sex (male / female) 10 / 9 4 / 5 2 / 6 0.419†
Time between the onset and the MRI (day) 5.42 ± 3.93 5.56 ± 3.17 9.25 ± 4.46 0.066* Time between the onset and the final visual function test (mon) 20.21 ± 26.21 25.22 ± 18.16 25.88 ± 27.06 0.392‡ Values are presented as mean ± standard deviation.
ON = optic neuritis; NMO = neuromyelitis optica; MS = multiple sclerosis; MRI = magnetic resonance imaging.
*Analysis of variance; †Pearson’s chi-square test; ‡Kruskal-Wallis test.
The mean length of abnormal enhancement in patients with optic nerve enhancement was 19.32 ± 10.37 mm (range, 8.12 to 44.51 mm). The total length of abnormal en- hancement was significantly correlated with the final con- trast sensitivity for spatial frequencies of 3, 6, 12, and 18 cycles per degree (Table 3). Patients with longer optic nerve sheath enhancement showed higher contrast sensi- tivity. The mean length and location of the optic nerve en- hancement in ON subgroups are listed in Table 4. The length of optic nerve enhancement was not significantly correlated with other visual functions or the diagnosis of idiopathic ON, MS, or NMO. Enhancement was limited to the orbital segment in 12 patients, to the canalicular seg- ment in one patient, and to the optic tract segment in one patient. The other seven patients showed enhancement in two or more segments. Among these seven patients, en- hancement of the optic nerve was located in the orbital and canalicular segments in four patients; the orbital, canalicu- lar, and prechiasmal segments in one patient; and the en- tire segment from the orbital to the optic tract in two pa- tients. The location of enhancement of the optic nerve was also not significantly correlated with final visual function except contrast sensitivity or the diagnosis of idiopathic
ON, MS, or NMO for a spatial frequency of 6, 12, or 18 cycles per degree. The contrast sensitivity was higher when more posterior segments were involved.
Discussion
One of the notable findings in this study was that the percentage of optic nerve enhancement was quite low compared to the reported data in Western countries. Strik- ing differences in the clinical characteristics of ON be- tween Asian and Western countries have been previously documented: low conversion rate to MS [20-22], higher in- cidence of optic disc swelling and hemorrhage, less pain [21], and a lower prevalence of brain MRI abnormalities in ON [22-25] have been reported in Asian countries com- pared to figures in the West. With regard to optic nerve ab- normalities on imaging, optic nerve enhancement was sig- nificantly lower in Asian countries than in Western countries, in which optic nerve enhancement was reported in up to 75% to 95% of cases [26-28]. Optic nerve enhance- ment was seen in about 58% of our patients. This is higher than a previous Asian study by Wang et al. [24], where en- Table 2. Functional and vision test results at the last visit
Idiopathic ON (n = 19) NMO (n = 9) MS (n = 8) p-value
logMAR visual acuity 0.34 ± 0.77 0.56 ± 0.84 0.26 ± 0.70 0.351*
Color vision† 0.62 ± 0.47 0.46 ± 0.51 0.60 ± 0.47 0.564*
Contrast sensitivity‡ (log scale)
1.5 Cycles per degree 1.42 ± 0.44 0.99 ± 0.77 1.17 ± 0.61 0.378*
3 Cycles per degree 1.60 ± 0.52 1.15 ± 0.85 1.38 ± 0.75 0.446*
6 Cycles per degree 1.43 ± 0.53 1.08 ± 0.80 1.22 ± 0.62 0.539*
12 Cycles per degree 1.10 ± 0.40 0.88 ± 0.62 0.99 ± 0.53 0.552§
18 Cycles per degree 0.72 ± 0.34 0.61 ± 0.43 0.74 ± 0.39 0.724§
Visual fieldΠ(mean deviation, dB) –4.99 ± 6.23 –12.17 ± 11.78 –11.77 ± 14.24 0.211* Disc RNFL thickness (µm)
Total 74.67 ± 17.67 65.89 ± 44.17 77.13 ± 18.01 0.646§
Temporal 56.56 ± 14.76 50.11 ± 21.58 63.00 ± 18.21 0.327§
Nasal 51.94 ± 18.84 40.33 ± 38.90 49.25 ± 17.00 0.530§
Superior 91.72 ± 26.39 94.33 ± 82.79 96.50 ± 20.97 0.133*
Inferior 97.22 ± 24.82 79.22 ± 39.79 99.25 ± 26.03 0.275§
Values are presented as mean ± standard deviation.
ON = optic neuritis; NMO = neuromyelitis optica; MS = multiple sclerosis; logMAR = logarithm of the minimal angle of resolution;
RNFL = retinal nerve fiber layer.
*Kruskal-Wallis test; †Ishihara test score / number of test plate; ‡Vistech sine wave gratings; §Analysis of variance; ΠHumphrey field ana- lyzer using the 30-2 SITA-standard protocol.
Table 3. Correlations of the pattern of optic nerve enhancement and the diagnosis of idiopathic ON, NMO, or MS and final visual functions Length of optic nerve enhancementLocation of optic nerve enhancement 1 vs. 2, 3, 4, and 5† 1, 2, and 3 vs. 4 and 5† Correlation coefficientp-value* Correlation coefficientp-value* Correlation coefficientp-value* Diagnosis of idiopathic ON, NMO, or MS--0.0390.862–0.0500.830 logMAR visual acuity–0.2470.147–0.1800.424–0.3470.123 Color vision‡ 0.1150.5170.3800.0980.2910.226 Contrast sensitivity§ (log scale) 1.5 Cycles per degree0.2930.0930.0840.725-- 3 Cycles per degree0.3450.0460.2190.3540.4530.052 6 Cycles per degree0.4080.0160.1650.4870.4450.056 12 Cycles per degree0.4860.0040.2410.3060.4600.047 18 Cycles per degree0.5520.0010.1320.5780.4330.064 Visual fieldΠ (mean deviation, dB) 0.3150.090.0470.8530.2340.365 Disc RNFL thickness (mm) Total–0.0050.9770.0070.9750.1170.615 Temporal0.1460.4020.2640.2350.1630.480 Nasal–0.040.821–0.1110.6230.0330.888 Superior–0.0370.833–0.0700.7590.0600.797 Inferior–0.0120.9440.0270.9060.1730.453 ON = optic neuritis; NMO = neuromyelitis optica; MS = multiple sclerosis; logMAR = logarithm of the minimal angle of resolution; RNFL = retinal nerve fiber layer. * Spearman correlation analysis; † The location of the enhancement was determined by segment: 1, orbital; 2, canalicular; 3, prechiasmal intracranial; 4, chiasmal; 5, optic tract; ‡ Ishihara test score / number of test plate; § Vistech sine wave gratings; Π Humphrey field analyzer using the 30-2 SITA-standard protocol.
hancement was present in only 33%, and another earlier study by Wakakura et al. [23], where optic nerve enhance- ment was reported in only 30% of cases; however, our re- sults are lower than the 66.7% observed by Lim et al. [29].
Because of the significant differences in the treatment and prognosis of idiopathic ON, MS, and NMO, it is cru- cial to differentiate them in patients with ON. Recently, Khanna et al. [16] reported that MRI of the optic nerve could be helpful to differentiate MS and NMO in patients with ON. They reported a propensity of NMO-related ON to affect the more posterior parts of the optic nerve, in- cluding the optic chiasm. However, in our study, there were no significant correlations between diagnosis of idio- pathic ON, NMO, or MS and pattern of optic nerve en- hancement including the length or location of optic nerve enhancement. This could be explained by different inclu- sion criteria and different settings of examination. First, as ON is an acute process and the inflammation could be re- solved or lessen in a short time period, we only included patients who had an MRI within 2 weeks of the first onset of symptoms. Second, although it could differ depending on the criteria applied to define NMO, simultaneous bilat- eral ON itself is regarded as one of the limited forms of NMO by the criteria initially suggested by Wingerchuk et al. [30]. We only included patients with unilateral ON as a presenting symptom because our purpose was to reveal if the pattern of optic nerve enhancement could help to dif- ferentiate among idiopathic ON, NMO, and MS in unilat- eral ON. Racial differences could also affect the results.
The striking differences in the characteristics of ON and
prevalence of NMO between Western and Asian countries might reflect the different natures of the disease between these regions. Their features could differ somewhat in re- lation to optic nerve enhancement and the disease process.
Another interesting finding was that final contrast sensi- tivity was related to the pattern of optic nerve enhance- ment. Patients with a longer optic nerve enhancement and a more posterior location of the enhancement had higher contrast sensitivity. A previous report analyzing the cor- relation with visual function and the pattern of optic nerve enhancement showed that patients with involvement of the canalicular optic nerve had worse color vision and patients with longer optic nerve enhancement had worse visual acuity, contrast sensitivity, and a modestly worse visual field defect, although the correlation was weak [28]. On the contrary, in the present study, unlike our expectation as shown in previous study, the length of the optic nerve en- hancement had a positive correlation with contrast sensi- tivity. We believed this could be due to the distinct charac- teristics of Asian ON, with a high prevalence of atypical forms of ON and a related worse prognosis than typical ON in Western countries. If assuming that prominent en- hancement of the optic nerve might be a characteristic re- flection of the typical ON, the patients with enhancement in this study who have better contrast sensitivity could be a result of a good prognosis from a typical ON. Contrast sensitivity could be influenced by age and visual acuity, and it is proved to be a particularly practical and sensitive indicator of visual dysfunction in ON [31].
The strength of our study was that we only used MRI Table 4. Magnetic resonance image findings in patients with unilateral ON
Idiopathic ON (n = 19) NMO (n = 9) MS (n = 8) p-value Length of optic nerve enhancement (mm) 12.42 ± 13.30 11.11 ± 14.55 8.74 ± 8.13 0.863*
Location of optic nerve enhancement (no. of patients)† -
No enhancement 8 4 3
1 Only 6 3 3
2 Only - - 1
5 Only - - 1
1 + 2 3 1 -
1 + 2 + 3 1 - -
1 + 2 + 3 + 4 1 1 -
Enhancement (total) 11 5 5
ON = optic neuritis; NMO = neuromyelitis optica; MS = multiple sclerosis.
*Kruskal-Wallis test; †The location of the enhancement was determined by segment: 1, orbital; 2, canalicular; 3, prechiasmal intracranial;
4, chiasmal; 5, optic tract.
images within 2 weeks of the onset of symptoms. As a consequence, the time periods of examinations were rela- tively narrow. The limitations of our study were that the sample size was relatively small, limiting the generaliza- tion of our conclusions, ON patients with only one episode who were diagnosed as NMO or MS were included, and we included only Korean patients. Therefore, we cannot apply these results to other populations of different races.
In addition, although our previous study analyzing OCT among subgroups reported a significant difference in RNFL thickness [32], time variation of OCT in this study resulted in a limitation in analyzing OCT data. Despite the above limitations, we found that the pattern of optic nerve enhancement was not associated with a diagnosis of idio- pathic ON, NMO, or MS in Korean patients with unilateral ON. We believe that further studies that include different ethnic groups will lead to a more definitive answer on this subject.
Conflict of Interest
No potential conflict of interest relevant to this article was reported.
References
1. Rodriguez M, Siva A, Cross SA, et al. Optic neuritis: a population-based study in Olmsted County, Minnesota.
Neurology 1995;45:244-50.
2. Lucchinetti CF, Mandler RN, McGavern D, et al. A role for humoral mechanisms in the pathogenesis of Devic’s neuro- myelitis optica. Brain 2002;125(Pt 7):1450-61.
3. Mandler RN, Davis LE, Jeffery DR, Kornfeld M. Devic’s neuromyelitis optica: a clinicopathological study of 8 pa- tients. Ann Neurol 1993;34:162-8.
4. Lefkowitz D, Angelo JN. Neuromyelitis optica with unusu- al vascular changes. Arch Neurol 1984;41:1103-5.
5. Stansbury FC. Neuromyelitis optica; presentation of five cases, with pathologic study, and review of literature. Arch Ophthal 1949;42:292.
6. Scott GI. Neuromyelitis optica. Am J Ophthalmol 1952;35:755-64.
7. Herges K, de Jong BA, Kolkowitz I, et al. Protective effect of an elastase inhibitor in a neuromyelitis optica-like dis-
ease driven by a peptide of myelin oligodendroglial glyco- protein. Mult Scler 2012;18:398-408.
8. Krumbholz M, Faber H, Steinmeyer F, et al. Interferon-be- ta increases BAFF levels in multiple sclerosis: implications for B cell autoimmunity. Brain 2008;131(Pt 6):1455-63.
9. Palace J, Leite MI, Nairne A, Vincent A. Interferon Beta treatment in neuromyelitis optica: increase in relapses and aquaporin 4 antibody titers. Arch Neurol 2010;67:1016-7.
10. Tanaka M, Tanaka K, Komori M. Interferon-beta(1b) treat- ment in neuromyelitis optica. Eur Neurol 2009;62:167-70.
11. Barnett MH, Prineas JW, Buckland ME, et al. Massive as- trocyte destruction in neuromyelitis optica despite natali- zumab therapy. Mult Scler 2012;18:108-12.
12. Kirveskari J, Bono P, Granfors K, et al. Expression of al- pha4-integrins on human neutrophils. J Leukoc Biol 2000;68:243-50.
13. Wingerchuk DM, Lennon VA, Pittock SJ, et al. Revised di- agnostic criteria for neuromyelitis optica. Neurology 2006;66:1485-9.
14. Beck RW, Gal RL, Bhatti MT, et al. Visual function more than 10 years after optic neuritis: experience of the optic neuritis treatment trial. Am J Ophthalmol 2004;137:77-83.
15. Pau D, Al Zubidi N, Yalamanchili S, et al. Optic neuritis.
Eye (Lond) 2011;25:833-42.
16. Khanna S, Sharma A, Huecker J, et al. Magnetic resonance imaging of optic neuritis in patients with neuromyelitis op- tica versus multiple sclerosis. J Neuroophthalmol 2012;32:216- 20.
17. Bambach MR, Mitchell RJ. Estimating the human recov- ery costs of seriously injured road crash casualties. Accid Anal Prev 2015;85:177-85.
18. Polman CH, Reingold SC, Edan G, et al. Diagnostic criteria for multiple sclerosis: 2005 revisions to the “McDonald Criteria.” Ann Neurol 2005;58:840-6.
19. Kang ES, Min JH, Lee KH, Kim BJ. Clinical usefulness of cell-based indirect immunofluorescence assay for the de- tection of aquaporin-4 antibodies in neuromyelitis optica spectrum disorder. Ann Lab Med 2012;32:331-8.
20. Isayama Y, Takahashi T, Shimoyoma T, Yamadori A.
Acute optic neuritis and multiple sclerosis. Neurology 1982;32:73-6.
21. Lim SA, Goh KY, Tow S, et al. Optic neuritis in Singapore.
Singapore Med J 2008;49:667-71.
22. Lin YC, Yen MY, Hsu WM, et al. Low conversion rate to multiple sclerosis in idiopathic optic neuritis patients in Taiwan. Jpn J Ophthalmol 2006;50:170-5.
23. Wakakura M, Minei-Higa R, Oono S, et al. Baseline fea- tures of idiopathic optic neuritis as determined by a multi- center treatment trial in Japan: Optic Neuritis Treatment Trial Multicenter Cooperative Research Group (ONMRG).
Jpn J Ophthalmol 1999;43:127-32.
24. Wang JC, Tow S, Aung T, et al. The presentation, aetiology, management and outcome of optic neuritis in an Asian population. Clin Exp Ophthalmol 2001;29:312-5.
25. Beck RW, Arrington J, Murtagh FR, et al. Brain magnetic resonance imaging in acute optic neuritis: Experience of the Optic Neuritis Study Group. Arch Neurol 1993;50:841-6.
26. Hickman SJ, Miszkiel KA, Plant GT, Miller DH. The optic nerve sheath on MRI in acute optic neuritis. Neuroradiolo- gy 2005;47:51-5.
27. Fazzone HE, Lefton DR, Kupersmith MJ. Optic neuritis:
correlation of pain and magnetic resonance imaging. Oph- thalmology 2003;110:1646-9.
28. Kupersmith MJ, Alban T, Zeiffer B, Lefton D. Contrast-en- hanced MRI in acute optic neuritis: relationship to visual performance. Brain 2002;125(Pt 4):812-22.
29. Lim SA, Sitoh YY, Chng SM, et al. Magnetic resonance imaging in acute optic neuritis in Singapore. Ann Acad Med Singapore 2009;38:821-6.
30. Wingerchuk DM, Lennon VA, Lucchinetti CF, et al. The spec- trum of neuromyelitis optica. Lancet Neurol 2007;6:805-15.
31. Trobe JD, Beck RW, Moke PS, Cleary PA. Contrast sensi- tivity and other vision tests in the optic neuritis treatment trial. Am J Ophthalmol 1996;121:547-53.
32. Park KA, Kim J, Oh SY. Analysis of spectral domain opti- cal coherence tomography measurements in optic neuritis:
differences in neuromyelitis optica, multiple sclerosis, iso- lated optic neuritis and normal healthy controls. Acta Oph- thalmol 2014;92:e57-65.