pISSN 1976-1457 eISSN 2005-6168
Effects of vitamin C and E supplementation on oxidative stress and liver toxicity in rats fed a low-fat ethanol diet
Soo-Jung Lee, Seon-Young Kim and Hyesun Min
§Department of Food and Nutrition, College of Bio-Nano Science, Hannam University, 461-6 Jeonmin-dong, Yuseong-gu, Daejeon 305-811, Korea
Abstract
We compared the preventive capacity of high intakes of vitamin C (VC) and vitamin E (VE) on oxidative stress and liver toxicity in rats fed a low-fat ethanol diet. Thirty-two Wistar rats received the low fat (10% of total calories) Lieber-DeCarli liquid diet as follows: either ethanol alone (Alc group, 36% of total calories) or ethanol in combination with VC (Alc + VC group, 40 mg VC/100 g body weight) or VE (Alc + VE group, 0.8 mg VE/100 g body weight). Control rats were pair-fed a liquid diet with the Alc group. Ethanol administration induced a modest increase in alanine aminotransferase (ALT), aspartate aminotransferase (AST), conjugated dienes (CD), and triglycerides but decreased total radical-trapping antioxidant potential (TRAP) in plasma. VE supplementation to alcohol-fed rats restored the plasma levels of AST, CD, and TRAP to control levels.
However, VC supplementation did not significantly influence plasma ALT, AST, or CD. In addition, a significant increase in plasma aminothiols such as homocysteine and cysteine was observed in the Alc group, but cysteinylglycine and glutathione (GSH) did not change by ethanol feeding.
Supplementing alcohol-fed rats with VC increased plasma GSH and hepatic S-adenosylmethionine, but plasma levels of aminothiols, except GSH, were not influenced by either VC or VE supplementation in ethanol-fed rats. These results indicate that a low-fat ethanol diet induces oxidative stress and consequent liver toxicity similar to a high-fat ethanol diet and that VE supplementation has a protective effect on ethanol-induced oxidative stress and liver toxicity.
Key Words: Ethanol, low fat diet, vitamin E & C, oxidative stress, liver toxicity
Introduction
6)Acute or chronic ethanol ingestion increases reactive oxygen species (ROS) in the liver and plasma as demonstrated in animal and clinical studies [1-3]. The pathogenesis of alcohol-induced liver disease involves the adverse effects of ethanol metabolites and oxidative stress [4]. Oxidative stress in tissues refers to enhanced generation of ROS and/or depletion of antioxidants [5].
Therefore, effective strategies to enhance intracellular and extracellular antioxidant defences in tissues may help protect the liver from injury.
Antioxidants are essential for preventing the cellular damage caused by free radicals. Vitamins E (VE) and C (VC) are naturally occurring antioxidants that protect against oxidative damage by free radical. VE is the major lipid soluble antioxidant in serum and is transported as a component of lipoprotein. VE effectively decreases in vitro and in vivo susceptibility to lipid peroxidation [6,7]. VC, a water-soluble antioxidant, scavenges aqueous peroxyl radicals before they damage lipids [8].
Because ROS are produced naturally, a variety of enzymatic
and nonenzymatic mechanisms have evolved to protect cells against ROS [9,10]. Some of these defence systems are impaired after chronic ethanol consumption. Ethanol or its metabolites can alter the redox balance in the liver to a more oxidized state, impairing the antioxidant cell defenses [11]. Reduced glutathione (GSH), an essential component of the GSH peroxidase system, and VE are probably the most important nonenzymatic antioxi- dants and participate in a wide range of cellular functions. Low molecular weight thiol-containing compounds known as aminothiols are also present, including homocysteine (Hcy), cysteine (Cys), and cysteinylglycine (CysGly) in addition to GSH. Aminothiols function as intracellular redox buffers and constitute an important extracelluar redox system [12,13]. Alterations in plasma Hcy and Cys concentrations are associated with the development of vascular disease [14,15], whereas GSH and its metabolite CysGly have important antioxidative properties [16,17]. Abnormal Hcy metabolism due to chronic ethanol exposure increases fat accumulation, inflammation, and injury to hepatocytes [18,19].
Ethanol-induced hyperhomocysteinemia is associated with oxidative endoplasmic reticulum stress, leading to the activation of
This research was supported by the Basic Science Research Program through the National Research Foundation of Korea (NRF) funded by the Ministry of Education, Science, and Technology (2010-0024002) and by Hannam University Research Funds in 2012.
§Corresponding Author: Hyesun Min, Tel. 82-42-629-8792, Fax. 82-42-629-8789, Email. [email protected] Received: November 6, 2012, Revised: February 12, 2013, Accepted: February 20, 2013
ⓒ2013 The Korean Nutrition Society and the Korean Society of Community Nutrition
This is an Open Access article distributed under the terms of the Creative Commons Attribution Non-Commercial License (http://creativecommons.org/licenses/by-nc/3.0/) which permits unrestricted non-commercial use, distribution, and reproduction in any medium, provided the original work is properly cited.
apoptosis and upregulation of lipid synthesis in hepatocytes [20].
Previous studies have shown that ethanol-induced alcoholic liver injury is associated with changes in methionine metabolism [21-23]. Chronic ethanol ingestion decreases plasma concentrations of folate and hepatic concentrations of S-adenosylmethionine (SAM) [24] and increases plasma Hcy and hepatic S-adenosyl- homocysteine (SAH) in animals and humans [18,22,23]. Hepatic SAM depletion and a decreased SAM:SAH ratio due to chronic ethanol exposure is associated with different degrees of liver injury in animals such as fatty liver, inflammation, and fibrosis [18,21,23].
The aim of the present study was to examine whether ethanol- induced oxidative stress and hepatotoxicity could be neutralised by dietary VC or VE supplementation in rats. Because a high-fat diet also plays an important role in oxidative stress and pathological hepatic changes, the rats were fed a 36% ethanol liquid diet that was relatively low in fat (10%) to examine hepatic toxicity due to ethanol toxicity rather than to a high-fat diet. Few studies have examined the effects of VC or VE supplements on plasma aminothiols in rats chronically treated with ethanol. Thus, we measured plasma alanine transaminase (ALT) and aspartate transaminase (AST) activities to evaluate hepatotoxicity and plasma levels of GSH, total radical-trapping antioxidant potential (TRAP), conjugated dienes, aminothiols, and hepatic SAM to evaluate changes in antioxidant capacity and oxidative stress.
Materials and Methods
Materials
L-Homocystine, tri-n-butylphosphine, DL-methionine, met- myoglobin, 2,2’-azino-bis(3-ethylbenzothiazoline-6-sulfonic acid) diammonium salt (ABTS), heparin, cyclohexane, SAM, and SAH were purchased from Sigma (St. Louis, MO, USA). Lactobacillus rhamnosus (ATCC 7469) was obtained from the American Type Culture Collection (Manassas, VA, USA). Folic acid-depleted casein medium was obtained from Difco Laboratories (Detroit, MI, USA). 7-Fluoro-benzo-2-oxa-1,3-diazole-4-sulfonate was obtained from Wako Chemicals (Osaka, Japan). All chemicals were of the highest purity commercially available.
Animals and experimental protocol
Five-week-old male Wistar rats weighing 170-180 g were obtained from Orient Bio (Seongnam, Korea) and initially fed a chow diet until they reached body weights of 200-220 g. After a 5 day acclimation, the animals were randomly assigned to one of four groups of 8 rats each: (1) control group (no ethanol);
rats were fed a liquid diet that was essentially the same as the diet described by Lieber and DeCarli [25] with the exception of reducing total lipid content from 39.6 g/L to 10 g/L and adding dextrin-maltose to make up the energy deficit. The proportion
of energy in the control liquid diet was as follows: 76%
carbohydrate, 10% fat, and 14% protein. Soybean oil was used as the fat source in the liquid diet. Ethanol was introduced into the diets gradually over 5 days. (2) Alc group; the proportions of energy in the ethanol-fed rat regimens were as follows: 36%
ethanol, 40% carbohydrate, 10% fat, and 14% protein. (3) Alc + VC group (40 mg VC/100 g body weight [BW]): these animals were fed the ethanol diet containing 2 g VC/L (4) Alc + VE group (0.8 mg VE/100 g BW): these animals were fed the ethanol diet containing 40 mg VE/L.
Animals in the pair-fed groups (control, Alc + VC group, and Alc + VE group) were fed the same diet amount as that consumed by the Alc group over the preceding 24 hrs. The amount of diet consumed was monitored daily, and BW was measured weekly.
The diets were fed for 5 weeks. Rats were housed individually in plastic cages in a temperature- (23 ± 1℃) and humidity- controlled (50 ± 5%) room with a daily light cycle from 0600 to 2000 hr. The animal experiments followed protocols established by the NIH Guide for the Care and Use of Laboratory Animals.
This study protocol was approved by the institutional animal care and use committee (HNU 2011-05).
Sample collection
At the end of the 5-week feeding period, the rats were fasted overnight and anesthetised with carbon dioxide. Blood samples were collected by cardiac puncture into heparinised syringes.
Blood was immediately centrifuged for 15 min at 1,500 × g and 4℃ to collect the plasma. Liver tissues were removed, washed in ice-cold saline, and frozen rapidly in liquid nitrogen. The samples were stored at -70
oC until analysis.
Biochemical analyses of plasma and liver tissue
Plasma ALT, AST, and triglycerides were measured using a photometric autoanalyser (ERBA Chem Pro, Transasia Bio- Medicals, Mumbai, India). Plasma levels of aminothiols inclu- ding total Hcy, Cys, CysGly, and GSH were determined by high performance liquid chromatography (HPLC) simultaneously with fluorometric detection (excitation at 385 nm and emission at 515 nm) according to Nolin et al. [26]. Aminothiol compounds were separated on a Hypersil Gold ODS analytical column (250 × 4.6 mm I.D., 5 μm particle size) (Thermo, Runcorn, UK). To determine hepatic levels of SAM and SAH, portions of frozen liver were homogenised with 0.4 M HClO
4and centrifuged at 12,000 × g at 4℃ for 30 min. SAM and SAH were analysed by HPLC equipped with 250 × 4.6 mm Ultrasphere 5-μm ODS Betasil analytical column (Thermo) according to Wagner et al.
[27]. Folate was analysed using a microplate assay method with L. rhamnosus (ATCC 7469) according to Tamura [28]. Portions of liver were homogenised and autolysed for hydrolysis of γ -glutamyl residues in the presence of sodium ascorbate at 37℃.
Supernatants of liver homogenates and plasma samples were used
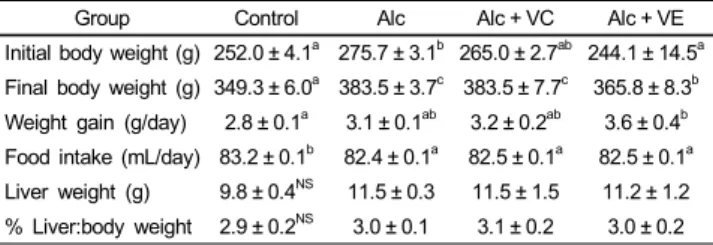
Group Control Alc Alc + VC Alc + VE Initial body weight (g) 252.0 ± 4.1a 275.7 ± 3.1b 265.0 ± 2.7ab 244.1 ± 14.5a Final body weight (g) 349.3 ± 6.0a 383.5 ± 3.7c 383.5 ± 7.7c 365.8 ± 8.3b Weight gain (g/day) 2.8 ± 0.1a 3.1 ± 0.1ab 3.2 ± 0.2ab 3.6 ± 0.4b Food intake (mL/day) 83.2 ± 0.1b 82.4 ± 0.1a 82.5 ± 0.1a 82.5 ± 0.1a Liver weight (g) 9.8 ± 0.4NS 11.5 ± 0.3 11.5 ± 1.5 11.2 ± 1.2
% Liver:body weight 2.9 ± 0.2NS 3.0 ± 0.1 3.1 ± 0.2 3.0 ± 0.2 Data are mean ± SE (n = 8). Values not sharing a common superscript letter are significantly different at P< 0.05.
Control, no ethanol group; NS, not significant.
Table 1. Effects of vitamin C and E supplementation on body and liver weights in chronic ethanol-treated rats
Group Control Alc Alc + VC Alc + VE
ALT (units/L) 155.4 ± 4.8a 209.3 ± 14.6b 184.3 ± 15.9ab 178.1 ± 10.9ab AST (units/L) 204.6 ± 18.6a 292.9 ± 18.1b 250.7 ± 35.1ab 194.2 ± 8.5a TG (mg/dL) 67.3 ± 1.7a 77.2 ± 1.3b 74.8 ± 2.1b 78.3 ± 1.96b Data are mean ± SE (n = 8). Values not sharing a common superscript letter are significantly different at P< 0.05.
Control, no ethanol group.
Table 2. Effects of vitamin C and E supplementation on plasma aminotrans- ferases and triglycerides in chronic ethanol-treated rats
Group Control Alc Alc + VC Alc + VE
Plasma Hcy
(nmol/mL) 10.48 ± 0.48a 12.08 ± 0.82b 12.63 ± 0.73b 12.19 ± 0.41b Plasma Cys
(nmol/mL) 302.0 ± 13.8a 361.6 ± 13.8b 373.1 ± 18.6b 362.1 ± 11.3b Plasma CysGly
(nmol/mL) 0.553 ± 0.103NS 0.518 ± 0.052 0.473 ± 0.031 0.527 ± 0.087 Plasma GSH
(nmol/mL) 46.7 ± 3.2a 55.4 ± 3.6a 90.0 ± 12.1b 48.3 ± 10.7a Data are mean ± SE (n = 8). Values not sharing a common superscript letter are significantly different at P< 0.05.
Control, no ethanol group; NS, not significant.
Table 3. Effects of vitamin C and E supplementation on plasma aminothiols in chronic ethanol-treated rats
for the folate assay.
TRAP was analysed to measure antioxidant potential using an inhibition assay according to Rice-Evans and Miller [29]. Plasma samples were incubated with a peroxidase (met-myoglobin) and H
2O
2to produce the ABTS + cation. A relatively stable blue- green colour occurred and was measured at 30℃ and 740 nm.
Antioxidants in the plasma samples caused suppression of this colour production to a degree proportional to their concentration.
The standard TRAP assay procedure consisted of determining the Trolox equivalent antioxidant capacity (mmol/L). Oxidation of low-density lipoprotein (LDL) was identified by measuring the formation of conjugated dienes (CD) to evaluate early lipid peroxidation. LDL was isolated with buffered heparin as described previously [30-32]. Lipids were extracted from LDL samples with chloroform-methanol (2:1) and dried under nitrogen, then redissolved in cyclohexane to estimate LDL oxidation. The quantity of CD in LDL was assessed by monitoring the change in absorbance at 234 nm at the indicated time points [33]. Results are expressed as μmol/L.
Statistical analysis
Results are expressed as mean ± standard error. Differences among the experimental groups were identified by one-way analysis of variance. Duncan’s multiple range tests were used as a post hoc test, and a P < 0.05 was considered significant.
All statistical analyses were performed using SPSS 20.0 for Window (SPSS, Inc., Chicago, IL, USA).
Results
Food intake, body weight gain, and liver weight
All rats gained weight throughout the study (Table 1). During the 5-day period to gradually introduce ethanol into the liquid diets, rats fed either the Alc or Alc + VC diet gained more weight.
Therefore, the initial body weight of rats fed the Alc diet was higher than that in the control group (P < 0.05). However, after 5 weeks, rats fed the alcohol diets (Alc, Alc + VE, Alc + VC) tended to gain more weight compared to those in the control
group (P < 0.05) and the rats fed the Alc + VE diet gained the most weight, although food intake by the control was higher than that of the ethanol-fed rats. However, ethanol administration alone or with VC or VE supplementation did not affect liver-to- body weight compared to that in the controls.
Plasma ALT, AST, and triglyceride
Chronic ethanol ingestion elevated plasma levels of ALT (P
< 0.05), AST (P < 0.01), and triglycerides (P < 0.01) compared with those in the control (Table 2). VE supplementation to ethanol fed rats restored plasma AST activity to control levels.
However, VE supplementation did not alter plasma triglycerides.
VC supplementation tended to decrease plasma ALT and AST, but the difference was not significant.
Plasma aminothiols, liver SAM and SAH, and folate Chronic ethanol ingestion induced a significant increase in plasma levels of Hcy (P < 0.01) and Cys (P < 0.05) but not CysGly or GSH (Table 3). VC or VE supplementation did not affect plasma Hcy and Cys levels when compared with ethanol feeding alone, but plasma GSH levels in ethanol-fed rats increased in rats supplemented with VC (P < 0.01) but not in those given VE. Ethanol administration reduced plasma folate significantly (P < 0.01), but hepatic folate remained unchanged (Table 4). Plasma folate was significantly higher in rats administered Alc + VC than those given Alc alone. Hepatic SAM was lower in rats administered Alc (P < 0.01), and hepatic SAM and the SAM:SAH ratio was higher in rats administered Alc +
VC compared with those administered Alc alone.
Group Control Alc Alc + VC Alc + VE Plasma folate
(nmol/L)
50.60 ± 4.26b 37.33 ± 3.34a 48.82 ± 3.43b 42.23 ± 3.23ab Liver folate
(μmol/g)
4.91 ± 0.44NS 4.13 ± 0.19 4.02 ± 0.33 4.78 ± 0.34 Liver SAM
(nmol/g)
6.91 ± 1.83ab 5.64 ± 2.37a 9.14 ± 1.76b 6.36 ± 1.62ab Liver SAH
(nmol/g)
5.47 ± 0.95NS 4.93 ± 1.69 5.03 ± 1.09 5.54 ± 0.47 Liver SAM:SAH
ratio
1.28 ± 0.35a 1.20 ± 0.36a 2.21 ± 0.59b 1.48 ± 0.6a
Data are mean ± SE (n = 8). Values not sharing a common superscript letter are significantly different at P< 0.05.
Control, no ethanol group; NS, not significant.
Table 4. Effects of vitamin C and E supplementation on plasma and liver folate and plasma and liver methionine metabolites in chronic ethanol-treated rats
Group Control Alc Alc + VC Alc + VE
TEAC (mmol/L)
1.4376 ± 0.0003c1.4114 ± 0.0020a1.4275 ± 0.0010b1.4269 ± 0.0010b CD
(μmol/L)
29.38 ± 0.72a 34.97 ± 1.28b 34.03 ± 0.65b 29.60 ± 0.97a
Data are mean ± SE (n = 8). Values not sharing a common superscript letter are significantly different at P< 0.05.
The results of plasma TRAP measurements are expressed as TEAC (Trolox Equivalent Antioxidant Capacity) (mmol/L); CD, conjugated dienes of plasma LDL;
Control, no ethanol group; NS, not significant.
Table 5. Effects of vitamin C and E supplementation on plasma total radical- trapping antioxidant potential (TRAP) and conjugated dienes in chronic ethanol- treated rats
Plasma TRAP and conjugated dienes
Chronic ethanol ingestion caused a significant decrease in TRAP levels (P < 0.001) and an increase in CD levels (P < 0.01) (Table 5). VC supplementation increased plasma TRAP levels in ethanol-fed rats compared with those of ethanol feeding alone, but the CD level remained unchanged in rats administered Alc
+ VC. VE supplementation significantly increased plasma TRAP level but decreased CD level in ethanol-fed rats compared with those in rats fed ethanol alone.
Discussion
Chronic ethanol ingestion leads to increased oxidative stress in tissues, and ethanol-induced liver injury is associated with oxidative stress [2,5,12,24]. There is a balance between the generation of free radicals and the antioxidant defence mech- anism during normal metabolism. Antioxidants are essential for preventing the cellular damage caused by free radicals and free radical-modified lipid peroxidation. VC and VE are important dietary modulators for antioxidant capacity of the body [6,7].
One study showed that both VC and VE are reduced during chronic exposure to ethanol [33]. Pretreatment with antioxidants showed that both VC and VE can prevent the generation of 1-hydroxyethyl radicals produced by acute ethanol treatment.
However, conflicting results have been reported concerning oxidative stress following supplementation with antioxidant
vitamins in chronic ethanol-fed rats [34-36].
Because a high-fat diet plays an important role in oxidative stress and pathologic hepatic changes, we examined the effect of an ethanol diet relatively low in fat (10%) on oxidative stress and hepatic toxicity due to ethanol toxicity rather than to a high-fat diet in this study. We observed that ALT and AST were released into the blood after administering the low-fat ethanol diet, indicating that liver toxicity was induced by ethanol. Hepatic oxidative stress and consequent lipid peroxidation play a pathogenic role in alcoholic liver disease [35]. The high fat and low carbohydrate contents of the ethanol liquid regimen are responsible for the ethanol-induced increase in hepatic trigl- ycerides in rats [35]. AST activity, which increases with alcohol intake, was restored to almost normal levels by VE supple- mentation. These results indicate the protective effect of VE supplementation on liver injury in ethanol-fed rats.
We also observed that chronic ethanol administration decreased TRAP and increased CD of plasma LDLs, indicating that enhanced oxidative stress was induced by chronic ethanol administration. These oxidative stress markers decreased to control levels by VE supplementation, demonstrating that VE supple- mentation reduces oxidative stress in rats chronically treated with ethanol. This finding agrees with the results of recent studies [6,7].
The rats fed ethanol gained body weight compared with those in the control group, possibly due to hyperlipidemia, as ingesting ethanol causes hyperlipidemia [37]. We observed that plasma Hcy increased with ethanol feeding. Autoxidation of Hcy is associated with the generation of ROS, including hydrogen peroxide as well as superoxide and hydroxyl radicals [13,38].
VC therapy reverses Hcy-related endothelial damage, supporting a protective effect by this antioxidant [39,40]. A recent study showed that ascorbic acid (25 mg/100 g BW) supplementation ameliorates hepatic steatosis in guinea pigs [41]. However, VC supplementation (40 mg/100 g BW) with ethanol did not alter CD of plasma LDL in the present study. This result suggests that VC did not protect against lipid peroxidation.
Oxidative stress plays a major role in the development of alcoholic liver disease [2,5]. GSH is a major endogenous antioxidant that protects cells against injury by scavenging free radicals, which play a pathogenic role in alcoholic liver disease.
SAM, a primary methyl donor of anabolic metabolism, is a GSH precursor. Chronic ethanol administration decreases hepatic SAM levels due to the depressed activity of methionine adenosyl- methyltransferase and the depressed activity of methionine synthase to participate in the synthesis of endogenous methionine.
Depletion of SAM correlates with increased lipid peroxidation and mitochondrial damage [42]. Thus, chronic depletion of SAM can predispose the liver to injury. SAM has been recently shown to attenuate ethanol-induced liver injury by restoring hepatic concentrations of GSH depleted by ethanol as well as by up-regulating the trans-sulfuration pathway [18,43,44].
We observed that VC supplementation increased plasma GSH
and hepatic SAM concentrations in ethanol-fed rats when compared with those fed ethanol alone. Despite increased plasma GSH and hepatic SAM in rats fed the Alc + VC diet, these animals failed to be protected against liver toxicity in contrast to rats fed Alc + VE. Although the exact reason for the difference in the hepatoprotective effects between the two antioxidant vitamins remains unclear, a high intake of VC may induce hepatic cytochrome P4502E1-linked monooxygenases, which cause adverse pro-oxidant outcomes depending on the VC dose [36].
Taken together, our results indicate that a low-fat ethanol diet induces oxidative stress and consequent liver toxicity similar to a high-fat ethanol diet, and that VE supplementation has a protective effect against oxidative stress and liver toxicity in rats.
Further studies on the protective effects of various doses of VC and VE in chronic alcoholism are needed.
References
1. Vendemiale G, Grattagliano I, Signorile A, Altomare E. Ethanol- induced changes of intracellular thiol compartmentation and protein redox status in the rat liver: effect of tauroursodeoxycholate. J Hepatol 1998;28:46-53.
2. Wu D, Cederbaum AI. Alcohol, oxidative stress, and free radical damage. Alcohol Res Health 2003;27:277-84.
3. Tsukamoto H, Lu SC. Current concepts in the pathogenesis of alcoholic liver injury. FASEB J 2001;15:1335-49.
4. Niemelä O, Parkkila S, Ylä-Herttuala S, Villanueva J, Ruebner B, Halsted CH. Sequential acetaldehyde production, lipid peroxida- tion, and fibrogenesis in micropig model of alcohol-induced liver disease. Hepatology 1995;22:1208-14.
5. Zima T, Fialová L, Mestek O, Janebová M, Crkovská J, Malbohan I, Stípek S, Mikulíková L, Popov P. Oxidative stress, metabolism of ethanol and alcohol-related diseases. J Biomed Sci 2001;8:59-70.
6. Pirozhkov SV, Eskelson CD, Watson RR, Hunter GC, Piotrowski JJ, Bernhard V. Effect of chronic consumption of ethanol and vitamin E on fatty acid composition and lipid peroxidation in rat heart tissue. Alcohol 1992;9:329-34.
7. Brockes C, Buchli C, Locher R, Koch J, Vetter W. Vitamin E prevents extensive lipid peroxidation in patients with hypertension.
Br J Biomed Sci 2003;60:5-8.
8. Lecomte E, Herbeth B, Pirollet P, Chancerelle Y, Arnaud J, Musse N, Paille F, Siest G, Artur Y. Effect of alcohol consu- mption on blood antioxidant nutrients and oxidative stress indicators.
Am J Clin Nutr 1994;60:255-61.
9. Halliwell B. Antioxidant defence mechanisms: from the beginning to the end (of the beginning). Free Radic Res 1999;31:261-72.
10. Fernandez-Checa JC, Ookhtens M, Kaplowitz N. Effects of chronic ethanol feeding on rat hepatocytic glutathione. Relationship of cytosolic glutathione to efflux and mitochondrial sequestration.
J Clin Invest 1989;83:1247-52.
11. Albano E. Alcohol, oxidative stress and free radical damage. Proc Nutr Soc 2006;65:278-90.
12. Deneke SM. Thiol-based antioxidants. Curr Top Cell Regul 2000;36:151-80.
13. Munday R. Toxicity of thiols and disulphides: involvement of free-radical species. Free Radic Biol Med 1989;7:659-73.
14. Graham IM, Daly LE, Refsum HM, Robinson K, Brattström LE, Ueland PM, Palma-Reis RJ, Boers GH, Sheahan RG, Israelsson B, Uiterwaal CS, Meleady R, McMaster D, Verhoef P, Witteman J, Rubba P, Bellet H, Wautrecht JC, de Valk HW, Sales Lúis AC, Parrot-Rouland FM, Tan KS, Higgins I, Garcon D, Andria G. Plasma homocysteine as a risk factor for vascular disease. The European Concerted Action Project. JAMA 1997;277:1775-81.
15. Nygård O, Nordrehaug JE, Refsum H, Ueland PM, Farstad M, Vollset SE. Plasma homocysteine levels and mortality in patients with coronary artery disease. N Engl J Med 1997;337:230-6.
16. Lapenna D, de Gioia S, Ciofani G, Mezzetti A, Ucchino S, Calafiore AM, Napolitano AM, Di Ilio C, Cuccurullo F. Glutathione-related antioxidant defenses in human atherosclerotic plaques. Circulation 1998;97:1930-4.
17. Kugiyama K, Ohgushi M, Motoyama T, Hirashima O, Soejima H, Misumi K, Yoshimura M, Ogawa H, Sugiyama S, Yasue H.
Intracoronary infusion of reduced glutathione improves endothelial vasomotor response to acetylcholine in human coronary circulation.
Circulation 1998;97:2299-301.
18. Song Z, Zhou Z, Chen T, Hill D, Kang J, Barve S, McClain C.
S-adenosylmethionine (SAMe) protects against acute alcohol induced hepatotoxicity in mice small star, filled. J Nutr Biochem 2003;14:
591-7.
19. Song Z, Zhou Z, Deaciuc I, Chen T, McClain CJ. Inhibition of adiponectin production by homocysteine: a potential mechanism for alcoholic liver disease. Hepatology 2008;47:867-79.
20. Ji C, Kaplowitz N. Hyperhomocysteinemia, endoplasmic reticulum stress, and alcoholic liver injury. World J Gastroenterol 2004;10:
1699-708.
21. Barak AJ, Beckenhauer HC, Tuma DJ. S-adenosylmethionine generation and prevention of alcoholic fatty liver by betaine.
Alcohol 1994;11:501-3.
22. Song Z, Zhou Z, Uriarte S, Wang L, Kang YJ, Chen T, Barve S, McClain CJ. S-adenosylhomocysteine sensitizes to TNF-alpha hepatotoxicity in mice and liver cells: a possible etiological factor in alcoholic liver disease. Hepatology 2004;40:989-97.
23. Feo F, Pascale R, Garcea R, Daino L, Pirisi L, Frassetto S, Ruggiu ME, Di Padova C, Stramentinoli G. Effect of the variations of S-adenosyl-L-methionine liver content on fat accumulation and ethanol metabolism in ethanol-intoxicated rats. Toxicol Appl Pharmacol 1986;83:331-41.
24. Lee SJ, Kang MH, Min H. Folic acid supplementation reduces oxidative stress and hepatic toxicity in rats treated chronically with ethanol. Nutr Res Pract 2011;5:520-6.
25. Lieber CS, DeCarli LM. Animal models of chronic ethanol toxicity. Methods Enzymol 1994;233:585-94.
26. Nolin TD, McMenamin ME, Himmelfarb J. Simultaneous deter- mination of total homocysteine, cysteine, cysteinylglycine, and glutathione in human plasma by high-performance liquid chroma- tography: application to studies of oxidative stress. J Chromatogr B Analyt Technol Biomed Life Sci 2007;852:554-61.
27. Wagner J, Claverie N, Danzin C. A rapid high-performance liquid chromatographic procedure for the simultaneous determination of methionine, ethionine, S-adenosylmethionine, S-adenosylethionine, and the natural polyamines in rat tissues. Anal Biochem 1984;
140:108-16.
28. Tamura T. Microbiological assay of folate. In: Picciano MF, Stokstad EL, Gregory JF, editors. Folic Acid Metabolism in Health and Disease. New York: Wiley-Liss; 1990. p.121-37.
29. Rice-Evans C, Miller NJ. Total antioxidant status in plasma and
body fluids. Methods Enzymol 1994;234:279-93.
30. Kleinveld HA, Hak-Lemmers HL, Stalenhoef AF, Demacker PN.
Improved measurement of low-density-lipoprotein susceptibility to copper-induced oxidation: application of a short procedure for isolating low-density lipoprotein. Clin Chem 1992;38:2066-72.
31. Ahotupa M, Marniemi J, Lehtimäki T, Talvinen K, Raitakari OT, Vasankari T, Viikari J, Luoma J, Ylä-Herttuala S. Baseline diene conjugation in LDL lipids as a direct measure of in vivo LDL oxidation. Clin Biochem 1998;31:257-61.
32. Esterbauer H, Striegl G, Puhl H, Rotheneder M. Continuous monitoring of in vitro oxidation of human low density lipoprotein.
Free Radic Res Commun 1989;6:67-75.
33. Navasumrit P, Ward TH, Dodd NJ, O'Connor PJ. Ethanol-induced free radicals and hepatic DNA strand breaks are prevented in vivo by antioxidants: effects of acute and chronic ethanol exposure.
Carcinogenesis 2000;21:93-9.
34. Farbiszewski R, Radecka A, Chwiecko M, Holownia A. The effect of heparegen on antioxidant enzyme activities in ethanol-induced liver injury in rats. Alcohol 1992;9:403-7.
35. Porta EA. Dietary modulation of oxidative stress in alcoholic liver disease in rats. J Nutr 1997;127:912S-915S.
36. Paolini M, Pozzetti L, Pedulli GF, Marchesi E, Cantelli-Forti G.
The nature of prooxidant activity of vitamin C. Life Sci 1999;64:
PL 273-8.
37. Suresh MV, Lal JJ, Kumar S, Indira M. Interaction of ethanol and ascorbic acid on lipid metabolism in guinea pigs. Indian J Exp Biol 1997;35:1065-9.
38. Olszewski AJ, McCully KS. Homocysteine metabolism and the oxidative modification of proteins and lipids. Free Radic Biol
Med 1993;14:683-93.
39. Chambers JC, McGregor A, Jean-Marie J, Obeid OA, Kooner JS.
Demonstration of rapid onset vascular endothelial dysfunction after hyperhomocysteinemia: an effect reversible with vitamin C therapy. Circulation 1999;99:1156-60.
40. Ueland PM, Mansoor MA, Guttormsen AB, Müller F, Aukrust P, Refsum H, Svardal AM. Reduced, oxidized and protein-bound forms of homocysteine and other aminothiols in plasma comprise the redox thiol status--a possible element of the extracellular antioxidant defense system. J Nutr 1996;126:1281S-1284S.
41. Abhilash PA, Harikrishnan R, Indira M. Ascorbic acid supple- mentation causes faster restoration of reduced glutathione content in the regression of alcohol-induced hepatotoxicity in male guinea pigs. Redox Rep 2012;17:72-9.
42. Bailey SM, Robinson G, Pinner A, Chamlee L, Ulasova E, Pompilius M, Page GP, Chhieng D, Jhala N, Landar A, Kharbanda KK, Ballinger S, Darley-Usmar V. S-adenosylmethionine prevents chronic alcohol-induced mitochondrial dysfunction in the rat liver. Am J Physiol Gastrointest Liver Physiol 2006;291:G857-67.
43. García-Ruiz C, Morales A, Colell A, Ballesta A, Rodés J, Kaplowitz N, Fernández-Checa JC. Feeding S-adenosyl-L-methionine attenuates both ethanol-induced depletion of mitochondrial glutathione and mitochondrial dysfunction in periportal and perivenous rat hepa- tocytes. Hepatology 1995;21:207-14.
44. Colell A, García-Ruiz C, Morales A, Ballesta A, Ookhtens M, Rodés J, Kaplowitz N, Fernández-Checa JC. Transport of reduced glutathione in hepatic mitochondria and mitoplasts from ethanol- treated rats: effect of membrane physical properties and S-adenosyl- L-methionine. Hepatology 1997;26:699-708.