INTRODUCTION
Coronary CT angiography (CCTA) has been widely used as a non-invasive imaging modality in clinical practice. CCTA can
In Vivo Detection of Lipid-Core Plaques by Coronary CT Angiography: A Head-to-Head Comparison with
Histologic Findings
Wei-hua Yin, MD
1*, Yan Zhang, MD
1, 2*, Xiang-nan Li, MD
1, Hong-yue Wang, MD
3, Yun-qiang An, MD
1, Yang Sun, MD
3, Zhi-hui Hou, MD
1, Yang Gao, MD
1, Bin Lu, MD
1, Zhe Zheng, MD
41Department of Radiology, Fuwai Hospital, State Key Laboratory of Cardiovascular Disease, National Center for Cardiovascular Diseases, Chinese Academy of Medical Sciences and Peking Union Medical College, Beijing, China; 2Department of Radiology, Affiliated Hospital of Guizhou Medical University, Guiyang, China; Departments of 3Pathology and 4Cardiac Surgery, State Key Laboratory of Cardiovascular Disease, National Center for Cardiovascular Diseases, Chinese Academy of Medical Sciences and Peking Union Medical College, Beijing, China
Objective: We sought to distinguish lipid plaques using a CT quantitative pixel density histogram, based on the pathological diagnosis of lipid cores as the gold standard.
Materials and Methods: Eight patients awaiting heart transplantation due to end-stage coronary heart disease underwent coronary CT angiography (CCTA) spectroscopy prior to heart transplantation; coronary artery pathological analysis was performed for all patients. Lipid-core plaques were defined pathologically as manifesting a lipid core diameter > 200 μm, a circumference > 60 degrees, and a cap thickness < 450 μm. The percentage distributions of CT pixel attenuation ≤ 20, 30, 40, and 50 HU were calculated using quantitative histogram analysis.
Results: A total of 271 transverse sections were co-registered between CCTA and pathological analysis. Overall, 26 lipid cores and 16 fibrous plaques were identified by pathological analysis. There was no significant difference in median CT attenuation between the lipid and fibrous plaques (51 HU [interquartile range, 46–63] vs. 57 HU [interquartile range, 50–64], p = 0.659).
The median percentage of CT pixel attenuation ≤ 30 HU accounted for 11% (5–17) of lipid-core plaques and 0% (0–2) of fibrous plaques (p < 0.001). The sensitivity and specificity of the method for diagnosing lipid plaques by the average CT pixel attenuation ≤ 30 HU were 80.8% and 87.5%, respectively. The area under the receiver operator characteristics curve was 0.898 (95% confidence interval: 0.765–0.970; 3.0% was the best cut-off value). The diagnostic performance was significantly higher than those of the average pixel CT attenuation percentages ≤ 20, 40, and 50 HU and the mean CT attenuation (p < 0.05).
Conclusion: In in vivo conditions, with the pathological lipid core as the gold standard, quantification of the percentage of average CT pixel attenuation ≤ 30 HU in the histogram can be useful for accurate identification of lipid plaques.
Keywords: Coronary CT angiography; Lipid plaque; Quantitative histogram analysis
Received July 31, 2019; accepted after revision October 31, 2019.
This study was granted by the Ministry of Science and Technology of China, National key research and development project (2016YFC1300403) and Fundamental Research Funds for the Central Universities (3332018063).
*These authors contributed equally to this work.
Corresponding author: Bin Lu, MD, Department of Radiology, Fuwai Hospital, State Key Laboratory of Cardiovascular Disease, National Center for Cardiovascular Diseases, Chinese Academy of Medical Sciences and Peking Union Medical College, #167 Bei-Li-Shi Street, Xi- Cheng District, Beijing 100037, China.
• Tel: (8610) 88322662 • Fax: (8610) 68313012 • E-mail: [email protected]
This is an Open Access article distributed under the terms of the Creative Commons Attribution Non-Commercial License (https://
creativecommons.org/licenses/by-nc/4.0) which permits unrestricted non-commercial use, distribution, and reproduction in any medium, provided the original work is properly cited.
be used to accurately identify calcified, non-calcified, and mixed plaques. However, low-density non-calcified plaques can be pathologically lipid plaques or fibrous plaques. Many studies have confirmed that there is a close relationship Korean J Radiol 2020;21(2):210-217
https://doi.org/10.3348/kjr.2019.0557
between the pathological composition of a lipid core and the risk for plaque rupture and acute cardiovascular events (1-3). Hence, accurate differential profiling of lipid plaques from CT low-density plaques can be instrumental in predicting high-risk plaques. Therefore, we sought to employ a method to accurately identify lipid plaques in CT in order to facilitate early clinical risk assessment and help expedite active intervention.
It is difficult to directly identify lipid and fibrous plaques in non-calcified plaques in terms of density using CT imaging. Moreover, there were many overlaps in CT attenuation between lipid and fibrous plaques (4, 5). Previous data have shown that quantitative histogram analysis of non-calcified plaques can be used to distinguish between lipid and fibrous plaques (6, 7).
Different studies have defined CT attenuation at 30 HU or 60 HU to accurately identify lipid and fibrous plaques (6, 7). Taking pathology as the gold standard, the sensitivity and specificity of diagnosing lipid plaques were 71%
and 73%, respectively, and the positive and negative predictive values were 95% and 27%, respectively, when the relative area of a plaque was less than 60 HU based on quantitative histogram analysis (6). Compared with intravascular ultrasound, the method of diagnosing lipid plaques with an average percentage of attenuation < 30 HU is highly accurate, and the sensitivity and specificity are 95% and 80%, respectively (7). However, this method lacked a control comparison of in vivo cardiac CCTA, using pathology as the gold standard as in the previous studies.
Therefore, our study reports an approach to distinguish lipid plaques by quantitative histogram analysis of low- pixel-attenuation plaques by CT, based on pathology as the gold standard.
MATERIALS AND METHODS
Patient Population
All procedures were approved by the Hospital Ethics Committee Review Board (2012-BG-006). Ten patients who were awaiting heart transplantation, from June 2013 to May 2016 (all male, mean age 48.5 ± 11.6 years, range 37–65 years), were prospectively recruited to partake in this study. All patients had coronary heart disease, history of myocardial infarction, heart failure, and left ventricular ejection fraction rates of ≤ 20%. Subject exclusion criteria were prior reaction to iodinated contrast materials, impaired renal function (serum creatinine > 120 µmol/L), inability
to hold their breath, and poor image quality. All patients underwent CCTA before heart transplantation. Of the ten patients approached for participation, two patients were excluded from this study due to poor image quality, since their heart rates were higher than 90 beats/min during CT scanning and the image quality was non-diagnostic with severe motion artefacts. The final study cohort consisted of eight patients who provided written informed consent.
CCTA Examination
All patients were scanned with an Energy Dispersive Spectrum CCTA (High-Definition, CT 750 HD, GE Discovery;
GE Healthcare, Chicago, IL, USA). Patients were given 25–50 mg Betaloc (metoprolol tablets, AstraZeneca Pharmaceutical, Shanghai, China) if their heart rates were higher than 90 beats/min prior to scanning. All patients underwent a prospective electrocardiogram-gated scan with the following parameters: detector collimation of 64 x 0.625 mm, tube rotation time of 0.35 seconds, and image reconstruction layer thickness of 0.625. The energy spectrum scan was set up such that the bulb voltages were 80 and 140 kVp, respectively, and the two tube voltages were switched between 0.3 and 0.5 seconds.
The contrast agent used was 370 mg I/mL of iopamidol (Iopamidol, Shanghai Bolaikexin Pharmaceutical, Shanghai, China). Individualized contrast agent injection protocols with different iodine flow rates were adopted, according to each patient’s weight. The injections involved three phases.
The first phase was injection with a pure contrast agent for 10–12 seconds (whole heart scanning was set at 10 seconds for 3 cardiac cycles and 12 seconds for 4 cardiac cycles).
According to the injection flow rate and time, the total amount of the first phase-contrast agent was determined.
In the second phase, the injection solution was a mixture of 30% contrast agent and 70% saline, with an injection time of 8 seconds. In the third phase, 30 mL saline was injected with a uniform flow rate of 5 mL/s.
All data reconstructions were performed using adaptive statistical iterative reconstruction (ASiR), with a blending factor of 40%. The traditional 80 and 140 kVp images, along with 6 other kinds of single-energy CT images, could be reconstructed. In total, the single-energy CT images included 50, 60, 70, 80, 90, 100, 120, and 140 keV. Of these, the 65–75 keV range was shown to render the best image quality in previous studies (8). As such, we uploaded 70-keV images to the post-processing workstation (AW4.6, GE Healthcare) for analysis in this study.
Two experienced radiologists (with seven and eight years of continuous experience in the field, respectively) fixed the window width and position at 1200 and 240 HU, respectively. The two observers independently evaluated all CCTA studies in random order. Non-calcified plaques from short-axis images were manually traced to acquire the quantitative histogram analysis using ImageJ (version 1.52a: https://imagej.nih.gov/ij/). The CT attenuation of all pixels were displayed within the histogram. The percentage of pixels with a CT attenuation ≤ 20, ≤ 30, ≤ 40, and ≤ 50 HU were calculated by two observers. In addition, the observers recorded the mean CT attenuation of the region of interest.
Pathological Section
After receiving the heart for pathology, it was held lightly to avoid squeezing and to avoid destroying the shape of the coronary arteries. The heart was suspended in a 10%
buffered neutral formalin fixative by a thread passed through the atrial septum. After fixation, the three main branches of the coronary arteries were separated gently, and the vessels were also fully exposed. In addition, only the vertical coronary artery was made into transverse sections, instead of from the longitudinal incision of the coronary artery. Whole vessel decalcification was performed for densely calcified coronary arteries. The preparation was completed within 2 hours after receiving the heart in order to avoid potential changes in the tissue.
Starting from the opening of the coronary artery, the artery was cut into 5-mm segments, dehydrated in an ethanol gradient, cleared by xylene, and embedded in paraffin. Paraffin sections of 4 μm were obtained at 2, 3, and 4 mm of each coronary artery (the stent segments were not taken). The sections were subjected to hematoxylin- eosin staining and elastic fiber staining. The components (lipid core or fibrous plaque) in each arterial segment were analyzed. Plaques were considered for assessment when the thickness of the coronary artery wall was ≥ 0.5 mm. The pathological definition of a lipid core plaque in atherosclerosis is as follows: core diameter > 200 μm, cap thickness < 450 μm, and circumference > 60 degrees (9).
Pathological sections were labeled and recorded in order.
Matching Analysis of CT Images and Pathological Sections
CT short-axis images were matched to pathological sections by another investigator who did not partake in
any data analysis. The distance from the aortic sinus orifice and the anatomical markers (such as diagonal or blunt edge opening level and calcified plaques) were used to identify whether the images were the same (Fig. 1).
Statistical Analysis
The Shapiro-Wilk test was used to analyze the normal distribution of data. Continuous variables are expressed as mean ± standard deviation, and categorical variables are expressed as percentage or frequency. Non-normally distributed variables were summarized as medians and 25th and 75th percentiles. The Mann-Whitney U test was used for comparing lipid-core and fibrous plaques. Inter-observer agreements of measurements of mean CT attenuation and percentage of CT pixel attenuation were assessed by the Bland-Altman method. Reliability was determined using intra-class correlation analyses. An intra-class correlation coefficient of > 0.8 indicated excellent agreement. There are five different methods for diagnosing lipid plaques in this study, including mean CT attenuation, and percentage of pixels with a CT attenuation ≤ 20, ≤ 30, ≤ 40, and ≤ 50 HU.
The sensitivity, specificity, positive predictive value, and negative predictive value of these five diagnostic methods were calculated based on pathological section results as the gold standard. The area under the receiver operating characteristic curve (AUROC), and its 95% confidence interval (CI) were calculated using MedCalc statistical software (version 12.5, Ostend, Belgium). The diagnostic efficiency between these five diagnostic methods were compared by DeLong et al. (10). All statistical analyses were performed on SPSS Statistics software (version 16.0, SPSS Inc., Chicago, IL, USA).
RESULTS
The average heart rate during the CCTA examination was 65 ± 7 beats/min. The mean CT volume dose index for CCTA was 26.2 mGy ± 7.2 (range, 17.2–38.0 mGy). The mean dose-length product was 283.3 mGy*cm ± 28.3 (range, 239.0–318.0 mGy*cm) within our patient cohort. The baseline characteristics are shown in Table 1.
A total of 271 transverse sections were co-registered between CCTA and pathological analysis. Overall, 16 plaques were diagnosed as fibrous plaques and 26 as lipid- core, based on the pathology as the gold standard. There was no significant difference in the median attenuation between lipid and fibrous plaques (51 HU [interquartile
Fig. 1. Example of CT quantitative pixel density histogram analysis of lipid and fibrous plaques.
A, D. Short-axis coronary CT angiography image with manual tracing of noncalcified plaques. B. X-axis of histogram analysis represents scale of CT value. Y-axis represents total number of CT value. There are 4 pixels with CT attenuation ≤ 30 HU, and 4412 is summation of number of pixels within CT low-density plaque. Therefore, percentage of pixels with CT attenuation ≤ 30 HU in histogram analysis is 0.1% (4/4412), which is below threshold of 3.0%. C. Fibrous plaque (arrow) was diagnosed pathologically. E. Percentage of pixel CT attenuation ≤ 30 HU in histogram analysis is 9.8% (175/1785), which is higher than threshold of 3.0%. F. Lipid core (arrow) was diagnosed pathologically.
A
0 255 Count: 1785 Min: 20
Mean: 46.109 Max: 73 StdDev: 14.658 Mode: 37 (117) E
C
0 255 Count: 4412 Min: 30
Mean: 47.213 Max: 63 StdDev: 6.583 Mode: 51 (307) B
D
F
range, 46–63] vs. 57 HU [interquartile range, 50–64], p = 0.659). The median percentage of CT pixel attenuation of ≤ 30 HU was 11% (5-17) for lipid plaques, and 0% (0–2) (p
< 0.001) for fibrous plaques (Fig. 2).
As shown in Figure 3, excellent inter-observer
reproducibility was observed for measurements of mean CT attenuation and percentage of CT pixel attenuation. The mean difference of CT attenuation and percentage of CT pixel attenuation between the two observers was 0.10 ± 1.57 and 0.22 ± 3.74, with no statistical significance (p = 0.70 and 0.45, respectively) and 95% limits of agreement -3.87 to 4.07 and -8.10 to 8.54, respectively. The correlation coefficients between the two observers were 0.99 and 0.98, and intra-class correlation coefficients were 0.989 (95% CI 0.980–0.994), 0.991 (95% CI 0.987–0.993), respectively (all p < 0.001).
Table 2 compares the methods of the percentage of CT pixel attenuation ≤ 20, ≤ 30, ≤ 40, ≤ 50 HU, and the
method of mean CT attenuation to diagnose the accuracy of lipid plaques. The percentage method with CT pixel attenuation ≤ 30 HU showed the best accuracy (sensitivity was 80.8%, specificity was 87.5%, positive predictive value was 91.3%, negative predictive value was 73.7%), and the best cut-off value is 3.0%. When we used the threshold of ≤ 20 HU, there was a slight decrease in sensitivity and specificity (sensitivity was 76.9%, specificity was 81.3%, positive predictive value was 87.0%, negative predictive value was 68.4%). The sensitivity and specificity of
diagnosing lipid plaques were further significantly decreased by the percentage method with CT pixel attenuation ≤ 40 and
≤ 50 HU and the method of traditional mean CT attenuation.
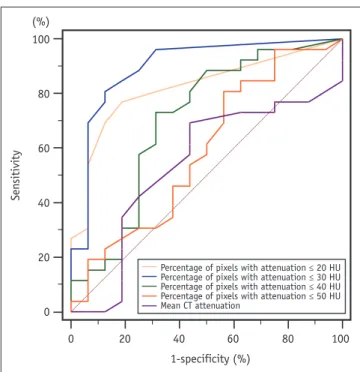
Figure 4 shows the performance of the methods for diagnosing lipid plaques by comparing the AUROC from traditional mean CT attenuation and percentage of pixels with attenuation ≤ 20, ≤ 30, ≤ 40, and ≤ 50 HU. The AUROC of the lipid plaque diagnosed by the percentage method with percentage of pixels with attenuation ≤ 30 HU (blue line) was 0.898 (95% CI 0.765–0.970, p = 0.026), followed by attenuation ≤ 20 HU (pink line) at 0.822 (95% CI 0.673–0.923, p = 0.030). The diagnostic performance was statistically significant between the percentage of pixels with attenuation ≤ 20 and ≤ 30 HU (p = 0.046). The AUROC of attenuation ≤ 40 HU (green line) was 0.703 (95% CI 0.542–0.834, p = 0.035), 0.590 (95% CI 0.428–0.739, p = 0.346) at ≤ 50 HU (brown line), and the mean CT attenuation (purple line) was 0.541 (95% CI 0.380–0.695, p = 0.672).
DISCUSSION
In this study, lipid-core plaques were accurately detected
Fig. 2. Scatter plot of mean CT attenuation (A) and percentage of pixels with attenuation ≤30 HU (B) for plaques identified as fibrous and lipid-core on pathological examination.
85 80 75 70 65 60 55 50 45 40 35
Mean CT attenuation
Fibrous plaques Liqid-core plaques A
60 50 40 30 20 10 0 Percentage of pixels with attenuation ≤ 30 HU
Fibrous plaques Liqid-core plaques B
Table 1. Baseline Characteristics
n = 8
Age (year) 48.5 ± 11.6 (37–65)
Male 8 (100)
Weight (kg) 72.0 ± 8.4 (48.0–95.0)
Hypertension 4 (50.0)
Hypercholesterolemia 5 (62.5)
Smoking 3 (37.5)
Diabetes 3 (37.5)
Angina pectoris 8 (100)
Family history 2 (25.0)
Previous PCI 4 (50.0)
Previous CABG 1 (12.5)
All parameters are expressed as mean standard deviation (range) or number (percentage). CABG = coronary artery bypass graft, PCI = percutaneous intervention
using the percentage of CT pixel attenuation ≤ 30 HU. The percentage of quantitative CT pixel attenuation ≤ 30 HU is a better threshold to distinguish between lipid and fibrous plaques in comparison with that of ≤ 20, ≤ 40, and ≤ 50 HU and the traditional method of mean CT attenuation. The sensitivity and specificity of diagnosing lipid plaques are 80.8% and 87.5%, respectively (AUROC = 0.898), which were significantly higher than those of the other methods. This suggests that the average percentage of CT pixel attenuation
≤ 30 HU was more accurate than the mean attenuation in distinguishing between lipid and fibrous plaques.
Identifying lipid plaques in low-density plaques is closely related to plaque rupture and future cardiovascular events.
Accurate detection of lipid plaques can minimize the risk of misdiagnosis or discrepancy in diagnosis and influence clinical treatment decisions (1, 3). Motoyama et al. (11) found that low-density and positive remolding plaques on CCTA are more likely to develop into acute coronary syndrome. In another study, 1469 patients with suspected coronary heart disease (low to moderate risk) were followed for 7–8 years (12). The results showed that low-density plaques with a CT attenuation of ≤ 60 HU and “napkin ring”
Fig. 3. Excellent inter-observer reproducibility of measurements of mean CT attenuation (A, B) and percentage of pixel CT attenuation (C, D). SD = standard deviation
5 4 3 2 1 0 -1 -2 -3 -4
Observer 1 minus observer 2
30 40 50 60 70 80 90 +1.96 SD
-1.96 SD Mean 3.2
-3.0 0.1
Mean CT attenuation measured by observer 1 and 2
15 10 5 0 -5 -10 -15
Observer 1 minus observer 2
0 20 40 60 80 100 120 +1.96 SD
-1.96 SD Mean 7.6
-7.1 0.2
Mean percentage of pixels CT attenuation measured by observer 1 and 2
80 75 70 65 60 55 50 45 40 35 CT attenuation measured by observer 2
30 40 50 60 70 80 90 y = 3.279 + 0.938 x r = 0.99; p < 0.001
CT attenuation measured by observer 1
100 80 60 40 20 Percentage of pixels CT attenuation measured by observer 2 0
0 20 40 60 80 100 Percentage of pixels CT attenuation
measured by observer 1
y = 0.0985 + 0.987 x r = 0.98; p < 0.001 A
C
B
D
Table 2. Diagnostic Performance of Five Different Diagnostic Methods
Parameter AUROC Sensitivity Specificity PPV NPV
Percentage of pixels with attenuation ≤ 20 HU 0.822 76.9 81.3 87.0 68.4
Percentage of pixels with attenuation ≤ 30 HU 0.898 80.8 87.5 91.3 73.7
Percentage of pixels with attenuation ≤ 40 HU 0.703 73.1 68.8 79.2 61.1
Percentage of pixels with attenuation ≤ 50 HU 0.590 71.1 43.8 70.0 58.3
Mean CT attenuation 0.541 69.2 56.3 72.0 52.9
AUROC = under the receiver operating characteristic curve, NPV = negative predictive value, PPV = positive predictive value
signs were the strongest predictors of future cardiovascular events. Therefore, the identification of lipid plaques is crucial for early clinical risk assessment.
In our study, a total of 42 plaques were pathologically diagnosed as lipid and fibrous plaques and their
corresponding CT attenuations were analyzed. The results showed no significant differences in the median attenuation between fibrous and lipid plaques. In previous studies, the CT values of lipid plaques were in the range of 19–99 HU, and that of fiber plaques were within 89–189 HU (13-15).
In both in vivo and in vitro CCTA, plaque density is shown to be affected by enhanced CT attenuation (6, 16, 17) and is also affected by tube voltage and reconstruction kernels (16, 18). In a recent study, 14 patients underwent repeated CT scans, with a high luminal density CT scan in the first round and with a low luminal density CT scan in the second round.
All patients were subsequently examined by intravascular ultrasound. Nearly one-third of the fibrous plaques in non- calcified plaques were redefined as lipid plaques (17), and the results indicated that enhanced CT attenuation of the coronary artery lumen affected the measurement of plaque density. Both CT attenuation and the corresponding range of fibrous plaque volumes reported in the past were higher than those reported in this study. Various CT scanners have
different temporal and spatial resolution, and different scan protocols have different tube voltage, convolution kernels, and slice thickness. These will all influence the measurement of CT density. Therefore, one possible reason for the
discrepancy is that all patients recruited for this study were scanned by energy spectrum CCTA and reconstructed by 70- keV single energy images and 40% ASiR iteration.
Our results also indicated that percentages of pixels with attenuation ≤ 30 HU larger than the best cut-off value of 3%
could accurately identify lipid-core plaques. However, this observation is based on two-dimensional cross-sectional images and matching with pathologic specimens; the three- dimensional plaque volume could not be evaluated. Three- dimensional plaque volume characteristics may be important to study in the future.
There are some limitations associated with our study.
First, compared with previous in vitro heart experiments, our study of coronary plaque in vivo is physiologically relevant and thus more reliable, although the sample size is relatively small. Cardiomyopathy is one of the leading conditions necessitating heart transplantation in patients, whereas heart transplantation is relatively rare in patients with coronary heart disease. Therefore, it is relatively difficult to obtain good CCTA image quality and appropriate pathological controls. Second, in our study, we defined lipid cores as vulnerable plaques, using pathology as the gold standard. However, the real “gold standard” may be tracking future cardiovascular events in follow-up. Large-sample and follow-up studies are warranted in the future. Third, although we have made an effort to maintain the shape and diameter of the coronary arteries, including formalin fixation, this still inevitably leads to vessel shrinkage with deformation. In order to maintain the shape and diameter as much as possible, the coronary arteries should be selectively cannulated and pressure-perfused (130 mm Hg) with formalin solution in the future, as previously reported (19). In addition, whether or not the energy spectrum CCTA scanning used in this study can be extended to other models and different scanning modalities needs to be explored further. Finally, additional diagnostic reports from radiologists will be required in the future to attest to the reproducibility and applicability of this approach.
In conclusions quantitative histogram analysis on CCTA is useful in distinguishing between lipid-core and fibrous plaques, and lipid plaques can be accurately diagnosed by using the cut-off percentage of the average attenuation of pixels ≤ 30 HU.
100
80
60
40
20
0 (%)
Sensitivity
0 20 40 60 80 100
Percentage of pixels with attenuation ≤ 20 HU Percentage of pixels with attenuation ≤ 30 HU Percentage of pixels with attenuation ≤ 40 HU Percentage of pixels with attenuation ≤ 50 HU Mean CT attenuation
1-specificity (%)
Fig. 4. Comparison of areas under the receiver operating characteristic curve (AUROC) by 5 methods. AUROC by percentage method with percentage of pixels with attenuation ≤ 30 HU (blue line) was 0.898 (95% confidence interval is 0.765–0.970), which was significantly higher compared with other four methods (all p < 0.05).
Conflicts of Interest
The authors have no potential conflicts of interest to disclose.
ORCID iDs Bin Lu
https://orcid.org/0000-0002-1744-7584 Wei-hua Yin
https://orcid.org/0000-0001-8932-5554 Yan Zhang
https://orcid.org/0000-0002-4055-4863
REFERENCES
1. Chang HJ, Lin FY, Lee SE, Andreini D, Bax J, Cademartiri F, et al. Coronary atherosclerotic precursors of acute coronary syndromes. J Am Coll Cardiol 2018;71:2511-2522
2. Chow BJ, Wells GA, Chen L, Yam Y, Galiwango P, Abraham A, et al. Prognostic value of 64-slice cardiac computed tomography severity of coronary artery disease, coronary atherosclerosis, and left ventricular ejection fraction. J Am Coll Cardiol 2010;55:1017-1028
3. Ferencik M, Schlett CL, Ghoshhajra BB, Kriegel MF, Joshi SB, Maurovich-Horvat P, et al. A computed tomography-based coronary lesion score to predict acute coronary syndrome among patients with acute chest pain and significant coronary stenosis on coronary computed tomographic angiogram. Am J Cardiol 2012;110:183-189
4. Pohle K, Achenbach S, Macneill B, Ropers D, Ferencik M, Moselewski F, et al. Characterization of non-calcified coronary atherosclerotic plaque by multi-detector row CT: comparison to IVUS. Atherosclerosis 2007;190:174-180
5. Leschka S, Seitun S, Dettmer M, Baumüller S, Stolzmann P, Goetti R, et al. Ex vivo evaluation of coronary atherosclerotic plaques: characterization with dual-source CT in comparison with histopathology. J Cardiovasc Comput Tomogr 2010;4:301-308 6. Schlett CL, Maurovich-Horvat P, Ferencik M, Alkadhi H,
Stolzmann P, Scheffel H, et al. Histogram analysis of lipid- core plaques in coronary computed tomographic angiography:
ex vivo validation against histology. Invest Radiol 2013;48:646-653
7. Marwan M, Taher MA, El Meniawy K, Awadallah H, Pflederer T, Schuhbäck A, et al. In vivo CT detection of lipid-rich coronary artery atherosclerotic plaques using quantitative histogram analysis: a head to head comparison with IVUS.
Atherosclerosis 2011;215:110-115
8. Fuchs TA, Stehli J, Fiechter M, Dougoud S, Gebhard C, Ghadri JR, et al. First experience with monochromatic coronary computed tomography angiography from a 64-slice CT scanner
with gemstone spectral imaging (GSI). J Cardiovasc Comput Tomogr 2013;7:25-31
9. Gardner CM, Tan H, Hull EL, Lisauskas JB, Sum ST, Meese TM, et al. Detection of lipid core coronary plaques in autopsy specimens with a novel catheter-based near-infrared
spectroscopy system. JACC Cardiovasc Imaging 2008;1:638-648 10. DeLong ER, DeLong DM, Clarke-Pearson DL. Comparing
the areas under two or more correlated receiver operating characteristic curves: a nonparametric approach. Biometrics 1988;44:837-845
11. Motoyama S, Sarai M, Harigaya H, Anno H, Inoue K, Hara T, et al. Computed tomographic angiography characteristics of atherosclerotic plaques subsequently resulting in acute coronary syndrome. J Am Coll Cardiol 2009;54:49-57 12. Feuchtner G, Kerber J, Burghard P, Dichtl W, Friedrich G,
Bonaros N, et al. The high-risk criteria low-attenuation plaque
<60 HU and the napkin-ring sign are the most powerful predictors of MACE: a long-term follow-up study. Eur Heart J Cardiovasc Imaging 2017;18:772-779
13. Leber AW, Knez A, Becker A, Becker C, von Ziegler F, Nikolaou K, et al. Accuracy of multidetector spiral computed tomography in identifying and differentiating the composition of coronary atherosclerotic plaques: a comparative study with intracoronary ultrasound. J Am Coll Cardiol 2004;43:1241-1247 14. Petranovic M, Soni A, Bezzera H, Loureiro R, Sarwar A, Raffel
C, et al. Assessment of nonstenotic coronary lesions by 64-slice multidetector computed tomography in comparison to intravascular ultrasound: evaluation of nonculprit coronary lesions. J Cardiovasc Comput Tomogr 2009;3:24-31
15. Schroeder S, Kopp AF, Baumbach A, Meisner C, Kuettner A, Georg C, et al. Noninvasive detection and evaluation of atherosclerotic coronary plaques with multislice computed tomography. J Am Coll Cardiol 2001;37:1430-1435 16. Dalager MG, Bøttcher M, Dalager S, Andersen G, Thygesen
J, Pedersen EM, et al. Imaging atherosclerotic plaques by cardiac computed tomography in vitro: impact of contrast type and acquisition protocol. Invest Radiol 2011;46:790-795 17. Dalager MG, Bøttcher M, Andersen G, Thygesen J, Pedersen
EM, Dejbjerg L, et al. Impact of luminal density on plaque classification by CT coronary angiography. Int J Cardiovasc Imaging 2011;27:593-600
18. Achenbach S, Boehmer K, Pflederer T, Ropers D, Seltmann M, Lell M, et al. Influence of slice thickness and reconstruction kernel on the computed tomographic attenuation of coronary atherosclerotic plaque. J Cardiovasc Comput Tomogr 2010;4:110-115
19. Maurovich-Horvat P, Schlett CL, Alkadhi H, Nakano M, Otsuka F, Stolzmann P, et al. The napkin-ring sign indicates advanced atherosclerotic lesions in coronary CT angiography. JACC Cardiovasc Imaging 2012;5:1243-1252