Antispastic Effect of Electroacupuncture on Upper Extremity in Stroke Patients by T-reflex Study
: A Single-Blind, Randomized Controlled, Preliminary Study
Min Kyoung Cho
1, In Lee
2,4, Jung Nam Kwon
2,4, Byung Cheul Shin
3,4Sung Hwa Ko
5, Hyun Yoon Ko
6, Yong Il Shin
6, Jin Woo Hong
2,41Department of Internal Medicine of Korean Medicine,
Korean Medicine Hospital of Daejeon University, Cheongju, Republic of Korea
2Department of Internal Medicine of Korean Medicine,
Pusan National University Korean Medicine Hospital, Yangsan, Republic of Korea
3Department of Rehabilitation Medicine of Korean Medicine,
Pusan National University Korean Medicine Hospital, Yangsan, Republic of Korea
4Pusan National University School of Korean Medicine, Yangsan, Republic of Korea
5Department of Rehabilitation Medicine, Pusan National University Hospital, Pusan, Republic of Korea
6Department of Rehabilitation Medicine, Pusan National University Yangsan Hospital, Pusan National University School of Medicine, Yangsan, Republic of Korea Original Article
⋅Received:19 November 2015 ⋅Revised:23 December 2015 ⋅Accepted:24 December 2015
⋅Correspondence to:Jin Woo Hong
Department of Internal Medicine of Korean Medicine, Pusan National University Korean Medicine Hospital.
Beomeo-ri, Mulgeum-eup, Yangsan-si, Gyeongsangnam-do, Korea(Republic of) Tel:+82-55-360-5962, Fax:+82-55-360-5509, E-mail:[email protected]
⋅Correspondence to : Yong Il Shin
Department of Rehabilitation Medicine, Pusan National University Yangsan Hospital.
Beomeo-ri, Mulgeum-eup, Yangsan-si, Gyeongsangnam-do, Korea(Republic of) Tel:+82-55-360-2872, Fax:+82-55-360-1524, E-mail:[email protected]
Objectives: There have been several studies evaluated effect of electroacupuncture (EA) on spasticity but most studies could not assess spasticity quantitatively because they used clinical rating scales for assessment spasticity. The objective of this study is to evaluate effect of EA on poststroke spasticity quantitatively using tendon reflex (T-reflex).
Methods: 29 stroke patients with upper extremity spasticity were randomized to EA group and control group. The EA group received combined EA and rehabilitation therapy 5 times a week for 3 weeks. Acupuncture treatment was given at Jian Yu (LI 15), Qu Chi (LI 11), Shao Hai (HT 3), Wai Guan (TE 5), He Gu (LI 4), Lie Que (LU 7), Hou Xi (SI 3) of the affected side, 30 minutes of electrical stimulation with a frequency of 40/13 Hz was applied at Qu Chi (LI 11), He Gu (LI 4). The control group received only rehabilitation therapy. The efficacy of treatment was assessed using T-reflex latency and amplitude, modified Ashworth scale (MAS) of biceps brachii, brachioradialis and triceps brachii. Fugl-Meyer motor function assessment (FMA) and functional independence measure (FIM) were also measured to assess motor function and functional independence. All outcomes were measured before treatment, immediately after 3 weeks of treatment and 1 week after 3 weeks of treatment.
Results: No statistically significant differences were found in outcomes including T-reflex between the study groups except for FIM values immediately after 3 weeks of treatment (p=0.037).
Conclusions: These results suggest that 3 weeks of EA does not reduce poststroke upper extremity spasticity electrophysiologically and clinically. However, small sample sizes and contradictory tendency between results from T-reflex and those from MAS require cautious judgement on interpretation of the results. A larger, well-designed clinical trials for quantitative evaluation of effect of EA on poststroke spasticity will be needed.
Key Words : Poststroke spasticity, Electroacupuncture, T-reflex study
Introduction
According to Statistics Korea, stroke was the third leading cause of mortality in South Korea in 2012
1). Worldwide stroke-related mortality went up 26%
compared with 1990 and reached 5.9 million in 2010
2).
Spasticity is one of the most common complications of stroke, estimated prevalence of poststroke spasticity were variable, ranging from 17% to 42.6% in the chronic phase
3), with the prevalence of disabling spasticity 13%
4).
When severe, spasticity can limit patient's range of motion, functional or gait ability and prolonged spasticity may result in shortening of tendons, soft tissue contracture, pain from immobile joints, as a result, it has bad influence on rehabilitation of stroke patient. Furthermore, spasticity increases economic burden of stroke patient. Lundström et al. reported that direct costs for patients with spasticity were 4 times higher than that for patients without spasticity during the first year after stroke
5). Therefore, managing spasticity is very important to improve functional movement and quality of life of stroke patients.
Electroacupuncture (EA) is one of acupuncture modalities administers pulsed electrical stimulation through the skin of the human body and it shows synergic effect of acupoint stimulation and electrical stimulation
6). EA can concentrate electrical stimulation on any part of the body, regulate stimulus quantity objectively, and lessen systemic side effects because of focal stimulation
7).
There have been several studies evaluated effect of EA on poststroke spasticity but most studies could not assess spasticity quantitatively because they mainly used clinical rating scales such as Modified Ashworth scale (MAS) for assessment spasticity
8-11). This study was designed to evaluate antispastic effect of EA on poststroke spasticity quantitatively using tendon reflex (T-reflex).
T-reflex is an electrophysiologic test quantifying
stretch reflex, that is muscle contraction in response to stretching by tendon tap
12), and assessing spasticity sensitively
13). This report presents the results of the study, which compared the effect of combined EA and rehabilitation therapy with that of rehabilitation -alone therapy on poststroke upper extremity spasticity using T-reflex quantitatively.
Subjects and Methods
1. Subjects
Patients who were 18 years or older and hospitalized in department of rehabilitation medicine, Pusan National University Yangsan Hospital during the period from November 2010 to March 2011 were recruited. Among them, patients who were diagnosed with stroke by CT or MRI of the brain, over 2 weeks out from the onset of the stroke and had 2 or more muscles of biceps brachii, brachioradialis, triceps brachii that were assessed grade 1 or more by MAS of the affected side were enrolled for this study. Patients were excluded if they had (a) participated in other clinical study within 30 days before this study (b) severe neurological or psychological disorder except for stroke (c) past history of hypersensitivity to EA (d) difficulty in being treated with acupuncture because of edema, skin diseases, etc. (e) been thought to be inadequate for this study. All subjects were randomized to EA group and control group by a Physiatrist using SPSS random number generation.
For all subjects, conventional treatment for stroke management was allowed but dosage of antispastic drugs was fixed and new antispastic drugs was not allowed during this study.
2. Methods
A parallel design clinical trial was conducted for
this study. All subjects continued to receive previous
rehabilitation therapy once daily, 5 times a week
according to their own neurological status and functional recovery during this study.
The EA group received additional EA once daily, 5 times a week. Acupuncture treatment was given at acupoint Jian Yu (LI 15), Qu Chi (LI 11), Shao Hai (HT 3), Wai Guan (TE 5), He Gu (LI 4), Lie Que (LU 7), Hou Xi (SI 3) of the affected side using disposable stainless steel needles (diameter 0.25 mm, length 4 cm, Dongbang Acupuncture Inc., Korea).
The depth of needle insertion was different according to acupoint but it was about 10~20 mm.
Thereafter, 30 minutes of electrical stimulation (ES-160, ITO co., LTD., Japan) with a frequency of 40/13 Hz was applied at Qu Chi (LI 11), He Gu (LI 4). The intensity of electrical stimulation was adjusted to be strong enough to elicit visible muscle contractions but not painful for subjects. EA was given by traditional Korean medicine clinician with more than 4 years of career. The study protocol was registered at the Clinical Research Information Service (CRIS) which is an online registration system for clinical trials in South Korea (registration number: KCT0001422, https://cris.nih.go.kr/cris/search/
search_result_st01_en.jsp?seq=4834&type=).
3. Assessments
1) T-reflex (Tendon reflex)
T-reflex, which is an electrophysiologic test quantifying stretch reflex was used to assess spasticity quantitatively. T-reflex was measured before treatment, immediately after 3 weeks of treatment and 1 week after 3 weeks of treatment in all subjects. To measure T-reflex, electromyogram Dantec Keypoint (Medtronic Functional Diagnostics, Skovlunde, Denmark) with a speed of 10 msec/ division, a sensitivity of 0.2~2 mV/division, a frequency range of 10 Hz~10 kHz was used. The test muscles were biceps brachii, brachioradialis and triceps brachii of the affected side.
At the middle of the each muscle, an activated electrode was attached, and an indifferent electrode to
estimate was attached to 5 cm below of the activated electrode. Then the tendon area was tapped by an electric reflex hammer to elicit tendon reflex, and latency and amplitude from the recorded waveform was measured. Latency is elapsed time between the tendon tap stimulus and the first deflection from the recorded waveform, amplitude is the difference between positive and negative peaks in terms of mV
14). Latencies of three muscles were added together and indicated Total Latency Values, amplitudes of three muscles were added together and indicated Total Amplitude Values.
2) MAS (Modified Ashworth scale)
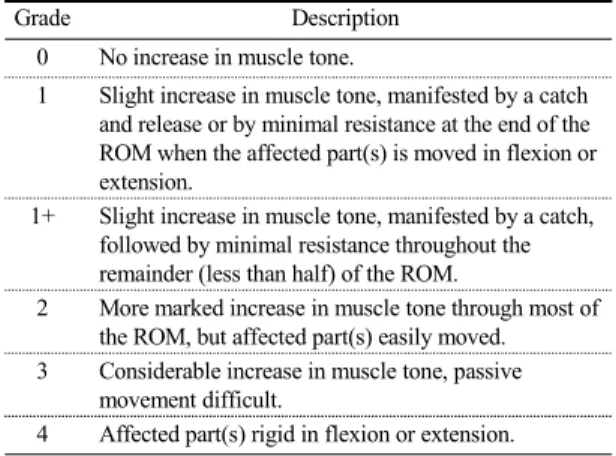
MAS was used to assess spasticity clinically (Table 1.). MAS was measured before treatment, immediately after 3 weeks of treatment and 1 week after 3 weeks of treatment in all subjects. The test muscles were biceps brachii, brachioradialis and triceps brachii of the affected side. The subject was relaxed with upper extremity of the affected side fixed not to move. Then the rater measured resistance of the muscle while extending each muscle with medium speed and repeated measurement to reduce intra-rater error. For statistical analysis, the values of MAS were changed as follows; Grade 1=1, Grade 1+=2, Grade 2=3, Grade 3=4, Grade 4=5. The changed values were added together and indicated Total MAS Values.
3) FMA (Fugl-Meyer motor function assessment), FIM (Functional independence measure) To assess motor function of upper extremity and functional independence, Fugl-Meyer motor function assessment (FMA) and functional independence measure (FIM) were measured before treatment, immediately after 3 weeks of treatment and 1 week after 3 weeks of treatment in all subjects.
Each item on the FMA is rated on a 3 point
ordinal scale and scored as follows; cannot perform=0
point, performs partially=1 point, performs fully=2
Grade Description 0 No increase in muscle tone.
1 Slight increase in muscle tone, manifested by a catch and release or by minimal resistance at the end of the ROM when the affected part(s) is moved in flexion or extension.
1+ Slight increase in muscle tone, manifested by a catch, followed by minimal resistance throughout the remainder (less than half) of the ROM.
2 More marked increase in muscle tone through most of the ROM, but affected part(s) easily moved.
3 Considerable increase in muscle tone, passive movement difficult.
4 Affected part(s) rigid in flexion or extension.
ROM, range of motion
Table 1. MAS (Modified Ashworth scale)
points. FMA assesses motor function, sensation, balance, joint range of motion, pain and maximum score is 226 points but only motor function (66 points) and sensation (12 points) of upper extremity were assessed in this study.
FIM is an evaluative instrument for activities of daily living and consists of 18 items, grouped into motor (13 items) and cognition (5 items). Scores of each item on the FIM ranges from 1 point to 7 points according to performance and maximum score is 126 points (Table 1.).
4. Statistical analysis
All statistical analyses were performed using PASW Statistics 18.0 in this study. To compare baseline characteristics between the study groups, according to normality, we used the Chi-square test or Fisher's exact test for categorical data and Independent t-test or Mann-Whitney U-test for continuous data.
To analyse efficacy of treatment within each group, we compared all outcomes measured before treatment with immediately after 3 weeks of treatment and before treatment with 1 week after 3 weeks of treatment using Paired t-test or Wilcoxon signed rank test according to normality. To analyse efficacy of treatment between the study groups, we compared all outcomes measured before treatment,
immediately after 3 weeks of treatment and 1 week after 3 weeks of treatment of both groups using Independent t-test.
All results were shown as frequencies and percentages for continuous data, as mean±SD for categorical data. A P-value of <0.05 was considered statistically significant.
Results
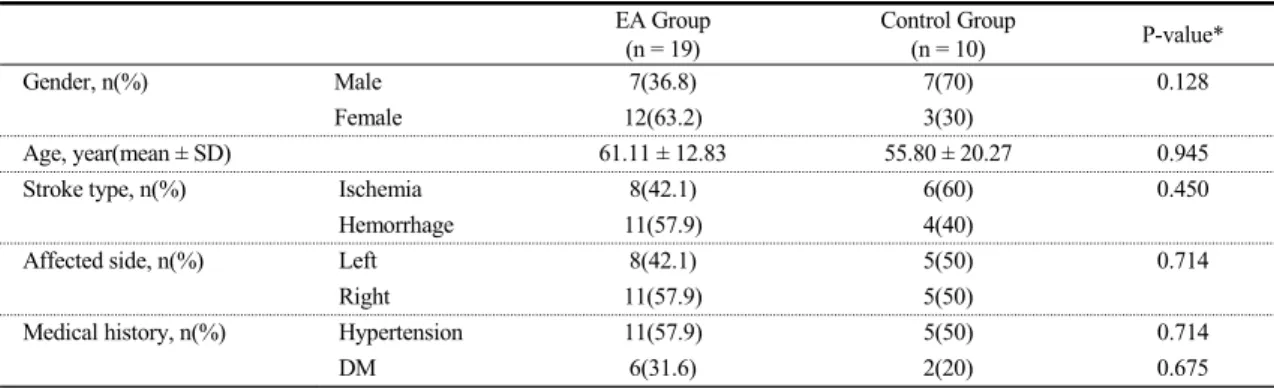
1. Baseline characteristics of the study groups
A total of 35 patients were enrolled for this study but 29 completed the whole study course. 3 were excluded because they did not meet inclusion criteria and 3 did not complete the study because they were discharged from the hospital during this study. 29 subjects were randomized to EA group (n=19) and control group (n=10). Different number of allocated subjects in the study groups was result of high withdrawal rate of control group.
The EA group consisted of 7 (36.8%) male and 12 (63.2%) female subjects, the control group of 7 (70%) male and 3 (30%) female subjects. The mean age of the EA group was 61.11±12.83 years, the control group was 55.80±20.27 years.
The EA group consisted of 8 (42.1%) ischemic
and 11 (57.9%) hemorrhagic stroke, the control
group of 6 (60%) ischemic and 4 (40%) hemorrhagic
stroke. 8 (42.1%) were affected left side and 11
(57.9%) right side in the EA group, percentages of
affected side were same in the control group. There
were no statistically significant differences between
the study groups in all variables (Table 2.). When
we were planning this study, we did not placed a
limit on time since stroke except over 2 weeks out
from the onset of the stroke to raise rate of
participation. So it was not available to collect each
time since stroke information of subject. No
significant side effects were found during the study
period in both groups.
EA Group (n = 19)
Control Group
(n = 10) P-value*
Gender, n(%) Male 7(36.8) 7(70) 0.128
Female 12(63.2) 3(30)
Age, year(mean ± SD) 61.11 ± 12.83 55.80 ± 20.27 0.945
Stroke type, n(%) Ischemia 8(42.1) 6(60) 0.450
Hemorrhage 11(57.9) 4(40)
Affected side, n(%) Left 8(42.1) 5(50) 0.714
Right 11(57.9) 5(50)
Medical history, n(%) Hypertension 11(57.9) 5(50) 0.714
DM 6(31.6) 2(20) 0.675
*: Mann-Whitney U-test for age. Fisher's exact test for others.
EA, electroacupuncture; SD, standard deviation; DM, diabetes mellitus
Table 3. Changes in Total T-reflex Latency Values According to Treatment Period
Group Before Treatment After 3 weeks of Treatment
Immediately 1 week
EA Group 48.10 ± 6.66 46.89 ± 3.66 48.66 ± 4.34
P-value* (Pre-Post) 0.448 0.727
Control Group 49.77 ± 8.64 52.24 ± 8.19 51.97 ± 8.37
P-value* (Pre-Post) 0.310 0.410
P-value† (Intergroup) 0.569 0.076 0.265
*: Paired t-test †: Independent t-test
Total T-reflex Latency Values (ms) are sum of T-reflex latencies in biceps brachii, brachioradialis and triceps brachii of the affected side.
Each Pre-Post P-value in both groups is result from comparison with baseline(Before Treatment) value.
T-reflex, tendon reflex; EA, electroacupuncture
Table 4. Changes in Total T-reflex Amplitude Values According to Treatment Period
Group Before Treatment After 3 weeks of Treatment
Immediately 1 week
EA Group 5.86 ± 2.84 6.91 ± 4.41 7.37 ± 6.25
P-value* (Pre-Post) 0.208 0.445
Control Group 5.04 ± 2.19 5.42 ± 2.47 5.80 ± 3.05
P-value* (Pre-Post) 0.632 0.387
P-value† (Intergroup) 0.433 0.332 0.460
*: Wilcoxon signed rank test for 1 week after 3 weeks of treatment in EA Group. Paired t-test for others. †: Independent t-test
Total T-reflex Amplitude Values (mV) are sum of T-reflex amplitudes in biceps brachii, brachioradialis and triceps brachii of the affected side.
Each Pre-Post P-value in both groups is result from comparison with baseline(Before Treatment) value.
T-reflex, tendon reflex; EA, electroacupuncture
Table 2. Baseline Characteristics of the Study Groups
2. Changes in T-reflex according to treatment period
1) Changes in Total Latency Values
There were no statistically significant differences within each group and between the study groups (Table 3.).
2) Changes in Total Amplitude Values
There were no statistically significant differences within each group and between the study groups (Table 4.).
3. Changes in MAS according to
treatment period
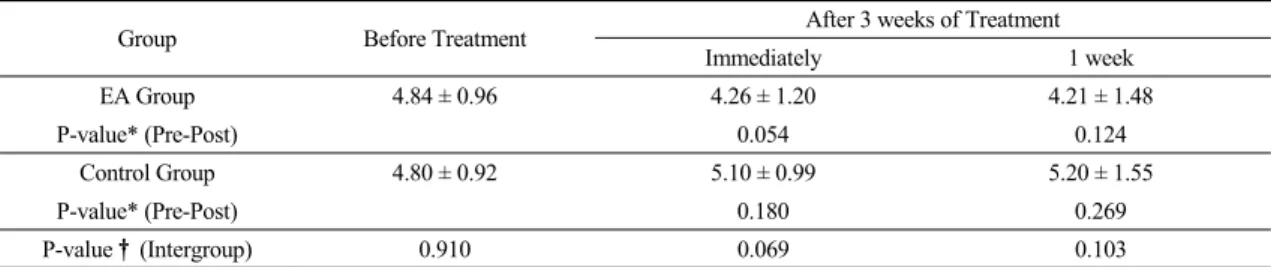
Table 5. Changes in Total MAS Values According to Treatment Period
Group Before Treatment After 3 weeks of Treatment
Immediately 1 week
EA Group 4.84 ± 0.96 4.26 ± 1.20 4.21 ± 1.48
P-value* (Pre-Post) 0.054 0.124
Control Group 4.80 ± 0.92 5.10 ± 0.99 5.20 ± 1.55
P-value* (Pre-Post) 0.180 0.269
P-value† (Intergroup) 0.910 0.069 0.103
*: Wilcoxon signed rank test for immediately after 3 weeks of treatment in both groups. Paired t-test for others. †: Independent t-test Total MAS Values are sum of values of MAS in biceps brachii, brachioradialis and triceps brachii of the affected side.
Each Pre-Post P-value in both groups is result from comparison with baseline(Before Treatment) value.
MAS, modified Ashworth scale; EA, electroacupuncture
Table 6. Changes in FMA Values According to Treatment Period
Group Before Treatment After 3 weeks of Treatment
Immediately 1 week
EA Group 28.05 ± 17.29 41.53 ± 23.85 41.11 ± 21.08
P-value* (Pre-Post) 0.000 0.000
Control Group 31.30 ± 20.60 41.00 ± 28.45 42.60 ± 29.22
P-value* (Pre-Post) 0.012 0.012
P-value† (Intergroup) 0.656 0.958 0.875
*: Wilcoxon signed rank test †: Independent t-test
Each Pre-Post P-value in both groups is result from comparison with baseline(Before Treatment) value.
FMA, Fugl-Meyer motor function assessment; EA, electroacupuncture
No statistically significant differences were found between the study groups, but in the EA group, Total MAS Values measured immediately after 3 weeks of treatment were statistically borderline less than those before treatment (p=0.054) (Table 5.).
4. Changes in FMA and FIM according to treatment period
1) Changes in FMA Values
No statistically significant differences were found between the study groups, but in both groups, FMA Values measured immediately after 3 weeks of treatment and 1 week after 3 weeks of treatment were statistically significant higher than those before treatment (Table 6.).
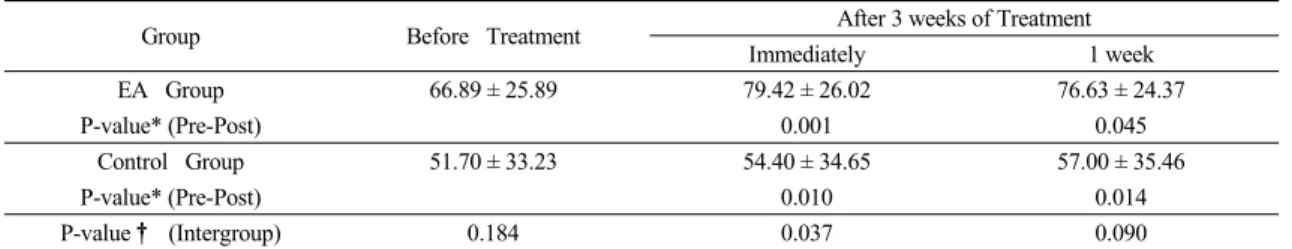
2) Changes in FIM Values
In FIM Values measured immediately after 3 weeks of treatment, the EA group was statistically
significant higher than the control group (p=0.037), but there were no statistically significant differences between the study groups in FIM Values measured 1 week after 3 weeks of treatment (p=0.090). In both groups, FIM Values measured immediately after 3 weeks of treatment and 1 week after 3 weeks of treatment were statistically significant higher than those before treatment (Table 7.).
Discussion
MAS is the most widely used rating scale for assessment spasticity in the clinical environment.
MAS is easy and speedy to use, but it cannot reflect
slight changes of spasticity because of big gap
between grades
15), and it is not very reliable for
assessment spasticity
16). To overcome these weak
points of MAS, there have been several attempts to
assess spasticity quantitatively. Levin and Hui-Chan,
Table 7. Changes in FIM Values According to Treatment Period
Group Before Treatment After 3 weeks of Treatment
Immediately 1 week
EA Group 66.89 ± 25.89 79.42 ± 26.02 76.63 ± 24.37
P-value* (Pre-Post) 0.001 0.045
Control Group 51.70 ± 33.23 54.40 ± 34.65 57.00 ± 35.46
P-value* (Pre-Post) 0.010 0.014
P-value† (Intergroup) 0.184 0.037 0.090
*: Wilcoxon signed rank test for immediately after 3 weeks of treatment in EA Group. Paired t-test for others.
†: Independent t-test
FIM, functional independence measure; EA, electroacupuncture
Goulet et al., Aydin et al., van der Salm et al. and Lee et al. used H-reflex for assessment spasticity
7,17-20)