Guidelines for Cardiovascular Magnetic Resonance Imaging from the Korean Society of Cardiovascular Imaging (KOSCI) - Part 2: Interpretation of Cine, Flow, and Angiography Data
Received: July 5, 2019 Revised: July 16, 2019 Accepted: July 17, 2019
*These authors contributed equally to this work.
This guideline has been published jointly with consent in the Cardiovascular Imaging Asia, Korean Journal of Radiology, and Investigative Magnetic Resonance Imaging.
Correspondence to:
Dong Hyun Yang, M.D.
Department of Radiology, University of Ulsan College of Medicine, Asan Medical Center, 88, Olympic-ro 43-gil, Songpa- gu, Seoul 05505, Korea.
Tel. +82-2-3010-5820 Fax. +82-2-2045-4127
E-mail: donghyun.yang@gmail.com Bae Young Lee, M.D.
Department of Radiology, Eunpyeong St. Mary's Hospital, College of Medicine, The Catholic University of Korea, 1021, Tongil-ro, Eunpyeong-gu, Seoul 03312, Korea.
Tel. +82-2-958-2084 Fax. +82-2-960-4568 E-mail: leebae@catholic.ac.kr
Review Article
Cardiovascular magnetic resonance imaging (CMR) is expected to be increasingly used in Korea due to technology advances and the expanded national insurance coverage of these tests. For improved patient care, it is crucial not only that CMR images are properly acquired but that they are accurately interpreted by well- trained personnel. In response to the increased demand for CMR, the Korean Society of Cardiovascular Imaging (KOSCI) has issued interpretation guidelines in conjunction with the Korean Society of Radiology (KSR). KOSCI has also created a formal Committee on CMR Guidelines to write updated practices. The members of this Committee review previously published interpretation guidelines and discuss the patterns of CMR use in Korea.
Keywords: Guideline; Heart; Magnetic resonance imaging; Image interpretation;
Image analysis
This is an Open Access article distributed under the terms of the Creative Commons Attribution Non-Commercial License (http://creativecommons.org/licenses/
by-nc/4.0/) which permits unrestricted non-commercial use, distribution, and reproduction in any medium, provided the original work is properly cited.
Copyright © 2019 Korean Society of Magnetic Resonance in Medicine (KSMRM)
Jae Wook Lee1*, Jee Hye Hur2*, Dong Hyun Yang3, Bae Young Lee4, Dong Jin Im5, Su Jin Hong6, Eun Young Kim3, Eun-Ah Park7, Yeseul Jo8, Jeong Jae Kim9, Chul Hwan Park10, Hwan Seok Yong11
1Department of Radiology, Soonchunhyang University Hospital Bucheon, Bucheon, Korea
2Department of Radiology, Hanil General Hospital, Seoul, Korea
3Department of Radiology and Research Institute of Radiology, University of Ulsan College of Medicine, Seoul, Korea
4Department of Radiology, Eunpyeong St. Mary's Hospital, College of Medicine, The Catholic University of Korea, Seoul, Korea
5Department of Radiology, Research Institute of Radiological Science, Severance Hospital, Yonsei University College of Medicine, Seoul, Korea
6Department of Radiology, Hanyang University Guri Hospital, Hanyang University College of Medicine, Guri, Korea
7Department of Radiology, Seoul National University Hospital, Seoul, Korea
8Department of Radiology, Incheon St. Mary's Hospital, College of Medicine, The Catholic University of Korea, Incheon, Korea
9Department of Radiology, Jeju National University Hospital, Jeju, Korea
10Department of Radiology, Gangnam Severance Hospital, Yonsei University College of Medicine, Seoul, Korea
11Department of Radiology, Korea University Guro Hospital, Seoul, Korea
INTRODUCTION
Cardiovascular magnetic resonance imaging (CMR) is expected to be increasingly used in Korea due to the development of its underlying technology and the expansion of the national insurance system to cover these tests. To define the proper indications for cardiac imaging in clinical practice, the Korean Society of Cardiovascular Imaging (KOSCI) and the Korean Society of Cardiology (KSC) jointly published appropriate use criteria of CMR and cardiac computed tomography (CT), and Asian Society of Cardiovascular Imaging (ASCI) also published multimodality appropriate use criteria for noninvasive cardiac imaging (1- 3). For CMR to effectively improve patient care, it is crucial to not only acquire the images properly but also to ensure that these results are accurately interpreted by well-trained personnel. In response to an increased demand for the use of CMR, KOSCI released CMR interpretation guidelines in conjunction with the Korean Society of Radiology (KSR) and established a Committee on CMR Guidelines. The members of this Committee meet to review previously published interpretation guidelines and discuss the patterns of CMR use in Korea. In addition, the Committee surveys cardiologists and cardiac surgeons at academic hospitals who utilize CMR in their clinical practice. The purpose of these surveys is to investigate the results these clinicians are seeking to get from a CMR test in each clinical scenario.
These interpretation guidelines devised by KOSCI are divided into two parts: 'anatomy and cardiac function' and 'myocardial tissue characterization'. The anatomy and cardiac function section includes cine magnetic resonance imaging (MRI), flow imaging, and angiography. Cine MRI has been known as a gold standard for ventricular functional analysis and, with recent advances in MRI and CT, studies comparable to cine MRI have been reported (4- 6). In addition, studies have been carried out to estimate the prognosis of the disease by measuring myocardial strain using cine MRI, and to evaluate the left atrial volume in patients with atrial fibrillation using 3-dimentional CMR (7-9). The myocardial tissue characterization section includes perfusion, delayed enhancement, and T1 and T2 mapping. Recently, many articles on myocardial tissue characterization and quantification have been published (10-14). These CMR guidelines cover cardiovascular diseases that occur mainly in adults and grown-up congenital heart disease. Each module of the guidelines describes the visual and quantitative assessments separately. Although not all modules require quantitative assessment (e.g., perfusion
MR), this is sometimes necessary, as in the case of T1 and T2 mapping. Each assessment method is divided into ‘What- to-see’, ‘How-to’, and ‘Pitfalls’. For a typical indication of CMR (e.g., ischemic heart disease, cardiomyopathy, postoperative tetralogy of Fallot [TOF]), a sample report with representative images is also presented so that even a novice reader can refer to it in their clinical practice. These guidelines reflect the consensus of committee members who participated in their writing and are therefore not absolute. We believe that they can be used appropriately in accordance with each hospital situation and clinical scenario. More rare and specific indications such as coronary angiography or complex congenital heart disease were not included in these guidelines. The guidelines will be necessarily updated as CMR technology continues to evolve and the analysis software advances. It is hoped that they will help to standardize CMR interpretation in the future and improve the quality of care for cardiac patients.
LEFT VENTRICULAR FUNCTIONAL ASSESSMENT
Visual Assessment I. What-to-see
1. Anatomy of the left ventricle (LV), left ventricular outflow tract (LVOT), and aortic root can be evaluated using cine images.
2. Global and segmental motion of the left ventricle can be assessed.
3. Hemodynamic information such as shunt flow, valvular stenosis or regurgitation, flow acceleration at LVOT, and evidence of constrictive physiology may be assessed.
II. How-to
1. Check all cine images, validate using different planes, and evaluate the presence of artifacts.
2. LV function is evaluated in terms of global and segmental aspects and segmental wall motion is evaluated based on the segmental wall thickness at systole. The evaluation uses the standard LV segmentation nomenclature (15) (Fig. 1). Wall motion is classified as hyperkinetic, normokinetic, hypokinetic, akinetic, or dyskinetic (16).
Quantitative Assessment I. What-to-see
1. Measured LV parameters as follows: end-diastolic (ED) volume, end-systolic (ES) volume, ejection fraction (EF), stroke volume (SV), cardiac output (CO) and LV mass of both measured and body surface area (BSA)-indexed values.
II. How-to 1. General
A. Evaluate the stack of short-axis cine using computer- aided analysis software.
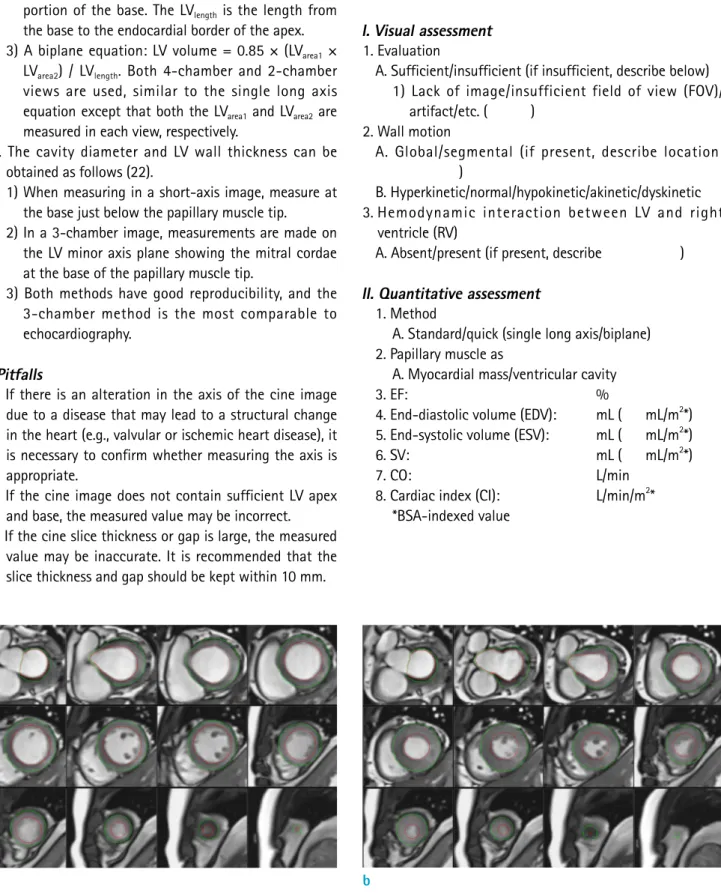
B. Acquire contours of endocardial and epicardial borders at both the ED and ES phases (Fig. 2).
C. If a chemical shift artifact occurs, the epicardial border is drawn in the middle of the chemical shift artifact line (17).
D. LV ED and ES images acquired at the largest and the smallest LV blood volume, respectively.
E. The reader must check the appropriateness of
automatic contour delineation (when used).
2. LV volumes
A. Papillary muscles should be included with the myocardium. However, some evaluation tools do not draw its contour, but rather recognize it as a chamber volume. Inclusion or exclusion of papillary muscles should be mentioned (18, 19).
B. LVOT should be included as the part of LV blood volume. The drawing contour should be included in the outflow tract to the level of the aortic valve cusps.
C. Because of the tendency of the mitral valve to apex in the systole phase (the so-called basal descent), assessing the basal slice requires caution in the evaluation. If the blood volume surrounded by myocardium in the basal slice is less than 50%, this space is considered to be the left atrial cavity. Some evaluation tools automatically check the systolic atrioventricular ring descent.
3. LV mass
A. Calculation: (Total epicardial volume - total endocardial volume) × specific density of myocardium (1.05 g/ml) (17).
B. Papillary muscles are myocardial tissue and should be included, particularly in cases of myocardial hypertrophy. The inclusion or exclusion of papillary muscles should be mentioned (18).
C. Base and apex: Most basal slice contains a small crescent of basal lateral myocardium without ventricular blood volume, and this myocardium should be included in the LV mass. Also, most apical slices may contain myocardium without a blood cavity, and the epicardial contour should be taken for LV mass evaluation.
4. Quick assessment
A. In the absence of significant regional variations, a quick calculation can be performed without the use of analysis software.
B. A rotational long axis view (e.g., 2-chamber and 4-chamber views) allows for faster evaluation and is not limited by basal descent. The assessment technique should be mentioned in the report.
C. Calculation
1) In general, two calculation formulas are used (20, 21) as indicated below.
2) A single long axis equation: LV volume = 0.85 × (LVarea)2 / LVlength. This is performed using a 4-chamber view. The calculation requires both ED and ES phases. The LVarea is a straight line connecting the Fig. 1. American Heart Association 17-segment model of
the LV myocardium. LV = left ventricle
endocardial contour of the medial and lateral portion of the base. The LVlength is the length from the base to the endocardial border of the apex.
3) A biplane equation: LV volume = 0.85 × (LVarea1 × LVarea2) / LVlength. Both 4-chamber and 2-chamber views are used, similar to the single long axis equation except that both the LVarea1 and LVarea2 are measured in each view, respectively.
D. The cavity diameter and LV wall thickness can be obtained as follows (22).
1) When measuring in a short-axis image, measure at the base just below the papillary muscle tip.
2) In a 3-chamber image, measurements are made on the LV minor axis plane showing the mitral cordae at the base of the papillary muscle tip.
3) Both methods have good reproducibility, and the 3-chamber method is the most comparable to echocardiography.
III. Pitfalls
1. If there is an alteration in the axis of the cine image due to a disease that may lead to a structural change in the heart (e.g., valvular or ischemic heart disease), it is necessary to confirm whether measuring the axis is appropriate.
2. If the cine image does not contain sufficient LV apex and base, the measured value may be incorrect.
3. If the cine slice thickness or gap is large, the measured value may be inaccurate. It is recommended that the slice thickness and gap should be kept within 10 mm.
Reporting
I. Visual assessment 1. Evaluation
A. Sufficient/insufficient (if insufficient, describe below) 1) Lack of image/insufficient field of view (FOV)/
artifact/etc. ( ) 2. Wall motion
A. Global/segmental (if present, describe location:
)
B. Hyperkinetic/normal/hypokinetic/akinetic/dyskinetic 3. Hemodynamic interaction between LV and right
ventricle (RV)
A. Absent/present (if present, describe ) II. Quantitative assessment
1. Method
A. Standard/quick (single long axis/biplane) 2. Papillary muscle as
A. Myocardial mass/ventricular cavity
3. EF: %
4. End-diastolic volume (EDV): mL ( mL/m2*) 5. End-systolic volume (ESV): mL ( mL/m2*)
6. SV: mL ( mL/m2*)
7. CO: L/min
8. Cardiac index (CI): L/min/m2*
*BSA-indexed value
Fig. 2. LV quantitative assessment. For LV quantitative assessment, stack of short-axis slices containing entire LV is required, and endocardial (red) and epicardial (green) contours should be drawn in both diastole (a) and systole (b) phases. Inclusion or exclusion of papillary muscles should be mentioned. Note that papillary muscles are excluded in this example.
a b
RIGHT VENTRICULAR FUNCTIONAL ASSESSMENT
Visual Assessment I. What-to-see
1. Evaluate the anatomy of the RV, right ventricular outflow tract (RVOT), global or regional wall motion, and wall thickness (17).
2. Check for shunt flow, valvular stenosis or regurgitation.
3. Hemodynamic interactions between the LV and RV (e.g., constrictive physiology) may also be assessed.
II. How-to
1. Identify all cine images and determine whether the axis is distorted by using two different planes and whether the ventricle that you want to evaluate contains enough from the apex to the base at systole and diastole. Check if artifact exists.
2. Wall assessment
A. Evaluate global or regional wall motions and classify them as normokinetic, hypokinetic, or dyskinetic.
B. If regional wall motion abnormality is observed, mention whether the location is infundibulum, body, or apex.
C. Measure the wall thickness at the atrial middle portion of the RV free wall in the ED phase (optional).
Quantitative Assessment I. What-to-see
1. Evaluate ED volume, ES volume, EF, and SV of RV of both measured and BSA-indexed values (23).
II. How-to
1. Assess the contiguous stack of short-axis or transaxial cine using analysis software (Figs. 3, 4). Transaxial cine is the best plane to identify the tricuspid valve plane and is good for reproducibility. However, in clinical practice, the LV as well as RV are often assessed together and often evaluated by the short axis, known as the best plane of LV assessment (24, 25).
2. For accurate quantification, it is important to choose the ED and ES phase appropriately. Select the ED and ES phases when the RV size is the largest and smallest, respectively. This may be different from the ED and ES phases of the LV.
3. When contouring the endocardial border, draw the inner boundary of the RVOT well and make it possible to include the pulmonary valve directly underneath.
When contouring the basal slice, use at least two different planes to ensure that the RV cavity is well contained. Trabeculae and papillary muscles are commonly included in the RV cavity, which contributes to reproducibility. This is different from the LV assessment method (17).
4. In general, the RV mass is rarely evaluated, so the epicardial border is usually not drawn.
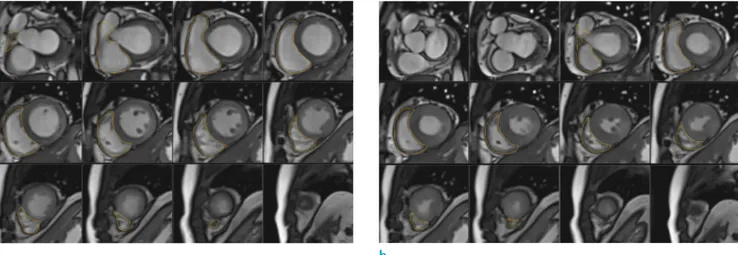
Fig. 3. RV quantitative assessment with short axis cine. For RV quantitative assessment, a stack of short axis slices containing the entire RV is required and an endocardial contour should be drawn in both the diastole (a) and systole (b) phases. Generally, the epicardial border is not drawn. RV = right ventricle
a b
5. LV assessment values can be used to validate the measured values, and if there is no intracardiac or extracardiac shunt, the LV and RV stroke volumes are approximately the same.
III. Pitfalls
1. It is difficult to grasp the endocardial border around the RVOT and the pulmonary valve in both the transaxial and short-axis cine, and it takes time to become skilled at doing this.
2. It is difficult to distinguish whether the space seen in the basal slice of the short-axis cine is the RV or right atrium, which leads to a decrease in reproducibility.
Therefore, it is recommended to refer to other planes together (Fig. 5).
3. When there is a disease that can cause structural alteration to the RV (e.g., tricuspid regurgitation or pulmonary hypertension), the LV and RV axes are different from each other, and accurate assessment may be difficult with a short-axis cine. In this case, it is better to use the transaxial plane or to get the short- axis cine for the RV axis again.
Reporting
I. Visual assessment 1. Evaluation
A. Sufficient/insufficient (if insufficient, describe below) 1) Lack of image/insufficient FOV/artifact/etc. ( )
2. Wall motion
A. Global/septal/free wall (if present, describe location:
)
B. Normal/hypokinetic/dyskinetic
3. Hemodynamic interaction between the RV and LV A. Present/absent
4. Wall thickness (optional) A. Normal/thickened 5. RV dilatation (optional)
A. Present/absent
II. Quantitative assessment 1. Method
A. Short-axis/transaxial
2. RV EF: %
3. RV EDV: mL ( mL/m2*) 4. RV ESV: mL ( mL/m2*) 5. RV SV: mL ( mL/m2*) 6. RV CO: L/min
7. RV CI: L/min/m2*
*BSA-indexed value
FLOW IMAGING
Visual Assessment I. What-to-see
1. Blood flow directions in relation to cardiovascular anatomy.
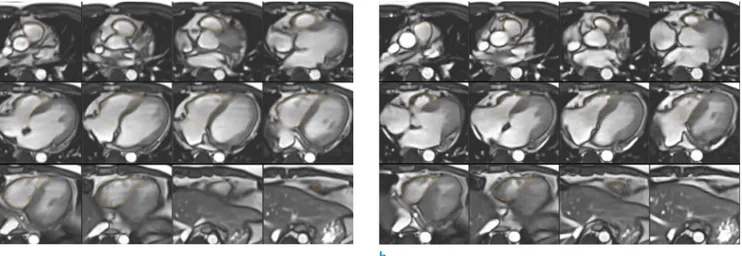
Fig. 4. RV quantitative assessment with transaxial cine. Draw the endocardial contour in both the diastole (a) and systole (b) phases in the same way as for short axis evaluation. The transaxial cine is the best plane to identify the tricuspid valve plane and is good for reproducibility.
a b
2. Accelerated flow jets associated with stenosis, valvular regurgitation, or shunting.
II. How-to
1. Display both magnitude and velocity map side-by-side using a stack or cine mode. If possible, also display the corresponding cine images (gradient echo or SSFP).
2. Check in- or through-plane acquisitions of the velocity map.
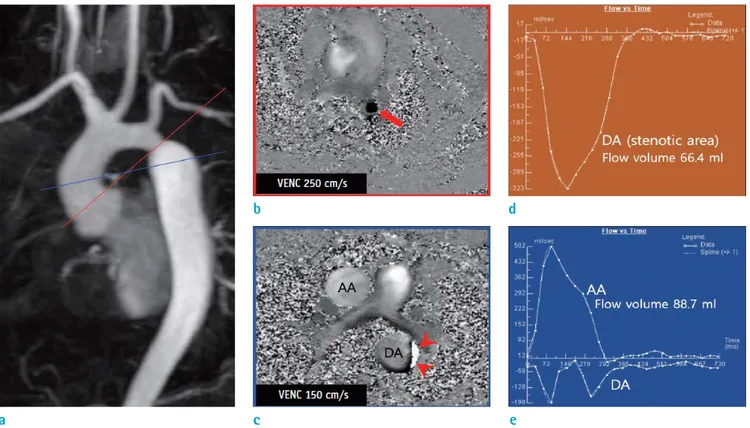
3. The direction, dimensions and time courses of flow can provide useful information regarding disease etiology (e.g., abnormal flow jet in coarctation of the aorta [Fig.
6], valvular regurgitation, or intracardiac shunt) (26, 27).
III. Pitfalls
1. The flow jet may not be visualized if the velocity encoding (VENC) is set too high.
2. A mosaic pattern on the image may be seen if the
VENC is set too low (28).
3. The TE should be set as low as possible (3.5 ms or lower) for increased accuracy (29).
Quantitative Assessment I. What-to-see
1. Directly measures the direction, volume, and velocity of blood flow in the blood vessel or heart.
2. There are two kinds of parameters: directly calculated and secondarily derived.
3. Directly calculated parameters include forward volume, reverse volume, and velocity (mean or peak)
4. Derived parameters (17) are as follows:
A. Net volume (ml) = forward volume - reverse volume B. Regurgitant fraction (%) = (reverse volume / forward
volume) × 100
5. In congenital heart disease or valve disease, hemody- namic information can be obtained using various flow
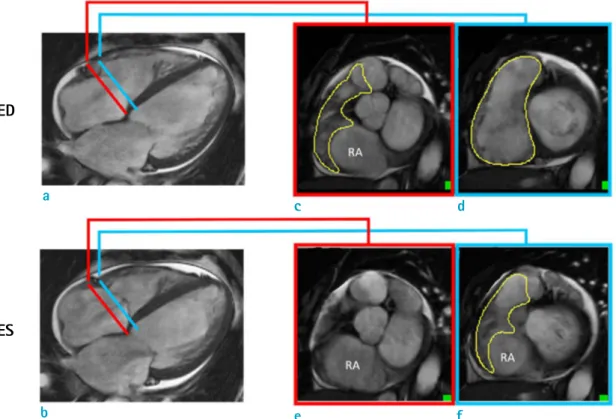
Fig. 5. Pitfall of RV short-axis evaluation: use different planes together. Short-axis evaluation of RV requires extra care in basal slice contouring, and it is helpful to use different planes together. Most basal slice (red line) is selected using 4-chamber cine images (a, b), and endocardial contour is drawn in ED and ES phases. In ES phase, since valvular plane moves to apex (basal descent), endocardial contour that can be drawn in ED phase (c) may not be drawn in ES phase (e) at most basal slice. In addition, there may be different endocardial contour along valvular plane between ED (d) and ES phases (f).
ED = end-diastolic; ES = endsystolic; RA = right atrium ED
ES a
b
c
e
d
f
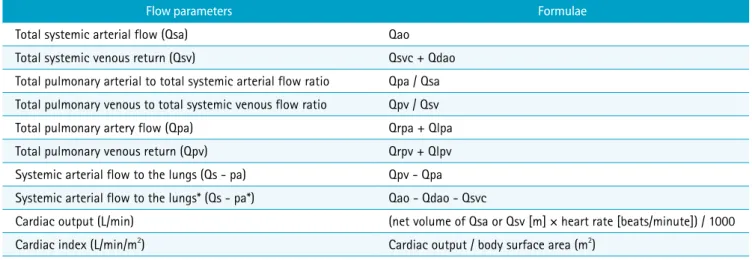
parameters as follows (Table 1).
II. How-to
1. Display both magnitude and velocity maps side-by-side using a stack or cine mode.
2. Make sure there are no aliasing artifacts (i.e. the VENC was too low) and not a low contrast image (i.e. the VENC was too high) (17).
3. Draw a line along the boundary of the blood vessel or heart structure to be measured on each phase or magnitude image along whole cardiac phases. Make sure that the noise outside the vessels or heart is not included.
4. Baseline-correction could be applied in the software or using a phantom (30, 31).
III. Pitfalls
1. Generally, the area of flow may be slightly larger than that drawn in the magnitude images
2. When reporting peak velocities, keep in mind some
pitfalls. First, the software package may have a different method of calculating the peak velocity (measuring one-pixel value vs. averaging several adjacent pixels). Second, if the imaging plane does not properly include the vena contracta, flow imaging will not reflect the true peak velocity. Third, the peak velocity from flow imaging can be underestimated, particularly at a lower spatial resolution.
MR ANGIOGRAPHY
Visual and Quantitative Assessments I. What-to-see
1. Thoracic aorta: Aortic dimension, aortic wall irregularities, aortic wall thickness
2. Pulmonary artery: Pulmonary arterial dimension, thrombi, wall irregularity
3. Coronary artery: Degree of stenosis, origin or course of a
Fig. 6. Case of 31-year-old man with coarctation of aorta. (a) Contrast-enhanced MR angiography showing coarctation of aorta at isthmic portion of aorta. (b) Velocity map crossing stenotic lesion showing flow acceleration (arrow) at coarctation site. (c) Velocity map at level of AA. Because of low VENC value of 150 cm/s, aliasing artifact (arrowheads) occurred along wall of DA, just at distal portion of coarctation site. (d, e) Time-flow volume curve maps showing change in flow volume along cardiac cycle. AA = ascending aorta; DA = descending aorta; VENC = velocity encoding
b d
c e
III. Pitfall
1. When measuring the sinus or sinotubular junction level of the aorta, electrocardiography-gating can be used to avoid under- or over-estimation (17).
SAMPLE REPORT
This following sample report was drawn from the consensus of members of the committee on CMR guidelines regarding diseases that are often indications for undertaking a CMR in clinical practice. This sample report is not a set of guidelines to be followed by CMR practitioners.
The authors intend to provide an example of items included in the imaging protocol and report for each disease. This sample report can be modified and adapted to each hospital and clinical situation.
Postoperative Tetralogy of Fallot
History: Total correction state of TOF in 2009
Body weight, 34.6 kg; height, 138.6 cm; BSA, 1.15 m2. Imaging protocols:
Scout, cine MRI (4-chamber, 2-chamber, 3-chamber, and short-axis); flow image (ascending aorta, descending aorta, superior vena cava, right pulmonary artery [RPA], left pulmonary artery [LPA], and main pulmonary artery);
contrast-enhanced 3D MR angiography from the aortic arch to cardiac base; and delayed enhancement MRI (4-chamber, 2-chamber, 3-chamber, and short-axis) on a 1.5-T scanner.
the coronary artery II. How-to
1. Review multiplanar reformation (MPR), maximum intensity projection and volume-rendering images.
2. Thoracic aorta
A. The widest diameter is measured using a double- oblique MPR image perpendicular to the blood flow and measured at the standardized level (32, 33).
B. Measurements should preferably be done in the diastole phase.
C. Describe wall irregularities, if present.
D. Comparison between non-contrast and contrast- enhanced MR angiography is useful for evaluating vessel wall thickening or intramural thrombosis (34).
3. Pulmonary artery and vein
A. Measure the widest diameter perpendicular to the direction of blood flow.
B. The pulmonary artery should be measured at the level of pulmonary bifurcation in the transaxial plane (17, 35, 36).
4. Coronary artery
A. Describe anomalous origin or course of the coronary artery, if present.
B. Stenosis extent: coronary artery stenosis of more than 50% is described as significant, and of less than 50% as insignificant (37).
Table 1. List of Potentially Useful Flow Parameters Derived from Flow Imaging in Congenital Heart Disease or Valvular Heart Disease
Flow parameters Formulae
Total systemic arterial flow (Qsa) Qao
Total systemic venous return (Qsv) Qsvc + Qdao
Total pulmonary arterial to total systemic arterial flow ratio Qpa / Qsa Total pulmonary venous to total systemic venous flow ratio Qpv / Qsv
Total pulmonary artery flow (Qpa) Qrpa + Qlpa
Total pulmonary venous return (Qpv) Qrpv + Qlpv
Systemic arterial flow to the lungs (Qs - pa) Qpv - Qpa Systemic arterial flow to the lungs* (Qs - pa*) Qao - Qdao - Qsvc
Cardiac output (L/min) (net volume of Qsa or Qsv [m] × heart rate [beats/minute]) / 1000
Cardiac index (L/min/m2) Cardiac output / body surface area (m2)
*Alternative formulae for the same flow measurements.
Qao = total aortic flow; Qdao = descending aortic flow; Qlpa = left pulmonary arterial flow; Qlpv = left pulmonary venous return; Qpa = total pulmonary arterial flow;
Qpv = total pulmonary venous return; Qrpa = right pulmonary arterial flow; Qrpv = right pulmonary venous return; Qsa = total systemic arterial flow; Qsv = total systemic venous return; Qsvc = superior venous cava flow
I. Imaging findings (Fig. 7)
1. Morphological evaluation of cine MRI, MR angiography, and delayed enhancement
A. Status post total correction of TOF
B. Unobstructed pulmonary arteries and aorta
C. No evidence of obstruction or aneurysm in the RVOT D. Normal origin of coronary artery
E. Small patchy delayed enhancement in the junction of the RV and LV
2. Ventricular function on cine MRI A. LV quantitative assessment
1) Papillary muscle as ventricular cavity
2) EF, 48.9%; EDV, 75.3 ml (65 ml/m2*); ESV, 38.4 ml (33 ml/m2*); SV, 36.8 ml
*BSA-indexed value B. RV quantitative assessment
1) Short-axis method
2) RV EF, 37.7%; EDV, 131.3 ml (114 ml/m2*); ESV, 81.8 ml (71 ml/m2*); SV, 49.5 ml
*BSA-indexed value
3. Flow quantification on flow MRI
A. Flow volume: Ascending aorta, 34.0 ml; superior vena cava, 18.3 ml; descending aorta, 16.3 ml B. RPA, 22.3 ml (net volume); regurgitant fraction,
33.2%
C. LPA, 13.0 ml (net volume); regurgitant fraction, 46.7%
D. Main pulmonary artery, 33.3 ml (net volume);
regurgitant fraction, 44.2%
E. RPA + LPA, 35.3 ml
F. Percentage of flow to the RPA and LPA ___ RPA:LPA
= 63%:37%
Conflicts of Interest Statement and Funding
This work was supported by the Guideline Development Fund of the Korean Society of Radiology and Korean Society of Cardiovascular Imaging.
REFERENCES
1. Yoon YE, Hong YJ, Kim HK, et al. 2014 Korean guidelines for appropriate utilization of cardiovascular magnetic resonance imaging: a joint report of the Korean Society of Cardiology and the Korean Society of Radiology. Korean Circ J 2014;44:359-385
2. Kim YJ, Yong HS, Kim SM, et al. Korean guidelines for the appropriate use of cardiac CT. Korean J Radiol 2015;16:251-285
3. ASCI Practice Guideline Working Group, Beck KS, Kim JA, et al. 2017 multimodality appropriate use criteria for noninvasive cardiac imaging: expert consensus of the Asian Society of Cardiovascular Imaging. Korean J Radiol 2017;18:871-880
4. Goo HW. Comparison between three-dimensional navigator-gated whole-heart MRI and two-dimensional cine MRI in quantifying ventricular volumes. Korean J Radiol 2018;19:704-714
5. Cui C, Yin G, Lu M, et al. Retrospective electrocardiography- gated real-time cardiac cine MRI at 3T: comparison with conventional segmented cine MRI. Korean J Radiol 2019;20:114-125
6. Goo HW. Semiautomatic three-dimensional threshold- based cardiac computed tomography ventricular volumetry in repaired tetralogy of Fallot: comparison with cardiac magnetic resonance imaging. Korean J Radiol 2019;20:102- 113
7. Lee JW, Jeong YJ, Lee G, et al. Predictive value of cardiac magnetic resonance imaging-derived myocardial strain for Fig. 7. Images for the post-operative tetralogy of Fallot
sample report.
poor outcomes in patients with acute myocarditis. Korean J Radiol 2017;18:643-654
8. Pizzino F, Recupero A, Pugliatti P, Maffei S, Di Bella G. Re:
multi-parameter CMR approach in acute myocarditis to improve diagnosis and prognostic stratification. Korean J Radiol 2018;19:366-367
9. Lee HG, Shim J, Choi JI, Kim YH, Oh YW, Hwang SH. Use of cardiac computed tomography and magnetic resonance imaging in case management of atrial fibrillation with catheter ablation. Korean J Radiol 2019;20:695-708 10. Min JY, Ko SM, Song IY, Yi JG, Hwang HK, Shin JK.
Comparison of the diagnostic accuracies of 1.5T and 3T stress myocardial perfusion cardiovascular magnetic resonance for detecting significant coronary artery disease.
Korean J Radiol 2018;19:1007-1020
11. Lim J, Park EA, Song YS, Lee W. Single-dose gadoterate meglumine for 3T late gadolinium enhancement MRI for the assessment of chronic myocardial infarction: intra- individual comparison with conventional double-dose 1.5T MRI. Korean J Radiol 2018;19:372-380
12. Wang L, Chen Y, Zhang B, et al. Self-gated late gadolinium enhancement at 7T to image rats with reperfused acute myocardial infarction. Korean J Radiol 2018;19:247-255 13. Chen Y, Zheng X, Jin H, et al. Role of myocardial
extracellular volume fraction measured with magnetic resonance imaging in the prediction of left ventricular functional outcome after revascularization of chronic total occlusion of coronary arteries. Korean J Radiol 2019;20:83- 93
14. Karimi S, Pourmehdi M, Naderi M. Re: prediction of the left ventricular functional outcome by myocardial extracellular volume fraction measured using magnetic resonance imaging: methodological issue. Korean J Radiol 2019;20:
1001-1002
15. Cerqueira MD, Weissman NJ, Dilsizian V, et al.
Standardized myocardial segmentation and nomenclature for tomographic imaging of the heart. A statement for healthcare professionals from the Cardiac Imaging Committee of the Council on Clinical Cardiology of the American Heart Association. Circulation 2002;105:539-542 16. Hundley WG, Bluemke D, Bogaert JG, et al. Society
for Cardiovascular Magnetic Resonance guidelines for reporting cardiovascular magnetic resonance examinations.
J Cardiovasc Magn Reson 2009;11:5
17. Schulz-Menger J, Bluemke DA, Bremerich J, et al.
Standardized image interpretation and post processing in cardiovascular magnetic resonance: Society for Cardiovascular Magnetic Resonance (SCMR) board of trustees task force on standardized post processing. J Cardiovasc Magn Reson 2013;15:35
18. Maceira AM, Prasad SK, Khan M, Pennell DJ. Normalized left ventricular systolic and diastolic function by steady state free precession cardiovascular magnetic resonance. J Cardiovasc Magn Reson 2006;8:417-426
19. Hudsmith LE, Petersen SE, Francis JM, Robson MD, Neubauer S. Normal human left and right ventricular and left atrial dimensions using steady state free precession magnetic resonance imaging. J Cardiovasc Magn Reson 2005;7:775-782
20. Hamdan A, Kelle S, Schnackenburg B, Fleck E, Nagel E.
Improved quantitative assessment of left ventricular volumes using TGrE approach after application of extracellular contrast agent at 3 Tesla. J Cardiovasc Magn Reson 2007;9:845-853
21. Thiele H, Paetsch I, Schnackenburg B, et al. Improved accuracy of quantitative assessment of left ventricular volume and ejection fraction by geometric models with steady-state free precession. J Cardiovasc Magn Reson 2002;4:327-339
22. Puntmann VO, Gebker R, Duckett S, et al. Left ventricular chamber dimensions and wall thickness by cardiovascular magnetic resonance: comparison with transthoracic echocardiography. Eur Heart J Cardiovasc Imaging 2013;14:240-246
23. Alfakih K, Plein S, Thiele H, Jones T, Ridgway JP, Sivananthan MU. Normal human left and right ventricular dimensions for MRI as assessed by turbo gradient echo and steady-state free precession imaging sequences. J Magn Reson Imaging 2003;17:323-329
24. Alfakih K, Plein S, Bloomer T, Jones T, Ridgway J, Sivananthan M. Comparison of right ventricular volume measurements between axial and short axis orientation using steady-state free precession magnetic resonance imaging. J Magn Reson Imaging 2003;18:25-32
25. Clarke CJ, Gurka MJ, Norton PT, Kramer CM, Hoyer AW.
Assessment of the accuracy and reproducibility of RV volume measurements by CMR in congenital heart disease.
JACC Cardiovasc Imaging 2012;5:28-37
26. Mohiaddin RH, Kilner PJ, Rees S, Longmore DB. Magnetic resonance volume flow and jet velocity mapping in aortic coarctation. J Am Coll Cardiol 1993;22:1515-1521
27. Mohiaddin RH, Pennell DJ. MR blood flow measurement.
Clinical application in the heart and circulation. Cardiol Clin 1998;16:161-187
28. Rebergen SA, van der Wall EE, Doornbos J, de Roos A.
Magnetic resonance measurement of velocity and flow:
technique, validation, and cardiovascular applications. Am Heart J 1993;126:1439-1456
29. O'Brien KR, Cowan BR, Jain M, Stewart RA, Kerr AJ, Young AA. MRI phase contrast velocity and flow errors
in turbulent stenotic jets. J Magn Reson Imaging 2008;28:210-218
30. Holland BJ, Printz BF, Lai WW. Baseline correction of phase-contrast images in congenital cardiovascular magnetic resonance. J Cardiovasc Magn Reson 2010;12:11 31. Chernobelsky A, Shubayev O, Comeau CR, Wolff SD.
Baseline correction of phase contrast images improves quantification of blood flow in the great vessels. J Cardiovasc Magn Reson 2007;9:681-685
32. Holloway BJ, Rosewarne D, Jones RG. Imaging of thoracic aortic disease. Br J Radiol 2011;84 Spec No 3:S338-354 33. Hiratzka LF, Bakris GL, Beckman JA, et al. 2010 ACCF/AHA/
AATS/ACR/ASA/SCA/SCAI/SIR/STS/SVM guidelines for the diagnosis and management of patients with thoracic aortic disease. A report of the American College of Cardiology Foundation/American Heart Association Task Force on Practice Guidelines, American Association for Thoracic Surgery, American College of Radiology, American Stroke Association, Society of Cardiovascular Anesthesiologists, Society for Cardiovascular Angiography and Interventions,
Society of Interventional Radiology, Society of Thoracic Surgeons, and Society for Vascular Medicine. J Am Coll Cardiol 2010;55:e27-e129
34. Glockner JF. MR angiography interpretation: techniques and pitfalls. Magn Reson Imaging Clin N Am 2005;13:23- 40
35. Kalb B, Sharma P, Tigges S, et al. MR imaging of pulmonary embolism: diagnostic accuracy of contrast-enhanced 3D MR pulmonary angiography, contrast-enhanced low- flip angle 3D GRE, and nonenhanced free-induction FISP sequences. Radiology 2012;263:271-278
36. Grosse-Wortmann L, Al-Otay A, Goo HW, et al. Anatomical and functional evaluation of pulmonary veins in children by magnetic resonance imaging. J Am Coll Cardiol 2007;49:993-1002
37. Sakuma H, Ichikawa Y, Chino S, Hirano T, Makino K, Takeda K. Detection of coronary artery stenosis with whole-heart coronary magnetic resonance angiography. J Am Coll Cardiol 2006;48:1946-1950