This is an Open Access article distributed under the terms of the Creative Commons Attribution Non-Commercial License (http://creativecommons.org/licenses/by-nc/3.0/) which permits unrestricted non-commercial use, distribution, and reproduction in any medium, provided the original work is properly cited.
© 2015 The Korean Society of Clinical Nutrition Clin Nutr Res 2015;4:46-55
http://dx.doi.org/10.7762/cnr.2015.4.1.46 pISSN 2287-3732 ∙ eISSN 2287-3740
*Corresponding author Hyungjung Lim
Address Department of Medical Nutrition, Graduate School of East- West Medical Science, Kyung Hee University, 1732 Deogyeongdaero, Giheung-gu, Yongin 446-701, Korea
Tel +82-31-201-2343 Fax +82-2-969-7717 E-mail [email protected]
†Corresponding author Ryowon Choue
Address Department of Medical Nutrition, Graduate School of East- West Medical Science, Kyung Hee University, 1732 Deogyeongdaero, Giheung-gu, Yongin 446-701, Korea
Tel +82-2-961-0769 E-mail [email protected]
Received January 2, 2015 Revised January 14, 2015 Accepted January 15, 2015
A Better Diet Quality is Attributable to Adequate Energy Intake in Hemodialysis Patients
Hyerang Kim
1,2,3, Hyunjung Lim
3,4*, Ryowon Choue
3,4†1Department of Family Medicine, Kangbuk Samsung Hospital, Sungkyunkwan University School of Medicine, Seoul 110-746, Korea
2Medical Research Center, Sungkyunkwan University School of Medicine, Suwon 440-746, Korea
3Department of Medical Nutrition, Graduate School of East-West Medical Science, Kyung Hee University, Yongin 447-701, Korea
4Research Institute of Medical Nutrition, Kyung Hee University, Seoul 130-701, Korea
Poor diet quality is one of strong predictors of subsequent increased mortality in hemodialysis patients. To determine diet qual- ity and to define major problems contributing to poor diet quality in hemodialysis patients, a cross-sectional study was con- ducted between June 2009 and October 2010. Sixty-three hemodialysis patients (31 men, 32 women; aged 55.3 ± 11.9 years) in stable condition were recruited from the Artificial Kidney Center in Kyung Hee University, Seoul, Korea. Three-day diet re- cords were obtained for dietary assessment. Mean adequacy ratio (MAR) is the average of the ratio of intakes to Dietary Refer- ence Intakes (DRI) for 12 nutrients. Index of nutritional quality (INQ) was determined as the nutritional density per 1,000 kcal of calories. Overall diet quality was evaluated using the Diet Quality Index-International (DQI-I). Statistics were used to determine diet quality, comparing dietary intake to DRI. Dietary calories (21.9 ± 6.7 kcal/kg/day) and protein (0.9 ± 0.3 g/kg/day) were found insufficient in the participants. The overall intake of 12 nutrients appeared to be also inadequate (0.66 ± 0.15), but INQs of overall nutrients, except for folate (0.6) and calcium (0.8), were found relatively adequate (INQ ≥ 1). As a result of diet qual- ity assessment using DQI-I, dietary imbalance and inadequacy were found to be the most problematic in hemodialysis patients.
This study suggests that the main reason for insufficient intake of essential nutrients is insufficient calorie intake. Hemodialysis patients should be encouraged to use various food sources to meet their energy requirements as well as satisfy overall balance and nutrient adequacy.
Key Word: Renal dialysis, Nutritive value, Nutrient adequacy ratio, Index of nutritional quality, Diet quality index-international
Introduction
Nutritional imbalance becomes more severe with the prog- ress of the disease in chronic renal disease due to decreased dietary intake while the need for adequate dieatry intake in- creases with increased nutrient losses and catabolism [1]. Up to 40 % of patients with renal failure have been known to be malnourished, which is associated with increased morbidity and mortality in this population. There are two major types of malnutrition in chronic renal failure [2]. One is associated with inflammation and atherosclerotic cardiovascular disease (MIA syndrome). The other one is diet-induced, which is related to low protein and energy intake. A type of malnutrition, which is so-called protein-energy malnutrition (PEM), affects functional changes in early stages. The signs of the malnutrition manifest laboratory and/or anthropometric changes as follows; re- duced total body mass (reduced lean body mass and fat mass, weight loss), low total body nitrogen, low concentrations of visceral proteins (serum albumin, pre-albumin, transferrin, and other visceral proteins), low alkali-soluble protein in muscle, as well as abnormal plasma amino acids and intracellular amino acid profiles [3,4]. PEM is also associated with the impaired im- mune response, leading an increase in susceptibility of severe or even fatal infectious complication, which has been linked to increased mortality in these populations [5]. In contrast to the former type of malnutrition, this type can be reversed with adequate nutritional support. Unless malnutrition is adequate- ly treated, the patient’s nutritional status will become more serious. In this context, it is not too excessive to say that suc- cess of dialysis therapy depends on adequate and appropriate nutritional management.
The National Kidney Foundation Kidney Disease Outcomes Quality Initiative (K/DOQI) Clinical Practice Guidelines for nu- trition in chronic renal failure suggest guidelines for dietary energy intake (DEI) and dietary protein intake (DPI) for hemo- dialysis patients [5]. Generally, the DEI has been recommended as 35 and 30-35 kcal/kg BW/day for patients younger than 60 years of age and older than 60 years of age, respectively. DPI has been recommended as 1.2 g/kg BW/day to prevent protein depletion and to maintain positive nitrogen balance. It has also been recommended that at least 50% of dietary protein should be of high biological value. Furthermore, well-balanced meals for adequate provision of various nutrients should be eaten.
However, previous studies have reported that the DEI and DPI in hemodialysis patients are frequently compromised to a
great degree [6-9]. The factors contributing to dietary insuf- ficiencies in this population is multifactorial, which includes dietary restriction for remedy, anorexia induced by uremic tox- icity, functional alterations in gastrointestinal system, fatigue, psychological problems and emotional stress. Kim et al. dem- onstrated lower intake of dietary calories (28.8 ± 5.82 kcal/
kg BW/day) in hemodialysis patients [10]. In the same study, hemodialysis patients consumed adequate amount of dietary protein (1.38 ± 0.41 g/kg BW/day) but the consumption of high biological value of protein (less than 30 % of recommended intake) did not meet the recommendation. In Kawakami et al.’s study, only 26% of the hemodialysis patients have been found to have an adequate amount of essential nutrient and the ratio of essential amino acid to total protein [11]. They emphasized well-balanced meals with adequate calorie intake on a daily basis to prevent malnutrition under hemodialysis, especially for those following low-protein diets. It has been reported that vitamin C, some carotenoids, potassium and dietary fibers are consumed less than the recommended amounts in hemodi- alysis patients compared with individuals not receiving dialysis [12]. Kalantar-Zadeh and their colleges discussed that one of the reason for inadequate intake of these nutrients might be potassium restricted diets which could lead to reduced fruit and vegetable intake. Some studies have also demonstrated that the nutritional status of hemodialysis patient is poor due to their limited food diversity, which was affected by changed food preferences and appetite [13-15]. Hemodialysis patients may have more monotonous diet patterns, which have them consuming lower dietary energy and protein, resulting in the deterioration associated with diet-induced malnutrition [16].
There is growing evidence, focused on the association be- tween dietary intake and nutritional status, supporting the hy- pothesis that nutritional inadequacies may predispose patients to an increase in mortality [3]. Therefore, prudential assess- ment of nutrient intake is vital to assure a patient’s current nu- tritional status. Assessment of diet quality is fundamental to evaluate nutrient adequacy and balance among the nutrients.
Although there are a number of studies that have investigated nutrient intakes of hemodialysis patients, there is lack of stud- ies evaluating diet quality using diet quality indices, such as mean adequacy ratio (MAR), index of nutritional quality (INQ), and diet quality index-international (DQI-I) in hemodialysis pa- tients.
In this current study, we aimed to highlight major problem- atic areas contributing to poor nutritional status by examining
diet quality, especially adequacy and balance, in hemodialysis patients. We conducted a cross-sectional study and assessed dietary intake and examined diet quality using validated diet quality indices, including the MAR and INQ score and DQI-I.
Materials and Methods
Subjects
Sixty-three subjects who received maintenance hemodi- alysis treatment three times a week for at least three months were recruited from the Artificial Kidney Center in Kyung Hee Medical Center (Seoul, Korea) from June 2009 to October 2010. They were in stable condition without hospitalization with any currently active systemic disease or acute infectious disease during three months prior to the study. Subjects with active cardiovascular disease, advanced liver or gastrointesti- nal diseases, malignancies under chemotherapy and/or radio- therapy, and any superimposed acute illness in the previous three months were excluded.
The subjects who participated in this study provided in- formed consent. The study was approved by the Institutional Review Board of Kyung Hee Medical Center (IRB No: KMC IRB 0908-03).
Data collection General information
The subjects’ general characteristics (gender, age, dialysis duration, and underlying and concomitant disease) were in- vestigated using constructive questionnaires. The experience of nutrition education (yes/no), difficulty in following dietary recommendations (yes/no) and self-evaluated diet compliance scoring (0-100 points) were also investigated. Self-reported appetite was evaluated with the Appetite and Diet Assessment Tool (ADAT) (very good/good/fair/poor/very poor) [17-19].
Evaluation of diet quality
Nutrient intakes. To determine day-to-day variation in nutrient intakes, three-day diet records (a dialysis day, a non- dialysis day, and a day of weekend) were obtained and verified through face-to-face interviews by a registered dietitian. The subjects were carefully instructed how to record the amounts of ingested foods and snacks by household measures and were how to take the measures of the utensils before starting food recording. The food items and the amounts of food in the diet records were ascertained again, and all food records
were analyzed by the same dietitian using the Computer Aided Nutritional Analysis Program version 3.0 (The Korean Nutrition Society, Korea). Dietary energy and protein were normalized to body weight to estimate adequacies of intake.
MAR and INQ. Twelve nutrients (protein, vitamin A, B6, and C, thiamin, riboflavin, niacin, folate, calcium, phosphorous, iron and zinc) were determined for nutrient adequacy ratio (NAR) estimation. The NAR was calculated as the actual intake of a nutrient divided by the recommended nutrient intake for hemodialysis patients, except for niacin, calcium and iron [5,20,21]. Because the recommended intakes for niacin, cal- cium and iron were not suggested for hemodialysis patients, the Dietary Reference Intakes for Koreans (KDRIs, 2005) for those nutrients were used to calculate the NAR [22]. The MAR was calculated as a measure of overall nutrient adequacy, whereas the MAR is the sum of each NAR divided by the number of nutrients [23]. To estimate the MAR, each value of the NAR was limited not to exceed 1.0, so that nutrients with a high NAR could not compensate for nutrients with a low NAR [24,25]. For both the NAR and MAR, a value of 1.0 indi- cates that the intake of nutrient is equal to the recommended intakes, and a MAR below 1.0 indicates lower than the recom- mended intake for one or more nutrients [26]. The INQ is one of nutritional quality indices based on the nutrient density of diets [27]. To determine an INQ value for each nutrient, the recommended intakes of each nutrient were converted into an allowance per 1,000 kcal. After that, the actual intake of each nutrient per 1,000 kcal of actual energy intake was divided by each recommended intake per 1,000 kcal.
DQI-I. The DQI-I was used for an overall measure of diet quality [28]. The DQI-I is composed of four major categories:
variety, adequacy, moderation, and overall balance. In variety section (0-20 points in total), overall food group variety (0- 15 points) and within-group variety for protein source (0-5 points) are evaluated. In adequacy section (0-40 point in total), adequacies for 3 major food group (vegetable, fruit, and grain) and 4 specific nutrients (fiber, protein, iron, calcium and vitamin C) are evaluated by scoring 0-5 points for each item. In moderation section (0-30 points in total), total fat, saturated fat, cholesterol, sodium, and empty calorie foods were included (0-6 points for each). In overall balance (0-10 points), macronutrient ratio (0-6 points) and fatty acid ratio (0-5 points) were calculated. The scores for each component are summarized in each of the four main categories, and the scores for all four categories are summed, resulting in a total
DQI-I score ranging from 0 to 100 (0 being the poorest and 100 being the highest possible score).
Statistical analysis
All of data were summarized using descriptive statistics with Microsoft Excel program and the SPSS program (Version 18.0, SPSS Inc., Chicago, IL, USA). The mean ± SD values are presented for continuous variables, and the counts and per- centages are presented for categorical variables.
Results
General characteristics
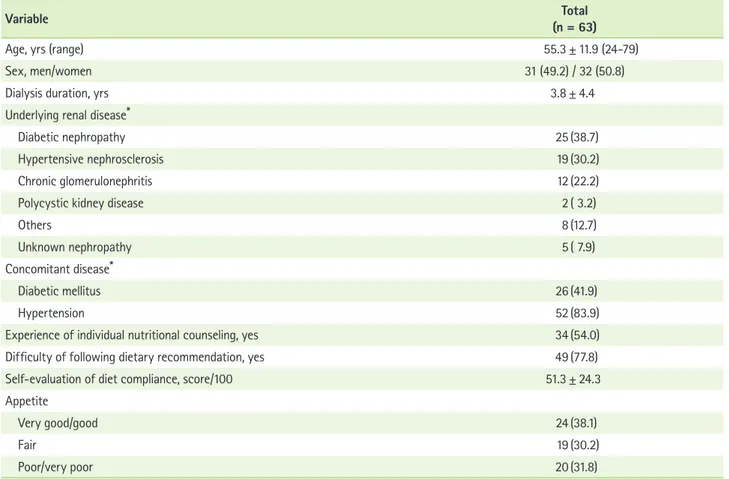
The general characteristics of the 63 hemodialysis subjects are shown in Table 1. The subjects’ mean age was 55.3 ± 11.9 years (range: 24-79). The duration of hemodialysis treatment was 3.8 ± 4.4 years. The most frequent underlying renal dis- eases were diabetic nephropathy (38.7%), hypertensive neph-
rosclerosis (30.2%), and chronic glomerulonephritis (22.2%).
The percentage of subjects who concomitantly had diabetes and hypertension were 41.9% and 83.9%, respectively.
Approximately half (54%) of the subjects had experience of individual nutritional counseling from a registered clinical dietitian after they started hemodialysis. However, all of the study participants answered to have an experience to take nutritional education as a group in the hospital. Approximately 78% reported that they felt difficulty following the dietary recommendation for hemodialysis patients. When they evalu- ated their diet compliance by themselves, they scored 51.3 ± 24.3 points out of a maximum score of 100. 38% of the sub- jects had a diet compliance score below 50 points (data not shown). In regards to self-reported appetite, 38.1%, 30.2%, and 31.8% of patients were have very good or good, fair, and poor or very poor appetite, respectively.
Table 1. General characteristics of the subjects
Variable Total
(n = 63)
Age, yrs (range) 55.3 ± 11.9 (24-79)
Sex, men/women 31 (49.2) / 32 (50.8)
Dialysis duration, yrs 3.8 ± 4.4
Underlying renal disease*
Diabetic nephropathy 25 (38.7)
Hypertensive nephrosclerosis 19 (30.2)
Chronic glomerulonephritis 12 (22.2)
Polycystic kidney disease 2 ( 3.2)
Others 8 (12.7)
Unknown nephropathy 5 ( 7.9)
Concomitant disease*
Diabetic mellitus 26 (41.9)
Hypertension 52 (83.9)
Experience of individual nutritional counseling, yes 34 (54.0)
Difficulty of following dietary recommendation, yes 49 (77.8)
Self-evaluation of diet compliance, score/100 51.3 ± 24.3
Appetite
Very good/good 24 (38.1)
Fair 19 (30.2)
Poor/very poor 20 (31.8)
Continuous variables were presented as mean ± SD (range) and categorical variables were presented as n(%).
*Subjects may have multiple underlying diseases.
Adequacy of DEI and DPI
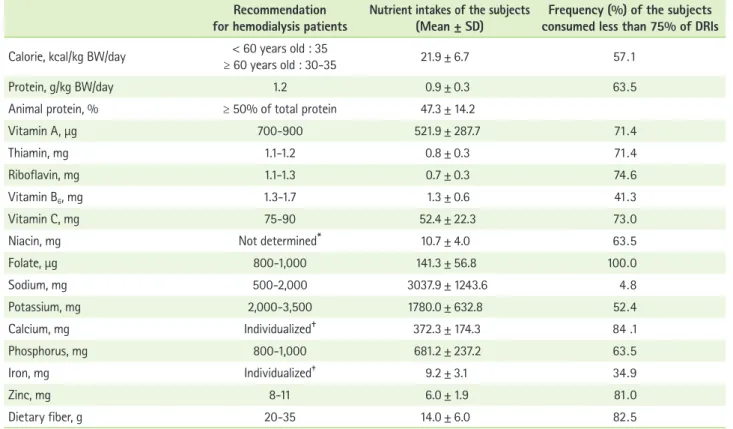
Table 2 represents the daily nutrient intakes of the subjects.
The mean values of the DEI and DPI were 21.9 ± 6.7 kcal/kg BW/day and 0.9 ± 0.3 g/kg BW/day, respectively. The subjects consumed 47.3% of the total protein intake in animal protein.
The dietary intakes of minerals, including potassium (1,780.0
± 632.8 mg/day), calcium (372.3 ± 174.3 mg/day), phosphorus (681.2 ± 237.2 mg/day), iron (9.2 ± 3.1 mg/day) and zinc (6.0
± 1.9 mg/day) appeared to be lower than the recommended levels. Sodium intake (3,037.9 ± 1,243.6 mg/day) was predomi- nantly higher compared with the recommended level.
Approximately sixty percent of the subjects consumed food such that their DEI and DPI was less than 75% of the dietary recommended intakes (DRIs) for hemodialysis patients (Table 2).
More than 50% of the subjects consumed vitamin A, thiamin, riboflavin, vitamin C, niacin, folate, potassium, calcium, zinc and dietary fiber at levels less than 75% of DRIs. The mean
intake of folate was especially lower than the recommended amount for hemodialysis patients. All of the subjects con- sumed folate at less than 75% of the DRI.
Figure 1 shows the NAR and INQ of 12 nutrients in the sub- jects. The mean values of NAR for any nutrient did not reach 1.0, indicating that these 12 nutrients were consumed less than the recommended amount. The overall nutrient adequacy present- ed by the MAR was 0.66 ± 0.15, which indicates that the sub- jects consumed only approximately 60% of the recommended intake level of nutrients in their diets (data not shown). Nutri- ent density, expressed in INQ, appeared to be approximately 1.0, which means that consumption of each nutrient per 1,000 kcal almost satisfied the individual requirements for each nutrient.
It can be postulated that the reduced overall nutrient intakes might be due to low calorie intakes. However, the INQ of folate (0.6 ± 0.2) and calcium (0.8 ± 0.5) still appeared to be signifi- cantly low, indicating that the amounts of folate and calcium Table 2. Daily nutrient intakes of the subjects and the frequency of the subjects who consumed energy and each nutrient less than 75% of recommendation
Recommendation
for hemodialysis patients Nutrient intakes of the subjects
(Mean ± SD) Frequency (%) of the subjects consumed less than 75% of DRIs Calorie, kcal/kg BW/day < 60 years old : 35
≥ 60 years old : 30-35 21.9 ± 6.7 57 . 1
Protein, g/kg BW/day 1.2 0.9 ± 0.3 63 . 5
Animal protein, % ≥ 50% of total protein 47.3 ± 14.2
Vitamin A, μg 700-900 521.9 ± 287.7 71 . 4
Thiamin, mg 1.1-1.2 0.8 ± 0.3 71 . 4
Riboflavin, mg 1.1-1.3 0.7 ± 0.3 74 . 6
Vitamin B6, mg 1.3-1.7 1.3 ± 0.6 41 . 3
Vitamin C, mg 75-90 52.4 ± 22.3 73 . 0
Niacin, mg Not determined* 10.7 ± 4.0 63 . 5
Folate, μg 800-1,000 141.3 ± 56.8 100 . 0
Sodium, mg 500-2,000 3037.9 ± 1243.6 4 . 8
Potassium, mg 2,000-3,500 1780.0 ± 632.8 52 . 4
Calcium, mg Individualized† 372.3 ± 174.3 84 .1
Phosphorus, mg 800-1,000 681.2 ± 237.2 63 . 5
Iron, mg Individualized‡ 9.2 ± 3.1 34 . 9
Zinc, mg 8-11 6.0 ± 1.9 81 . 0
Dietary fiber, g 20-35 14.0 ± 6.0 82 . 5
DRIs: dietary recommended intakes.
Note) Actual intake was compared to dietary recommendation for hemodialysis patients, except for niacin, calcium and iron. The recommended intakes for nia- cin, calcium and iron were not suggested for hemodialysis patients so that for KDRIs (The Korean Nutrition Society, 2005) were used as recommended intakes for these nutrients. The recommended intakes for niacin, calcium, and iron for healthy adult population are as follows.
*Niacin is 16 mg/day for men and 14 mg/day for women; †Calcium 700 mg/day is for men and 700-800 mg/day for women; ‡Iron is 10 mg/day for men and 14 mg/day (20-49 years) and 9 mg/day (over 50 years) for women.
intake per se were low, regardless of calorie intake.
Overall nutrient adequacy and balance
The DQI-I scores, which serve as an overall measure of diet quality, are shown in Table 3. Because a cut-off value for poor diet quality was not suggested, the percentage of the full score of each item was presented, and a value of less than 60% was considered relatively problematic for diet quality [28]. In variety, the mean score for the within-group variety for protein source was 2.7 ± 1.2 / 5, which did not reach 60%
of full score (54% of full score). The score of adequacy was 23.7 ± 4.5 / 40 (59% of full score). The most problematic sub- categories in adequacy were the adequacy of fruit group con- sumption at 1.4 ± 1.2 / 5 (28%) and calcium 1.9 ± 1.0 / 5 (38%).
The scores for adequacy of fiber (2.6 ± 1.0 / 5, 52% of full score) and vitamin C (2.6 ± 1.3 / 5, 52% of full score) also ap- peared to be lower than 60% of a full score. Interestingly, the protein adequacy score was closest to a full score (98%). The score of moderation was 22.9 ± 3.8 (76%), whereas the score of overall balance was only 2.8 ± 1.7 / 10 (28%), indicating the most problematic DQI-I area in these subjects.
Discussion
This study examined the major factors contributing to poor
nutritional status in hemodialysis patients by examining their diet quality using NAR, INQ, and DQI. We confirmed that he- modialysis patients had insufficient dietary intake in a consid- erable number of areas, including energy and protein as well as various essential nutrients. In addition, poor intake of overall nutrients was attributable to inadequate energy intake.
Many studies have reported that dietary intakes of energy and protein in hemodialysis patients were insufficient com- pared with the recommendations [12,29,30]. Similar to the previous studies, the intakes of energy (21.9 ± 6.7 kcal/kg BW/
day) and protein (0.9 ± 0.3 g/kg BW/day) were considerably low in this study [5].
One of the interesting findings of the current study is the discrepancy between the NAR and INQ, which are representa- tives of the adequacy and density for a specific nutrient, re- spectively. For example, the protein intake amounts were low;
however, the density of dietary protein per energy was almost close to the dietary recommendation. These results suggest that a low amount of PDI might be attributable to a reduced energy intake. This indicates that DPI can be ensured to be ad- equate if energy intake reaches the recommended level.
There is evidence that energy intake is more important than protein intake in determining the nutritional status in hemodialysis patients [6-9]. An insufficient energy intake, Figure 1. Nutrient adequacy ratio (NAR) and index of nutritional quality (INQ) of the subjects. NAR was calculated as the actual intake of each nutrient divided by the recommended intake of each nutrient. INQ was calculated as actual intake of each nutrient per 1,000 kcal divided by recommended intake of each nutrient per 1,000 kcal.
Folate
Niacin
Vitamin B6 Riboflavin Thiamin Vitamin A Protein
Zinc
Iron
Phosphorus
Calcium
Vitamin C 1.5
1
0.5 0
NAR INQ
even in the face of adequate protein intake, can be result in a negative nitrogen balance in hemodialysis patients. That is, inadequate energy intake may mitigate the potential benefit of an adequate protein intake because ingested protein as well as somatic protein deposit may be catabolized for energy. There- fore, the low consumption of both dietary energy and protein in this study might lead hemodialysis patients to have a high substantial and potential risk for diet-induced malnutrition.
In this study, we examined the overall adequacy of essential nutrients intake using a dietary quality measurement tool, the DQI-I. Consumption of essential nutrients, such as vitamin A, C, thiamin, riboflavin, niacin, folate, calcium, phosphorus, zinc and dietary fiber, were inadequate among most subjects. More than 60% of the subjects consumed these nutrients at less than 75% of the dietary recommended levels for hemodialysis
patients. In terms of adequacy of foods, the consumption of vegetable and fruit groups was especially low compared with other food groups.
Our findings are consistent with dietary characteristics in in- dividuals with renal failure that have been previously reported.
Kalantar-Zadeh et al. [12] investigated characteristics of diets in hemodialysis patients using a food frequency question- naire (FFQ). They found hemodialysis patients consumed lower amounts of vitamin C, K, some carotenoids, and dietary fibers.
A study by Faccini et al. [31] indicated that patients with end- stage renal disease (ESRD) had significantly lower intakes of potassium, calcium, and phosphorus. The findings from studies by Block et al. [32] and Clermont et al. [33] also demonstrated a low level of vitamin C among ESRD patients.
From the findings of the previous studies and the present Table 3. Diet Quality Index-International(DQI-I) of the subjects
Range of score Score
(n = 63) % of full score
DQI-I 0 - 100 62.4 ± 6.2* 62
Variety 0 - 20 13.0 ± 2.5 65
Overall food group variety 0 - 15 10.3 ± 1.6 69
Within-group variety for protein source 0 - 5 2.7 ± 1.2 54
Adequacy 0 - 40 23.7 ± 4.5 59
Vegetable group 0 - 5 3.3 ± 1.1 66
Fruit group 0 - 5 1.4 ± 1.2 28
Grain group 0 - 5 4.0 ± 1.0 80
Fiber 0 - 5 2.6 ± 1.0 52
Protein 0 - 5 4.9 ± 0.2 98
Iron 0 - 5 3.5 ± 0.9 70
Calcium 0 - 5 1.9 ± 1.0 38
Vitamin C 0 - 5 2.6 ± 1.3 52
Moderation 0 - 30 22.9 ± 3.8 76
Total fat 0 - 6 5.6 ± 0.8 93
Saturated fat 0 - 6 5.6 ± 0.8 93
Cholesterol 0 - 6 4.7 ± 1.4 78
Sodium 0 - 6 2.4 ± 2.4 40
Empty calorie foods 0 - 6 3.8 ± 1.8 63
Overall balance 0 - 10 2.8 ± 1.7 28
Macronutrient ratio 0 - 6 1.7 ± 1.2 28
Fatty acid ratio 0 - 4 1.1 ± 0.9 28
Diet Quality Index-International (DQI-I), which is composed of four categories, variety, adequacy, moderation, and overall balance, was used for diet quality evaluation. The scores of each item in four categories of DQI-I was summed in total DQI-I score. Total DQI-I score was ranged from 0 (the poorest) to 100 (the highest). The higher score of DQI-I was, the better diet quality was.
*Mean ± SD.
study, the following can be speculated. First, hemodialysis patients are exposed to traditional dietary restrictions in potassium that may lead to a reduction in the consumption of vegetables and fruits, which, in turn, results in reduced intake of vitamins and minerals. Such dietary patterns may contribute to exacerbation of nutritional status in hemodi- alysis patients [34-37]. Second, hemodialysis patients have monotonous meal patterns that might contribute to a reduced variety of overall types of foods. In this study, approximately 50% of the subjects consumed daily single food items within each food group, especially fruit, meat, and fish group (data not shown). Third, insufficient energy intake, most of all, might cause inadequacy of the essential nutrient intakes in hemodi- alysis patients. In this study, nutrient adequacy, the scores of NAR and INQ, and the differences before and after adjustment of energy intake, were evaluated. The results indicate that the absolute amount of nutrient intake did not meet the recom- mended level, but nutrient density per energy was adequate compared with the recommended level. This suggests that sufficient energy intake is important for providing essential nutrients and increases in nutrient intake can be ensured by increasing energy intake.
Poor appetite is the most influential contributing factor to poor intake in hemodialysis patients. Patient with chronic renal disease frequently experience anorexia, which develops dur- ing the progression of the disease [19,38]. In this study, almost 70% of the subjects reported impaired appetite. Appetite was positively correlated with DEI (r = 0.33, p < 0.01, data not shown). Poor appetite was closely associated with malnutri- tion, inflammation and unfavorable health outcome in patients with maintenance hemodialysis [1]. Therefore, strategies for appetite increases also should be developed to encourage suf- ficient energy intakes by hemodialysis patients.
Another reason for inadequate energy intake might be the difficulty in following the recommended diet. Hemodialysis patients should follow the prescribed diet therapy, which com- monly includes low-sodium, low-potassium and low-phos- phorus diets. These diets can cause patients to face difficulty in choosing foods and to lose appetite subsequently. A study by Kim et al. [39] reported that only 30-40% of hemodialysis patients followed their prescribed diet therapy related to re- strictions of sodium, potassium and fluid. In this study, more than 70% of hemodialysis patients complained of having dif- ficulty following the dietary recommendations. It can be inter- preted that difficulty with following diet therapy might be one of main barriers to appropriate and adequate energy as well as
nutrient intakes in hemodialysis patients. Health care provid- ers should pay attention to controlling the modifiable factors influencing diet insufficiency in hemodialysis patients. Along with the monitoring of nutrient adequacy, whether prescribed diet therapy is appropriately upheld should be closely moni- tored through diet counseling and frequent reinforcement of what has been previous instructed.
The strength of this study is that, to our knowledge, this is the first study investigate overall diet quality using compre- hensive diet quality indices. Study results are noteworthy in that insufficient energy intake was a main contributable factor to inadequacies in dietary protein and overall essential nutri- ents, which was accompanied by inappropriate use of food items in hemodialysis patients. This study also contributed to identify the barriers to inadequate dietary intake, demonstrat- ing diminished appetite and feeling difficulty following diet therapy may result in inadequacy and nutrient intake imbal- ance.
The study limitation is that there was no control group for a comparison of the nutrient adequacy and overall diet quality.
However, this limitation is somewhat mitigated by identifying the problems of dietary quality in the manner of comprehen- sive approach using 3 validated diet indices such as NAR, INQ and DQI-I. The assessment of the diet quality using such diet indices compared with the recommendations provides the current status of dietary characteristics of hemodialysis pa- tients more clearly as a preliminary information for further in- depth and large study. We have a plan to implement further in-depth studies to identify the barriers to inadequate nutrient intakes in hemodialysis patients.
Our findings have three major implications. First, careful evaluation of the DEI for each individual with maintenance hemodialysis therapy is required to meet the individual nutri- tional requirements. Second, hemodialysis patients should be encouraged to increase their DEI to achieve overall nutrient adequacy through effective diet education and monitoring.
Third, close attention should be paid to the consumption of various food sources for ensuring nutrient balance through individualized nutritional education because the essential nu- trients are not all found in a single food item but come from a diet composed of a number of food groups. Furthermore, the hemodialysis patients with complications such as diabe- tes might encounter challenges in following more strict diet therapy and encounter more difficulty with choosing foods.
The older patients also might have difficulty in preparing their meals with variety of foods, which might be due to limited
awareness and cognitive deficit. To ensure adequate dietary intake in these vulnerable groups, the development and intro- duction of more specific recipes with selected foods should be performed so that the patients could be motivated and more easily to adapt to their recommended diet therapy. Above all, tailored nutritional education and counseling thorough nutri- tional assessment by a clinical dietitian must be incorporated in clinical treatment.
Acknowledgements
The authors would like to express our gratitude to all par- ticipants for their roles in this study.
Conflict of Interests
No conflict interests were declared by any of the authors.
References
1. Krenitsky J. Nutrition in renal failure: myths and management. Pract Gastroenterol 2004;20:40-59.
2. Stenvinkel P, Heimbürger O, Lindholm B, Kaysen GA, Bergström J. Are there two types of malnutrition in chronic renal failure? Evidence for relationships between malnutrition, inflammation and atherosclerosis (MIA syndrome). Nephrol Dial Transplant 2000;15:953-60.
3. Bergström J. Why are dialysis patients malnourished? Am J Kidney Dis 1995;26:229-41.
4. Fouque D, Kalantar-Zadeh K, Kopple J, Cano N, Chauveau P, Cuppari L, Franch H, Guarnieri G, Ikizler TA, Kaysen G, Lindholm B, Massy Z, Mitch W, Pineda E, Stenvinkel P, Treviño-Becerra A, Wanner C. A proposed no- menclature and diagnostic criteria for protein-energy wasting in acute and chronic kidney disease. Kidney Int 2008;73:391-8.
5. Clinical practice guidelines for nutrition in chronic renal failure. K/DOQI, National Kidney Foundation. Am J Kidney Dis 2000;35:S1-140.
6. Lorenzo V, de Bonis E, Rufino M, Hernández D, Rebollo SG, Rodríguez AP, Torres A. Caloric rather than protein deficiency predominates in stable chronic haemodialysis patients. Nephrol Dial Transplant 1995;10:1885-9.
7. Dwyer JT, Cunniff PJ, Maroni BJ, Kopple JD, Burrowes JD, Powers SN, Cockram DB, Chumlea WC, Kusek JW, Makoff R, Goldstein DJ, Paranandi L. The hemodialysis pilot study: nutrition program and par- ticipant characteristics at baseline. The HEMO Study Group. J Ren Nutr 1998;8:11-20.
8. Burrowes JD, Cockram DB, Dwyer JT, Larive B, Paranandi L, Bergen C, Poole D. Cross-sectional relationship between dietary protein and energy intake, nutritional status, functional status, and comorbidity in older versus younger hemodialysis patients. J Ren Nutr 2002;12:87-95.
9. Locatelli F, Fouque D, Heimburger O, Drüeke TB, Cannata-Andía JB, Hörl WH, Ritz E. Nutritional status in dialysis patients: A European consen- sus. Nephrol Dial Transplant 2002;17:563-72.
10. Kim HJ, Kim SA, Sohn CM: Association of the nutritional status and essential amino acids intake in hemodialysis patients. Korean J Nutr 2006;39:617-23.
11. Kawakami J, Suzuki Y, Sugino N. Evaluation of amino acid patterns in recipes for kidney disease patients. J Ren Nutr 2003;13:126-32.
12. Kalantar-Zadeh K, Kopple JD, Deepak S, Block D, Block G. Food intake characteristics of hemodialysis patients as obtained by food frequency
questionnaire. J Ren Nutr 2002;12:17-31.
13. Dobell E, Chan M, Williams P, Allman M. Food preferences and food habits of patients with chronic renal failure undergoing dialysis. J Am Diet Assoc 1993;93:1129-35.
14. Ohri-Vachaspati P, Sehgal AR: Correlates of poor appetite among he- modialysis patients. J Ren Nutr 1999;9:182-5.
15. Aguilera A, Codoceo R, Bajo MA, Iglesias P, Diéz JJ, Barril G, Cigarrán S, Alvarez V, Celadilla O, Fernández-Perpén A, Montero A, Selgas R. Eating behavior disorders in uremia: a question of balance in appetite regula- tion. Semin Dial 2004;17:44-52.
16. Zimmerer JL, Leon JB, Covinsky KE, Desai U, Sehgal AR. Diet monotony as a correlate of poor nutritional intake among hemodialysis patients. J Ren Nutr 2003;13:72-7.
17. Burrowes JD, Powers SN, Cockram DB, McLeroy SL, Dwyer JT, Cunniff PJ, Paranandi L, Kusek JW. Use of an appetite and diet assessment tool in the pilot phase of a hemodialysis clinical trial: Mortality and morbid- ity in hemodialysis study. J Ren Nutr 1996;6:229-232.
18. Burrowes JD, Larive B, Chertow GM, Cockram DB, Dwyer JT, Greene T, Kusek JW, Leung J, Rocco MV; Hemodialysis (HEMO) Study Group. Self- reported appetite, hospitalization and death in haemodialysis patients:
findings from the Hemodialysis (HEMO) Study. Nephrol Dial Transplant 2005;20:2765-74.
19. Kalantar-Zadeh K, Block G, McAllister CJ, Humphreys MH, Kopple JD.
Appetite and inflammation, nutrition, anemia, and clinical outcome in hemodialysis patients. Am J Clin Nutr 2004;80:299-307.
20. Masud T. Trave elements and vitamins in renal disease. In: Mitch WE, Klahr S, editors. Handbook of nutrition and the kidney. 4th ed. Philadel- phia (PA): Lippincott Williams & Wilkins; 2002. p. 233-52.
21. Wiggins KL. Guidelines for nutrition care of renal patients. 3rd ed. Chi- cago (IL): American Dietetic Association; 2002.
22. The Korean Nutrition Society. Dietary reference intakes for Koreans.
Seoul: The Korean Nutrition Society; 2005.
23. Hatløy A, Torheim LE, Oshaug A: Food variety--a good indicator of nu- tritional adequacy of the diet? A case study from an urban area in Mali, West Africa. Eur J Clin Nutr 1998;52:891-8.
24. Guthrie HA, Scheer JC. Validity of a dietary score for assessing nutrient adequacy. J Am Diet Assoc 1981;78:240-5.
25. Ries CP, Daehler JL: Evaluation of the Nutrient Guide as a dietary as- sessment tool. J Am Diet Assoc 1986;86:228-33.
26. Coles GA, Peters DK, Jones JH. Albumin metabolism in chronic renal failure. Clin Sci 1970;39:423-35.
27. Hansen RG, Wyse BW. Expression of nutrient allowances per 1,000 kilocalories. J Am Diet Assoc 1980;76:223-7.
28. Kim S, Haines PS, Siega-Riz AM, Popkin BM. The Diet Quality Index- International (DQI-I) provides an effective tool for cross-national com- parison of diet quality as illustrated by China and the United States. J Nutr 2003;133:3476-84.
29. Bergström J. Nutrition and mortality in hemodialysis. J Am Soc Nephrol 1995;6:1329-41.
30. Marcén R, Teruel JL, de la Cal MA, Gámez C. The impact of malnutrition in morbidity and mortality in stable haemodialysis patients. Spanish Cooperative Study of Nutrition in Hemodialysis. Nephrol Dial Transplant 1997;12:2324-31.
31. Facchini F, Schoenfeld P, Dixon B, Giambra G, Coulston A. ESRD pa- tients consume an atherogenic diet. J Am Soc Nephrol 1997;7:S133.
32. Block G, Mangels AR, Norkus EP, Patterson BH, Levander OA, Taylor PR.
Ascorbic acid status and subsequent diastolic and systolic blood pres- sure. Hypertension 2001;37:261-7.
33. Clermont G, Lecour S, Lahet J, Siohan P, Vergely C, Chevet D, Rifle G, Rochette L. Alteration in plasma antioxidant capacities in chronic renal failure and hemodialysis patients: a possible explanation for the increased cardiovascular risk in these patients. Cardiovasc Res 2000;47:618-23.
34. Reid DJ, Barr SI, Leichter J. Effects of folate and zinc supplementa- tion on patients undergoing chronic hemodialysis. J Am Diet Assoc
1992;92:574-9.
35. Agarwal S, Rao AV. Carotenoids and chronic diseases. Drug Metabol Drug Interact 2000;17:189-210.
36. Rissanen T, Voutilainen S, Nyyssönen K, Salonen R, Salonen JT. Low plasma lycopene concentration is associated with increased intima- media thickness of the carotid artery wall. Arterioscler Thromb Vasc Biol 2000;20:2677-81.
37. Lim PS, Chan EC, Lu TC, Yu YL, Kuo SY, Wang TH, Wei YH. Lipophilic an- tioxidants and iron status in ESRD patients on hemodialysis. Nephron
2000;86:428-35.
38. Carrero JJ, Qureshi AR, Axelsson J, Avesani CM, Suliman ME, Kato S, Bárány P, Snaedal-Jonsdottir S, Alvestrand A, Heimbürger O, Lindholm B, Stenvinkel P. Comparison of nutritional and inflammatory markers in dialysis patients with reduced appetite. Am J Clin Nutr 2007;85:695- 701.
39. Ikizler TA. Protein and energy intake in advanced chronic kidney dis- ease: how much is too much? Semin Dial 2007;20:5-11.