경사진 임플란트에서 임플란트 인상의 정확도 평가를 위한 역공학 기법
정홍택1·이기선2·송소연1·박진홍1·이정열1*
Hong-Taek Jung1, Ki-Sun Lee2, So-Yeon Song1, Jin-Hong Park1, Jeong-Yol Lee1*
Reverse engineering technique on the evaluation of impression accuracy in angulated implants
Purpose. The aim of this study was (1) to compare the reverse engineering tech- nique with other existing measurement methods and (2) to analyze the effect of implant angulations and impression coping types on implant impression accura- cy with reverse engineering technique. Materials and methods. Three different master models were fabricated and the distance between the two implant center points in parallel master model was measured with different three methods; digi- tal caliper measurement (Group DC), optical measuring (Group OM), and reverse engineering technique (Group RE). The 90 experimental models were fabricated with three types of impression copings for the three different implant angulation and the angular and distance error rate were calculated. One-way ANOVA was used for comparison among the evaluation methods (P < .05). The error rates of experimental groups were analyzed by two-way ANOVA (P < .05). Results. While there was significant difference between Group DC and RE (P < .05), Group OM had no significant difference compared with other groups (P > .05). The standard deviations in reverse engineering were much lower than those of digital caliper and optical measurement. Hybrid groups had no significant difference from the pick-up groups in distance error rates (P > .05). Conclusion. The reverse engi- neering technique demonstrated its potential as an evaluation technique of 3D accuracy of impression techniques. (J Korean Acad Prosthodont 2021;59:261-70) Keywords
Digital evaluation method; Hybrid impression coping; Implant angulation;
Reverse engineering technique
Corresponding Author Jeong-Yol Lee
Department of Advanced Prosthodontics, Korea University Guro Hospital, Institute for Clinical Dental Research, Guro Hospital, Korea University, 148 Gurodong-ro, Guro-gu, Seoul 08305, Republic of Korea
+82 (0)2 2626 1922 [email protected]
Article history Received February 17, 2021 / Last Revision March 21, 2021 / Accepted March 23, 2021 ORCID iDs
Hong-Taek Jung
https://orcid.org/0000-0001-5297-5078 Ki-Sun Lee
https://orcid.org/0000-0002-6933-3589 So-Yeon Song
https://orcid.org/0000-0002-7738-5370 Jin-Hong Park
https://orcid.org/0000-0002-3220-9912 Jeong-Yol Lee
https://orcid.org/0000-0003-3079-0376 1고려대학교 구로병원 임상치의학연구소
2고려대학교 안산병원 치과보철과
1Department of Advanced Prosthodontics, Institute of Clinical Dental Research, Korea University of Guro Hospital, Republic of Korea
2Department of Prosthodontics, Korea University of Ansan Hospital, Republic of Korea
© 2021 The Korean Academy of Prosthodontics
This is an Open Access article distributed under the terms of the Creative Commons Attribution Non- Commercial License (http://creativecommons.org/licenses/by-nc/4.0) which permits unrestricted non-commercial use, distribution, and reproduction in any medium, provided the original work is properly cited.
cc
Introduction
For long-term stability of the implant prostheses, a passive fit must be achieved between the implant fixture and suprastructure,1 and an accurate implant impression must be preceded to obtain a passive fit.2 Various factors including impression coping types, impression tech- niques, implant angulations, and implant impression sys- tems have been reported as potential influencing factors for accuracy of implant impressions.3-5
With the combined advantages of pick-up type im- pression copings and transfer type impression copings, hybrid impression copings have been developed. In a previous study by Shim et al.,6 the accuracy of three types of copings (pick-up, transfer, and hybrid impression cop- ings) were compared, and the hybrid impression copings demonstrated comparable accuracy to the pick-up im- pression copings.
Meanwhile, the authors in the previous study6 used a video measuring system to measure the angle error rate and distance between two implants. Although this con- ventional optical method has been widely used in earlier studies,5,7 it can be subjective in that selection of refer- ence points at the time of measurements could be differ- ent depending on the examiners and study conditions.
In order to overcome the shortcomings of conventional methods, the more quantitative evaluation method has been tried recently.
Many previous studies have evaluated the three-dimen- sional distortion using a stylus measurement and coor- dinate measuring machines.3,8 In addition, Kurtulmus et al. suggested the evaluation method to measure the de- viations by quantifying the error of the overall model by digitally superimposing the data of reference model and experimental model with a best-fitting algorithm.4 How- ever, the ‘best-fitting algorithm’ also has limitation in that it attempts to register the surfaces as close overall mean global distances as possible, which may conceal any in- crease in deviation and cause difficulty in rendering the interpretation of the deviations.9
Reverse engineering, also called back engineering, is a technique that a man-made material is deconstruct- ed to reveal its designs and architecture, and to extract knowledge from the material. It is possible to analyze the shape and structure of an object digitally by scanning the finished product, rather than producing a product from the blueprint. The obtained digital data are converted to polygon data, and finally converted to parametric CAD data. Through this deconstruction technique, the exam- iner can acquire the blueprint from the product, and can modify and analyze the parameters.10 In the field of den- tistry, the reverse engineering technique has also been used in building the virtual model when planning max- illofacial prosthesis for maxillofacial defect.11,12 In addi- tion, this technique was also used in the previous study for analyzing the usefulness of the CAD-CAM technol- ogy.13 Therefore, as an evaluation method, there seems to be a need to utilize the reverse engineering technique to the field of dentistry which can be applied reliably in other various fields such as mechanical design or other medical fields.11,14,15
The purpose of this study was (1) to comparatively evaluate the reverse engineering technique with other existing measurement methods (manual measurement method using a digital caliper and optical measurement method using a video measurement system) as an accu- racy analysis method and (2) to evaluate the effect of in- ter-implant divergences and type of impression copings on impression accuracy with the reverse engineering technique.
Materials and methods
Master models
Three metal master models (length: 30 mm, width:
20 mm, height: 15 mm) with two holes of 9 mm depth at 10 mm intervals were fabricated using the Computer Aided Design-Computer Aided Manufacturing system.
Three different angulations between the holes (parallel,
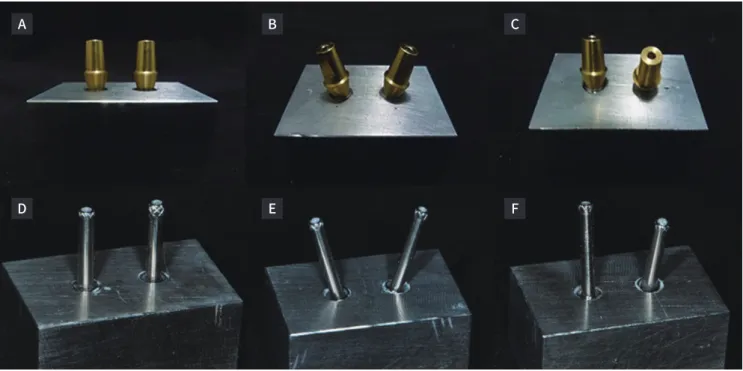
15 degrees mesiodistal divergence, and 15 degrees buc- colingual divergence) were established in each master cast (Fig. 1A, Fig. 1B, Fig. 1C). Implant laboratory analogs were positioned into the holes using resin cement (G-CEM LinkAce, GC Corporation, Tokyo, Japan).
To conveniently design and measure the distance within the digital analysis software (Geomagic Design X, Geomagic, Morrisville, NC, USA), the metal bars were prepared as shown in Figs. 1D, 1E, and 1F.
Comparison among evaluation measuring methods
The distance between two implant center points in the parallel master model was measured by different three methods; digital caliper measurement (Group DC), optical measure method (Group OM), and reverse engi- neering technique (Group RE). Each measurement was performed 10 times, and the mean values and standard deviations were compared. In digital caliper measure- ment, the digital caliper (Mitutoyo digital Vernier caliper, Mitutoyo, Kawasaki, Japan) was used to measure the dis-
tance between the two implant center points. In optical measurement, the distance between two implant center points was measured using an automatic optical measur- ing system (Accura IIIA, Seven Ocean Technology, Dong- guan city, China) and the image software (Seven Ocean EF-8000 V.9.3, Seven Ocean Technology, Dongguan city, China) was used to measure the distance. To minimize the examiner error, only one examiner performed the measurement during this study. For the reverse engi- neering technique, the scan data of master model were obtained 10 times with the model scanner (Identica blue, Medit, Seoul, Korea) and the distance between the im- plant center points was measured in each scan data with the digital analysis software (Geomagic Design X, Geo- magic, Morrisville, NC, USA). To determine the extent of variability of three evaluation methods, the coefficient of variation (CV) for the distance between the two center points of fixture was calculated with the following for- mula.
Coefficient of variation (%) = Standard deviation
× 100 Mean
Fig. 1. (A) Metal master models with parallel, (B) 15 degrees mesio-distally divergent, (C) 15 degrees bucco-lingually divergent implants, (D), (E), (F) Metal master models with metal bars.
A B C
D E F
Effect of impression coping types and implant angulation
Ninety experimental models were fabricated with three different types of impression copings for the three different master models (parallel, mesiodistally diver- gent, buccolingually divergent). The three different types of impression copings include pick-up, transfer, and hybrid type copings (Table 1). The open tray method was used for pick-up impression technique, and the closed tray method was used for transfer and hybrid impression technique. The impression copings were fixed to the metal master cast, and the impression was taken with light body and heavy body silicone impression materials (Imprint III, 3M ESPE, St. Paul, MN, USA). After complete setting of the impression body, the impression was sepa- rated from the master cast. Type IV dental stone (GC Fu- jirock, GC Corporation, Tokyo, Japan) was used to make experimental models.
Measurement of the angular and distance accuracy
The prepared master models and the experimental models with metal bars were scanned with 3D model scanner. To avoid scattering and increase the scannabil- ity of the scanner, the scanning spray (Aesub White Per- manent 3D Scanning Spray, Aesub, Herrieden, Germany) was applied on the metal surface including the implant shoulder area and metal bars. With obtained scan data, the angulation and distance of the experimental models
were measured with reverse engineering technique by digital analysis software (Fig. 2).
Impression accuracy was evaluated in two terms: angu- lar and distance error rates. The procedure of measure- ment is shown in the Fig. 3 and Fig. 4.
The angulation and distance error rate (ER) were calcu- lated using following formula:
Angulation ER = |Angle of Master Model - Angle of Experimental Model|
Angle of Master Model
Distance ER = |Distance of Master Model - Distance of Experimental Model|
Distance of Master Model
Table 1. The design of experimental groups
Parallel Mesio-distally
divergent Bucco-lingually divergent Pick-up (Pick-up impression coping, Neobiotech Corporation, Seoul, Korea) PA-p
(n = 10) MD-p
(n = 10) BL-p
(n = 10) Transfer (Transfer impression coping, Neobiotech Corporation, Seoul, Korea) PA-t
(n = 10) MD-t
(n = 10) BL-t
(n = 10) Hybrid (Pickcap impression coping, Neobiotech Corporation, Seoul, Korea) PA-h
(n = 10) MD-h
(n = 10) BL-h
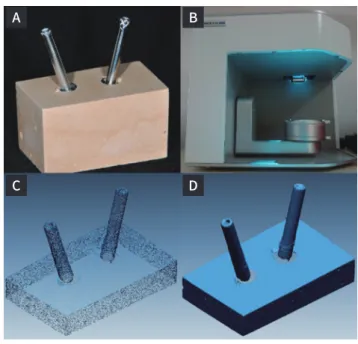
(n = 10) Fig. 2. Scanning and CAD software importing procedures for the reverse engineering technique. (A) Experimental model with metal bars, (B) Scanning by the Model Scanner, (C) Imported as a STL File in point cloud, (D) Converted to polygon via CAD software.
A B
C D
Statistical analysis
All statistical tests were analyzed using SPSS version 22.0 (IBM, Armonk, NY, USA). The normality of data dis- tribution was verified using Kolmologov-Smirnov test.
To comparatively evaluate the accuracy of three mea-
surement methods, analysis of variance (ANOVA) was used, while Tukey’s test was used for post hoc analysis (P
< .05). The error rates of experimental groups according to implant angulation and impression coping type were analyzed by two-way ANOVA and Duncan’s post hoc test (P < .05).
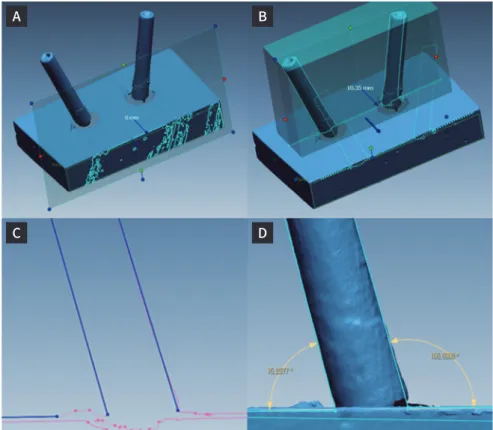
Fig. 3. Angular accuracy measurement.
(A) Setting of the reference plane in the software, (B) Projection of the object surface to the reference plane, (C) Sketching the surface line of the projected metal bars using best fitting algorithm, (D) Measurement of the implant angle.
A B
C D
Fig. 4. Distance accuracy measurement. (A) Setting of reference plane and projection plane in the software, (B) Finding intersected arc lines between the screw and plane, (C) Sketching the arc line and the center of metal bars using best fitting algorithm. The distance between the two center points was measured.
A B C
Results
The numerical values among three evaluation meth- ods ranged between 10.51 and 10.35 mm (Table 2). While there was significant difference between Group DC and RE (P < .05), Group OM had no significant difference compared with other groups (P > .05) (Table 3). The stan- dard deviation in Group RE was much lower than Group DC and OM. Accordingly, the coefficient of variation was lowest in reverse engineering technique; followed by dig- ital caliper measurement and optical measuring.
The mean angular error rate ranged from 0.61 (BL-p) to 0.76 (PA-t) (Table 3). There were no significant differenc-
es according to the coping types and inter-implant diver- gence (P > .05). The angular error rates of all groups were less than the International Standardization Organization standard (1.5%).
The mean distance error rate ranged from 0.47 (PA-p) to 1.56 (MD-t) (Table 4). In divergent groups, the transfer coping groups (MD-t, BL-t) showed significantly higher distance error rates than the pick-up groups (MD-p, BL-p) (P < .05). In addition, the error rate of impressions with transfer coping and buccolingual divergence exceeded the International Standardization Organization standard (1.5%). Hybrid groups had no significant differences from pick-up groups in distance error rates (P > .05).
Table 3. Mean angular error rate (ER) and standard deviations (in percentage) Parallel
(Avg ER (± SD)) Mesiodistally divergent
(Avg ER (± SD)) Buccolingually divergent (Avg ER (± SD))
Pickup 0.643 (± 0.462) 0.614 (± 0.536) 0.608 (± 0.424)
Transfer 0.759 (± 0.513) 0.746 (± 0.572) 0.763 (± 0.517)
Hybrid 0.640 (± 0.516) 0.728 (± 0.637) 0.731 (± 0.565)
* No significant difference was found among any of the experimental groups.
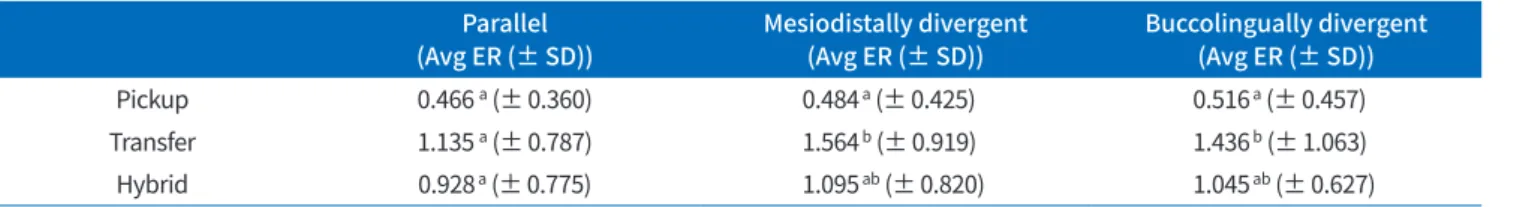
Table 4. Mean distance error rate (ER) and standard deviations (in percentage) Parallel
(Avg ER (± SD)) Mesiodistally divergent
(Avg ER (± SD)) Buccolingually divergent (Avg ER (± SD))
Pickup 0.466 a (± 0.360) 0.484 a (± 0.425) 0.516 a (± 0.457)
Transfer 1.135 a (± 0.787) 1.564 b (± 0.919) 1.436 b (± 1.063)
Hybrid 0.928 a (± 0.775) 1.095 ab (± 0.820) 1.045 ab (± 0.627)
* Different superscript small letters indicate a significant difference according to the impression coping type (P <.05).
Table 2. The mean distance between the center of implants (in mm), standard deviation and the coefficient of variation (in percentage) in three measurement techniques
Mean S.D 95% CI
Min Max CV (%)
Minimum Maximum
DC 10.51A 0.12 10.42 10.59 10.29 10.65 106
OM 10.43AB 0.13 10.33 10.52 10.28 10.66 121
RE 10.35B 0.02 10.34 10.37 10.31 10.39 19
* DC: Digital caliper. OM: Optical measuring. RE: Reverse engineering. S.D: Standard deviation. CI: Confidence interval. CV: Coefficient of variation (%).
** Different superscript capital letters indicate the significant difference (P < .05).
Discussion
Reverse engineering technique has been widely used not only in various industrial fields, but also in other medical,14,15 and dental fields.11,12 In addition, this digital deconstruction method has been used as an evaluation tool to obtain the more quantitative three dimensional analysis.16,17 Nevertheless, to the knowledge of the au- thors, there has been no research which directly evalu- ated the validity of reverse engineering technique with other existing accuracy evaluation methods. This study compared the reverse engineering technique with exist- ing conventional measurement methods.
From the results of this study, two followings were observed. First, the coefficient of variation of the mean distance calculated in the reverse engineering groups was considerably less than those in the digital caliper measurement and optical measurement method groups;
which means the extent of variability of the distance was much lower in reverse engineering group.18 Although the conventional manual measurement techniques used in this study have been used in many previous studies,5,6 they can be subjective in that the examiner determines the measurement point at the time of every measure- ment. In contrast, for the reverse engineering technique, the center point of the implant fixture was digitally set within the computer analysis software, and it can be rela- tively objective compared to the manual determination of measurement points. Second, although the reverse engi- neering technique and digital caliper showed significant difference in mean distance, the numerical error rate values among three experimental groups were not very different. Based on the results from the present study, it might be considered that the reverse engineering tech- nique can be available as a more quantitative measure- ment tool for measuring the three dimensional accuracy.
Meanwhile, in 2012, the NIST (National Institute of Standards and Technology) evaluated the least squares algorithm of Geomagic, Inc., which is one of the most commonly used reverse engineering software worldwide
and used in the present study, with the ASME B89.4.10- 2000 Standard Default Test. This test was conducted to find the uncertainty of measurement in Geomagic’s algorithm based on the various geometry types such as lines, circles, planes, spheres, cylinders, and cones, and the observed maximum deviations were less than 10-5 μm in lines, planes, and cylinders.19 On the other hand, the standard deviation of the reverse engineering technique measured in the present study was 20 μm, which was much higher than that of the aforementioned Standard Default Test. The digital scans were repeated for every measurement procedure in the present study, and it could be presumed that the relatively greater deviation might have originated from the precision of digital scan.
Several earlier studies reported that the accuracy of pick-up impression showed a significantly lower error rate than that of transfer impression.20,21 On the other hand, Conrad et al.22 investigated the accuracy of implant impressions according to the implant angulation and the type of coping within the implant angle of 15 degrees.
They concluded that there was no significant difference regardless of coping type and implant angulation. Reddy et al.23 evaluated the accuracy of implant impressions according to the implant divergence (within 15 degrees) and also reported that there was no significant difference among all experimental groups.
The variables which influenced the accuracy of implant impression within the present study were the implant divergence and the type of impression coping. The accu- racy of impression was evaluated in angular and distance error rates and the authors found that the angular error rate according to implant divergence was similar in most experimental groups. However, in distance error rates, the transfer type coping showed significant higher error rate than the pick-up type coping in divergent models.
There have been few studies which evaluated the ac- curacy of hybrid type copings.6 Although the impression technique using hybrid type copings also has reposition- ing procedure similar to that using transfer type coping, they have plastic stops in the impression body to deter-
mine the end point of copings which help position the copings into impression body more precisely. Within the present study, there was no significant difference in the distance and angle errors rate between the pick-up and hybrid type impression copings. In this regard, even in the presence of angulated implants, hybrid type impres- sion coping can be an alternative method according to the clinical indications or the preference of clinicians.
However, this study was performed in vitro, and the condition of this study could be ideal for taking impres- sions compared to clinical oral conditions. Additional in vivo and in vitro studies should be needed to further vali- date the results of this study.
Conclusion
Within the limitations of this study, the following con- clusions were drawn:
1. Compared to the digital caliper measurement and optical measuring methods, the reverse engineering technique using digital scanner and CAD software demonstrated its potential as an evaluation tech- nique for three dimensional accuracy of implant impression techniques.
2. Although the angular accuracy of implant impres- sions was not affected by the type of impression cop- ings and implant divergences, the distance accuracy of implant impressions can vary according to the types of impression copings in divergent implants.
References
1. Sahin S, Cehreli MC. The significance of passive framework fit in implant prosthodontics: current status. Implant Dent 2001;10:85-92.
2. Lee SE, Yang SE, Lee CW, Lee WS, Lee SY. Accura- cy of new implant impression technique using dual arch tray and bite impression coping. J Adv Prostho- dont 2018;10:265-70.
3. Teo JW, Tan KB, Nicholls JI, Wong KM, Uy J.
Three-dimensional accuracy of plastic transfer im-
pression copings for three implant systems. Int J Oral Maxillofac Implants 2014;29:577-84.
4. Kurtulmus-Yilmaz S, Ozan O, Ozcelik TB, Yagiz A.
Digital evaluation of the accuracy of impression techniques and materials in angulated implants. J Dent 2014;42:1551-9.
5. Sorrentino R, Gherlone EF, Calesini G, Zarone F. Ef- fect of implant angulation, connection length, and impression material on the dimensional accura- cy of implant impressions: an in vitro comparative study. Clin Implant Dent Relat Res 2010;12:e63-76.
6. Shim JS, Ryu JJ, Shin SW, Lee JY. Effects of implant angulation and impression coping type on the di- mensional accuracy of impressions. Implant Dent 2015;24:726-9.
7. De La Cruz JE, Funkenbusch PD, Ercoli C, Moss ME, Graser GN, Tallents RH. Verification jig for im- plant-supported prostheses: A comparison of stan- dard impressions with verification jigs made of dif- ferent materials. J Prosthet Dent 2002;88:329-36.
8. Conrad HJ, Seong WJ, Pesun IJ. Current ceramic ma- terials and systems with clinical recommendations:
a systematic review. J Prosthet Dent 2007;98:389-404.
9. Gherlone E, Capparé P, Vinci R, Ferrini F, Gastaldi G, Crespi R. Conventional versus digital impressions for “All-on-Four” restorations. Int J Oral Maxillofac Implants 2016;31:324-30.
10. Buonamici F, Carfagni M, Furferi R, Governi L, Lap- ini A, Volpe Y. Reverse engineering modeling meth- ods and tools: a survey. Computer-Aided Design and Applications 2018;15:443-64.
11. Zheng Y, Lu B, Zhang J, Wu G. CAD/CAM silicone simulator for teaching cheiloplasty: description of the technique. Br J Oral Maxillofac Surg 2015;53:194- 6.
12. Loeffelbein DJ, Rau A, Wolff KD. Impression tech- nique for monitoring and virtual treatment plan- ning in nasoalveolar moulding. Br J Oral Maxillofac Surg 2013;51:898-901.
13. Mestrinho LA, Gordo I, Gawor J, Leal N, Niza M. Ret- rospective study of 18 titanium alloy crowns pro- duced by computer-aided design and manufactur- ing in dogs. Front Vet Sci 2019;6:97.
14. Holler M, Guizar-Sicairos M, Tsai EH, Dinapoli R, Müller E, Bunk O, Raabe J, Aeppli G. High-resolu-
tion non-destructive three-dimensional imaging of integrated circuits. Nature 2017;543:402-6.
15. Chantarapanich N, Rojanasthien S, Chernchujit B, Mahaisavariya B, Karunratanakul K, Chalermkarn- non P, Glunrawd C, Sitthiseripratip K. 3D CAD/re- verse engineering technique for assessment of Thai morphology: Proximal femur and acetabulum. J Or- thop Sci 2017;22:703-9.
16. Chen J, Zhang Z, Chen X, Zhang C, Zhang G, Xu Z.
Design and manufacture of customized dental im- plants by using reverse engineering and selective la- ser melting technology. J Prosthet Dent 2014;112:
1088-95.e1.
17. Martorelli M, Ausiello P, Morrone R. A new meth- od to assess the accuracy of a Cone Beam Comput- ed Tomography scanner by using a non-contact re- verse engineering technique. J Dent 2014;42:460-5.
18. Everitt BS, Skrondal A. The Cambridge dictionary of statistics. 4th ed. Cambridge; Cambridge University Press; 2013. p. 89.
19. United States Department of Commerce. National Institute of Standards and Technology. ASME B89.4.
10-2000 and NISTIR 5686.
20. Jo SH, Kim KI, Seo JM, Song KY, Park JM, Ahn SG.
Effect of impression coping and implant angulation on the accuracy of implant impressions: an in vitro study. J Adv Prosthodont 2010;2:128-33.
21. Assuncao WG, Filho HG, Zaniquelli O. Evaluation of transfer impressions for osseointegrated implants at various angulations. Implant Dent 2004;13:358-66.
22. Conrad HJ, Pesun IJ, DeLong R, Hodges JS. Accura- cy of two impression techniques with angulated im- plants. J Prosthet Dent 2007;97:349-56.
23. Reddy S, Prasad K, Vakil H, Jain A, Chowdhary R.
Accuracy of impressions with different impression materials in angulated implants. Niger J Clin Pract 2013;16:279-84.
경사진 임플란트에서 임플란트 인상의 정확도 평가를 위한 역공학 기법
정홍택1·이기선2·송소연1·박진홍1·이정열1*
1고려대학교 구로병원 임상치의학연구소
2고려대학교 안산병원 치과보철과
목적: 본 연구의 목적은 (1) 기존에 존재하던 몇 가지 다른 임플란트 인상의 정확도 평가방 법들과 역공학 기술을 비교하고 (2) 역공학 기술로 임플란트 식립 방향 및 임플란트 인상 용 코핑의 종류에 따른 인상 채득의 정확도를 평가하는 것이다. 재료 및 방법: 임플란트 식 립 방향에 따른 세 가지 다른 마스터 모델을 제작하였고, 그 중 임플란트를 평행하게 식립 한 마스터 모델에서 두 임플란트 중심점 사이의 거리를 다음과 같은 세 가지 방법으로 측 정하였다 (디지털 캘리퍼를 이용한 측정 방법(그룹 DC), 광학 사진을 이용한 측정 방법(그 룹 OM) 및 역공학 기술을 이용한 측정 방법(그룹 RE)). 세 종류의 마스터 모델 별로 각각 세 가지 유형의 임프레션 코핑을 이용하여 인상을 채득한 후 총 90개의 실험 모델을 제작 하였으며 각 실험 모델들과 마스터 모델 간의 각도 및 거리의 오차율(error rate)을 계산 하였다. 세 가지 평가 방법 간의 비교에는 One-way ANOVA가 사용되었다 (P < .05). 각 실험 그룹들의 오차율은 two-way ANOVA를 이용하여 분석하였다 (P < .05). 결과: 그룹 DC의 오차율과 그룹 RE의 오차율 간에는 통계적으로 유의한 차이가 있었지만 (P < .05), 그룹 OM의 오차율을 다른 그룹들과 비교하였을 때는 통계적으로 유의한 차이가 없었다 (P > .05). 역공학 기술로 측정한 오차율의 표준 편차는 디지털 캘리퍼 및 광학 사진 측정 으로 계산한 오차율의 표준 편차보다 상당히 낮았다. 하이브리드 인상용 코핑 그룹은 거리 오차율에서 픽업 인상용 코핑 그룹과 큰 차이가 없었다 (P > .05). 결론: 본 실험을 통해 역 공학 기술이 임플란트 인상의 삼차원적인 정확도 평가 기법으로서의 잠재력이 있음을 확 인하였다. (대한치과보철학회지 2021;59:261-70)
주요단어
디지털측정방법; 하이브리드 인상용 코핑; 경사진 임플란트; 역공학기술
교신저자 이정열
08305 서울 구로구 구로동로 148 고려대학교 구로병원
02-2626-1922 [email protected]
원고접수일 2021년 2월 17일 원고최종수정일 2021년 3월 21일 원고채택일 2021년 3월 23일
© 2021 대한치과보철학회
cc 이 글은 크리에이티브 커먼즈 코리아 저작자표시-비영리 4.0 대한민국 라이선스에 따라 이용하실 수 있습니다.