• 검색 결과가 없습니다.

Sleep Quality Evaluation Using Self-Reported Questionnaires in Patients with Burning Mouth Syndrome JOMP

N/A
N/A
Protected

Academic year: 2021

Share "Sleep Quality Evaluation Using Self-Reported Questionnaires in Patients with Burning Mouth Syndrome JOMP"

Copied!
7
0
0

로드 중.... (전체 텍스트 보기)

전체 글

(1)

pISSN 2288-9272 eISSN 2383-8493 J Oral Med Pain 2016;41(4):188-194 https://doi.org/10.14476/jomp.2016.41.4.188

Sleep Quality Evaluation Using Self-Reported Questionnaires in Patients with Burning Mouth Syndrome

Jung-Yong Jin 1 , Kyung-Eun Lee 1,2 , Bong-Jik Suh 1,2

1 Department of Oral Medicine, School of Dentistry, Chonbuk National University, Jeonju, Korea

2 Institute of Oral Bioscience, School of Dentistry, Chonbuk National University, Jeonju, Korea

Received November 30, 2016 Revised December 16, 2016 Accepted December 16, 2016

Purpose: Burning mouth syndrome (BMS) is ambiguous and enigmatic oral condition. Sleep disturbance is one of the most prevalent complaints of patients with chronic pain. The aim of this study was to estimate general sleep characteristics and propensity in patients with BMS.

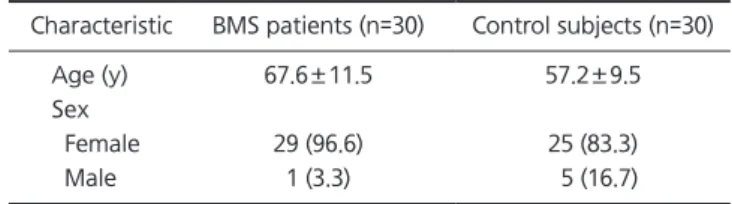
Methods: A total of thirty BMS patients and thirty healthy control subjects were investigated.

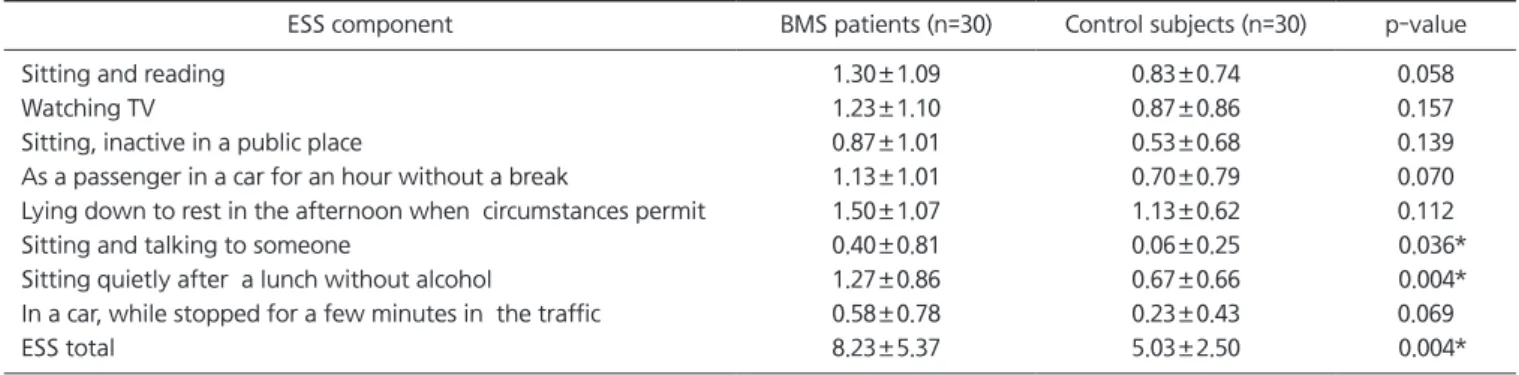
Self-reported measures of sleep quality were conducted using two widely used methods; the Pittsburgh Sleep Quality Index (PSQI) and Epworth Sleepiness Scale (ESS). Data were analyzed with one-way ANOVA , chi-square, Fisher’s exact test, Kruskal-Wallis test, Holm method with 95% confidence interval and p<0.05 significant level.

Results: BMS patients showed more poor sleepers than those in control subjects in both ESS and PSQI test. BMS patients also showed statistically significant poorer sleep quality compared with control subjects in both test. When BMS group were divided into three groups on the ba- sis of numeric rating scale, the higher score subjects had, the more mean rank they had in the PSQI.

Conclusions: BMS patients showed up poor sleep characteristics and propensity than control group, and they also showed the more severe the pain was, the worse the sleep quality was.

Key Words: Burning mouth syndrome; Epworth Sleepiness Scale; Pittsburg Sleep Quality Index

Correspondence to:

Jung-Yong Jin

Department of Oral Medicine, Chonbuk National University Dental Hospital, 20 Geonji-ro, Deokjin-gu, Jeonju 54907, Korea

Tel: +82-63-250-2044 Fax: +82-63-250-2058 E-mail: [email protected]

JOMP Journal of Oral Medicine and Pain

Copyright Ⓒ 2016 Korean Academy of Orofacial Pain and Oral Medicine. All rights reserved.

CC

This is an open-access article distributed under the terms of the Creative Commons Attribution Non-Commercial License (http://creativecommons.org/licenses/by-nc/4.0/),

INTRODUCTION

Burning mouth syndrome (BMS) is chronic pain syn- drome that occasionally affects middle-aged women with tongue or other oral sites. 1) Etiopathogenesis of BMS is still unknown and has controversy among studies. Although, there are many studies about this syndrome, a universal- ly accepted definition of this syndrome still is lacking. 2,3) According to International Association for the Study of Pain, BMS is chronic oral mucosal pain or discomfort that has no identifiable causative lesions and is not caused by any other condition or disease. 4) The 10th version of International Classification of Diseases of the World Health Organization uses the term glossodynia (K14.6) which

describes painful sensations in tongue. 5)

A major problem in diagnosing BMS is that this syn- drome is defined by symptoms that can arise from other local or systemic disease, and it makes difficulties in exact diagnosis and appropriate management of BMS. Prevalence of BMS had been large range from 0.7% to 4.6% in previ- ous study. 6) However, Scala et al. 2) reported that this syn- drome was more widespread than was estimated around the world.

BMS patients have sensory symptoms that represent by

burning sensation, a foreign body sensation, and oral dry-

ness involving tongue, lips, hard palate, cheeks, and floor of

the mouth. Some patients can experience other symptoms,

such as dysgeusia, chemo-sensory abnormalities and mood

(2)

changes while they awake. However, clinicians cannot find clinical problems in oral cavity at ordinary circumstances. 7) The symptoms tend to continue for at least 4-6 months, and it ranges from minimal that just feel discomfort to severe that recognized all or almost all day long and that may sig- nificantly affect the patient’s quality of life. 6)

It was suggested that causes of BMS were consisted of lo- cal, systemic, and psychological factors, such as hyposaliva- tion, hormonal change, somatization, and so on. 7) However, multifactorial intervention, involving the interaction be- tween biological and psychological factors, was estimated to be best-described. 8) According to recent studies, Sleep disturbance was identified as one of powerful factor in ag- gravating pain, and those suggested that BMS patients had shown poor sleep quality and had suffered more depression and anxiety than healthy groups. 6,9,10)

It is well known that pain and sleep disorders are related to each other in many studies. Any painful condition dis- turbs sleep and impact on patient’s mood, energy and be- havior. 9) Previous studies reported that people with pain suffered difficulties in initiating and maintaining sleep and this disturbance of sleep condition could make patients un- dergo daytime-sleep and sleep break. 11,12) Though the precise functions of sleep remained a mystery, on the other way, it was thought that lack of sleep might be associated with in- creasing of pain sensitivity by peripheral and central ner- vous system changes. 13) It was also suggested that the pos- sibility that sleep disturbances could make preexisting pain worsen. 14,15) Patients with BMS often reported that the pain interfered with their ability to fall asleep. 16) Therefore, au- thors wondered that whether the relationship between BMS and sleep was or not.

In this study, authors investigated sleep quality in BMS patients by using relatively well-known self-questionnaires.

The aim of this study was to estimate general sleep charac- teristics and propensity in BMS patients.

MATERIALS AND METHODS

1. Patients Selection

This study sample was composed of thirty patients di- agnosed with BMS at the Department of Oral Medicine, Chonbuk National University Hospital (Jeonju, Korea) from

August 2015 to July 2016.

Diagnostic criteria of International Classification of Headache were used for diagnosis of BMS. In the clinical criteria included the following conditions: 1) the presence of an intraoral burning sensation or dysaesthetic sensation;

2) the absence of any abnormalities from clinical examina- tion; and 3) any type of oral symptom that can be persis- tent or intermittent with possible phase of remission/ex- acerbation during the day and state of being symptomatic is persistent typically more than 3 months. Patients with a local or systemic disorder known to attribute to secondary burning sensation were excluded. These disorders were the following diseases: candidiasis, lichen planus, medication- induced, anemia, deficiencies of vitamin B12 or folic acid, and unregulated diabetes. 17)

Control group was composed of thirty patients attending the department of prosthodontics for implant treatment or patients’ companions during the study period. The inclu- sion criteria for control subjects were 1) the absence of oral mucosal lesion; 2) the absence of oral pain; 3) no history of psychiatric disorders; and 4) no dental disease to be treated.

Conversely, the exclusion criteria encompassed 1) patients with unstable medical conditions or debilitating patholo- gies, such as cancer or autoimmune disease and 2) patients regularly treated with anxiolytic, antidepressants, anticon- vulsants, and/or psychotropic drugs.

2. Data Collection

A total of thirty patients with BMS and thirty control subjects who fulfilled the inclusion criteria were investi- gated. BMS patients and healthy controls were assessed in accordance with the following evaluation battery scales for self-reported measures of sleep quality, disturbance and propensity: the Pittsburgh Sleep Quality Index (PSQI) 18) and the Epworth Sleepiness Scale (ESS) 19) for sleep disturbance.

1) The Pittsburgh Sleep Quality Index (PSQI)

The PSQI is considered an essential measure of sleep and

insomnia symptoms in treatment research. It is a self-re-

port questionnaire assessing sleep quality and disturbances

and is designed to be used in clinical populations. This in-

strument comprises 19 items, generating seven compo-

nent scores: subjective sleep quality, sleep latency, sleep

(3)

duration, habitual sleep efficiency, sleep disturbances, use of sleep medication, and daytime dysfunction. Sleep pat- tern data (e.g., bed time, wake time, sleep onset latency, and sleep quantity) are also provided. Each item is scored from o to 3, with higher scores indicating poorer sleep or more frequent sleep problems. Items are combined to yield the 7 components (scores ranging from 0 to 3) and the sum of the score ranging from 0 to 21. Global scores above 6 distin- guish poor sleepers from good sleepers with a high sensitiv- ity (90% to 99%) and specificity (84% to 87%). 18) The PSQI has been translated into 48 languages and has been used in a wide range of population-based and clinical studies. 6) In this study, Korean version of the PSQI was used. 20)

2) The Epworth Sleepiness Scale (ESS)

The ESS is simple, self-administered questionnaire that provides a measurement of the subject’s general level of day-time sleepiness. It comprises eight items assessing the propensity for sleep in eight common situations. Subjects rate their likelihood of dozing in each situation on a scale of 0 to 3. A score of 0 is ‘no dozing’, 2 is ‘slight chance of dozing’, 2 is ‘moderate chance of dozing’, and 3 is ‘high chance of dozing’.

The ESS score is the sum of the eight items. The ratings can be added together to form a total score of 24. A score of 0-9 is considered normal. A score of 11-15 indicates the possibility of slight to moderate sleep apnea, while a score of over 16 indicated severe sleep apnea or narcolepsy. Total score over 11 distinguish poor sleepers from good sleep- ers. 19) The ESS has been translated into 52 languages and also been used in a wide range of population-based and clinical studies. 6) In this study, Korean version of the ESS was used. 21)

3. Data Analysis

At First, Mean scores of each seven component of the PSQI were calculated for comparison of sleep quality and disturbance in both BMS patients and control group.

Subjects of each group were classified to good sleeper (global scores less than 6) and poor sleeper (global scores above 6) according to cutoff recommended in the PSQI and calculat- ed the numbers of good and poor sleeper.

Secondly, mean scores of each eight item of the ESS

were calculated for comparison of day-time sleepiness in both groups. Subjects of each group were classified to good sleeper (ESS <11) and poor sleeper (ESS ≥11) according to cutoff recommended in the ESS and calculated the numbers of good and poor sleeper.

At third, BMS patients were divided into three groups on the basis of numeric rating scale (NRS) and evaluated rela- tionship between NRS and the PSQI score and between NRS and the ESS score. The one group was that range of NRS was 1 to 3 (mild). Another group was that NRS was from 4 to 6 (moderate), while the other group was NRS was from 7 to 10 (severe).

4. Statistical Analysis

Stastical test was done at the 5% significant level.

Statistical calculations were performed with the IBM SPSS Statistics version 20.0 (IBM Co., Armonk, NY, USA).

The one-way ANOVA was used for comparison of mean scores of seven components in the PSQI and of eight items in the ESS between BMS and control group. The chi-square test was used for comparison of good sleeper and poor sleeper in the PSQI and Fisher’s exact test was for that in the ESS. The Kruskal-Wallis tests were used to examine the association of between NRS and the PSQI score and be- tween NRS and the ESS score. The post-hoc test was ob- tained from Holm method.

RESULTS

The characteristics of each group were showed. The subjects were 29 women and 1 man with a mean age of 67.6±11.5 years in BMS group; 25 women and 5 men with a mean age of 57.2±9.5 years in control group (Table 1).

Table 2 showed the scores for the seven components

Table 1. Demographic findings in BMS and control groups Characteristic BMS patients (n=30) Control subjects (n=30)

Age (y) 67.6±11.5 57.2±9.5

Sex

Female 29 (96.6) 25 (83.3)

Male 1 (3.3) 5 (16.7)

BMS, burning mouth syndrome.

Values are presented as mean±standard deviation or number (%).

(4)

of the PSQI in both BMS and control group. The results showed that scores differed between the groups and those of BMS group presented high score in subjective sleep qual- ity, use of sleep medication and day time dysfunction com- ponents among seven components of PSQI with statistically difference in comparison with the control group. The PSQI global index score was also higher in BMS group than in control with statistically difference (Table 2).

BMS patients and control subjects were classified into good sleeper and poor sleeper according to cutoff score rec- ommended in the PSQI (6 points and over). Poor sleepers in BMS patients were more than those in control subjects. Out of thirty BMS patients, the incidence of poor sleeper (66.7%, 20 persons) was higher than that of good sleeper (33.3%, 10 persons). Conversely, the incidence of poor sleeper (40.0%, 12 persons) was lower than that of good sleeper (60.0%, 18

Table 2. Comparison of the PSQI scores between BMS and control group

PSQI component BMS patients (n=30) Control subjects (n=30) p-value

PSQ 1 subjective sleep quality 1.40±0.77 0.93±0.69 0.016*

PSQ 2 sleep latency 1.60±1.00 1.63±1.00 0.898

PSQ 3 sleep duration 0.93±0.87 0.93±0.91 >0.999

PSQ 4 habitual sleep efficiency 0.63±0.89 0.40±0.86 0.305

PSQ 5 sleep disturbances 0.70±0.84 0.47±0.63 0.227

PSQ 6 use of sleep medication 0.80±1.21 0.07±0.25 0.002*

PSQ 7 daytime dysfunction 1.10±0.76 0.70±0.70 0.038*

PSQ total 7.17±3.26 5.13±2.26 0.012*

BMS, burning mouth syndrome; PSQI, Pittsburgh Sleep Quality Index.

Values are presented as mean±standard deviation.

p-values were obtained from one-way ANOVA.

*p<0.05.

Table 3. Comparison of good sleeper and poor sleeper in PSQI between BMS and control group

Group BMS patients (n=30) Control subjects (n=30) p-value

Good sleeper (PSQI <6) 10 (33.3) 18 (60.0)

0.038*

Poor sleeper (PSQI ≥6) 20 (66.7) 12 (40.0)

PSQI, Pittsburgh Sleep Quality Index; BMS, burning mouth syndrome.

Values are presented as number (%).

p-value was obtained from chi-square test.

*p<0.05

Table 4. Comparison of the ESS scores between BMS and control group

ESS component BMS patients (n=30) Control subjects (n=30) p-value

Sitting and reading 1.30±1.09 0.83±0.74 0.058

Watching TV 1.23±1.10 0.87±0.86 0.157

Sitting, inactive in a public place 0.87±1.01 0.53±0.68 0.139

As a passenger in a car for an hour without a break 1.13±1.01 0.70±0.79 0.070

Lying down to rest in the afternoon when circumstances permit 1.50±1.07 1.13±0.62 0.112

Sitting and talking to someone 0.40±0.81 0.06±0.25 0.036*

Sitting quietly after a lunch without alcohol 1.27±0.86 0.67±0.66 0.004*

In a car, while stopped for a few minutes in the traffic 0.58±0.78 0.23±0.43 0.069

ESS total 8.23±5.37 5.03±2.50 0.004*

ESS, Epworth Sleepiness Scale; BMS, burning mouth syndrome.

Values are presented as mean±standard deviation.

p-values were obtained from one-way ANOVA.

*p<0.05.

(5)

persons) in control group. BMS group also showed statisti- cally significant poor sleeper compared with control in the PSQI (p=0.038) (Table 3).

The scores of eight items in ESS were showed. BMS group had higher scores than control, especially in 6th and 7th items. Total mean index of items presented high score in BMS group than in control with statistically difference (Table 4).

BMS patients and control subjects were classified into good sleeper and poor sleeper according to cutoff score rec- ommended in the ESS (11 points and over). Out of thirty BMS patients, the incidence of poor sleeper (30.0%, 9 per- sons) was lower than that of good sleeper (70.0%, 21 per- sons). The incidence of poor sleeper (3.3%, 1 persons) was also lower than that of good sleeper (96.7%, 29 persons) in control. Although incidence of poor sleeper was lower than that of good sleeper in using the ESS, the BMS patients also showed statistically significant poor sleeper compared with control subjects in ESS (p=0.012) (Table 5).

When BMS group were divided into three groups on the basis of NRS, the higher score subjects had, the more mean rank they had in the PSQI (Table 6).

DISCUSSION

The authors investigated general characteristics be- tween two groups. The mean age of the subjects with the BMS was 67.6 years old and 96.6% were females (Table 1). These results were similar with previous studies in the literature which reported the predilection of BMS for fe- males of middle and advanced ages. 22,23) In this study, five component scores of BMS group, except sleep latency and sleep duration, were higher and total score also was signifi- cant higher than control group in the PSQI (Table 2). BMS group showed higher scores in almost items and significant higher total score than control group in the ESS (Table 4).

BMS group also showed statistically significant poor sleeper compared with control in both the PSQI and the ESS (Tables 3, 5). Therefore, it was thought that BMS patients had poor- er sleep quality and sleep disturbance and propensity of day-time sleepiness. This study suggested that BMS patients exhibited more sleep disorders compared with the healthy groups.

These results were similar with previous studies. 6,10,24) Adamo et al. 6) showed that BMS patients reported a great- er degree of sleep disorders as compared with controls, and sleep disorders could influence quality of life of BMS.

Chainani-Wu et al. 10) demonstrated that BMS patients

Table 5. Comparison of good sleeper and poor sleeper in ESS between BMS and control group

Group BMS patients (n=30) Control subjects (n=30) p-value

Good sleeper (ESS <11) 21 (70.0) 29 (96.7)

0.012*

Poor sleeper (ESS ≥11) 9 (30.0) 1 (3.3)

ESS, Epworth Sleepiness Scale; BMS, burning mouth syndrome.

Values are presented as number (%).

p-value was obtained from Fisher’ s exact test.

*p<0.05.

Table 6. Evaluation of relationship between NRS and the PSQI rank in BMS patients (n=30)

Group (NRS) No. of patients PSQI

p-value Post-hoc

Mean rank

1. Mild (1-3) 11 13.7

0.036* 1, 2<3

2. Moderate (4-6) 16 14.3

3. Severe (7-10) 3 27.8

NRS, numeric rating scale; PSQI, Pittsburgh Sleep Quality Index; BMS, burning mouth syndrome.

p-value was obtained from Kruskal-Wallis test.

The post-hoc test was obtained from Holm method.

*p<0.05.

(6)

reported a greater degree of sleep problems and suggested that sleep dysfunction could be a risk factor for BMS. Lee et al. 24) investigated the correlations between BMS patient and sleep disorders by cohort study and described that sleep dis- order might be risk factors of BMS.

Smith and Haythornthwaite 25) suggested that there were aspects of the pain and sleep disturbance relationship, which might be specific to degree of pain. In this study, the group with severe pain tended to have a significantly lower quality of sleep than other groups in the PSQI (Table 6) but ESS result was different (Table 7). It is thought that active treatment of sleep disturbance might affect the improve- ment of pain, as they suggested. 25)

As BMS patient tend to be chronic pain and to have the biopsychosocial changes often, treatments and study had been described with the aim of minimize symptoms. 26) Therefore, multifaceted efforts including sleep quality eval- uation also needed to establish treatment plan, in addition to behavioral modification therapy, relaxation programs, exercise programs and self-management strategies. 27,28)

The instruments that evaluate the quality of sleep are uti- lized to measure the effects of poor sleep in subjects and to better understand how sleepiness interferes with day time activities, identifying specific strategies for the management of these individuals. 21,29) Self-reported questionnaires meth- ods have benefit to demand less time and effort for reply than other complex methods. The most of subjects in this study did not show difficulty in responding to the question- naires, and they spend time from 5 to 10 minutes to reply.

Two methods in this study are widely used in many previ- ous studies for evaluate sleep quality. 18,20,30) However, au- thors had some obstacles by low understanding and cogni- tive ability of subjects when these questionnaires were used to older subjects (over 65 years old). Also this study had

limitation with a little of population in test. Therefore, there are necessary of other studies with larger samples to clarify this result, and further studies should try to understand re- lationships between sleep disturbances and physiological information of BMS.

Study of sleep disturbance in BMS patients is important to understand the effect of this syndrome on the essen- tial activity. 31) By this way, clinicians can approach patients from more multiple sides. This study confirmed the cor- relation of sleep disturbance and BMS patients. Based on the methods used in this study, it can be concluded that:

1) BMS patients showed up poor sleep quality than con- trol group; 2) BMS patients had more propensities in sleep medication use and daytime dysfunction in the PSQI test; 3) BMS patients had more experienced about day-time sleepi- ness in the ESS; and 4) The more pain the patients felt, the lower quality of sleep they had.

Therefore, we suggest that BMS patients were thought to have poor sleep propensity, and evaluation of sleep distur- bance should be encouraged to undermine and minimize the symptoms of BMS.

CONFLICT OF INTEREST

No potential conflict of interest relevant to this article was reported.

REFERENCES

1. Gorsky M, Silverman S Jr, Chinn H. Clinical characteristics and management outcome in the burning mouth syndrome.

An open study of 130 patients. Oral Surg Oral Med Oral Pathol 1991;72:192-195.

2. Scala A, Checchi L, Montevecchi M, Marini I, Giamberardino MA.

Update on burning mouth syndrome: overview and patient man- Table 7. Evaluation of relationship between NRS and the ESS rank in BMS patients (n=30)

Group (NRS) No. of patients ESS

p-value Mean rank

1. Mild (1-3) 11 20.5

0.059

2. Moderate (4-6) 16 12.5

3. Severe (7-10) 3 13.0

NRS, numeric rating scale; ESS, Epworth Sleepiness Scale; BMS; burning mouth syndrome.

p-value was obtained from Kruskal-Wallis test.

(7)

agement. Crit Rev Oral Biol Med 2003;14:275-291.

3. Patton LL, Siegel MA, Benoliel R, De Laat A. Management of burning mouth syndrome: systematic review and management recommendations. Oral Surg Oral Med Oral Pathol Oral Radiol Endod 2007;103 Suppl:S39.e1-S39.e13.

4. International Association for the Study of Pain (IASP). Global year against pain, 2013-2014 orofacial pain [Internet]. Washing- ton (DC): International Association for the Study of Pain; c2016 [cited 2016 Nov 10]. Available from: http://www.iasp-pain.org/

Advocacy/GYAP2016Detail.aspx?ItemNumber=5573.

5. World Health Organization (WHO). ICD-10 version:2016 [Inter- net]. Geneva: World Health Organization; c2016 [cited 2016 Nov 10]. Available from: http://apps.who.int/classifications/icd10/

browse/2016/en#/K14.6.

6. Adamo D, Schiavone V, Aria M, et al. Sleep disturbance in pa- tients with burning mouth syndrome: a case-control study. J Orofac Pain 2013;27:304-313.

7. Klasser GD, Grushka M, Su N. Burning mouth syndrome. Oral Maxillofac Surg Clin North Am 2016;28:381-396.

8. Lopez-Jornet P, Lucero-Berdugo M, Castillo-Felipe C, Zamora Lavella C, Ferrandez-Pujante A, Pons-Fuster A. Assessment of self-reported sleep disturbance and psychological status in pa- tients with burning mouth syndrome. J Eur Acad Dermatol Vene- reol 2015;29:1285-1290.

9. Kang JK, Lim HD, Lee YM. Association between sleep quality and psychologic factors among university students in Korea. J Oral Med Pain 2008;33:257-267.

10. Chainani-Wu N, Madden E, Silverman S Jr. A case-control study of burning mouth syndrome and sleep dysfunction. Oral Surg Oral Med Oral Pathol Oral Radiol Endod 2011;112:203-208.

11. Moldofsky H. Sleep and pain. Sleep Med Rev 2001;5:387-398.

12. Lee YM. Relationship of orofacial pain and sleep quality. J Oral Med Pain 2006;31:91-99.

13. Lim HD, Lee YM. Review about effects of sleep disturbances on burning mouth syndrome. J Oral Med Pain 2013;38:313-318.

14. Beck SL, Dudley WN, Barsevick A. Pain, sleep disturbance, and fatigue in patients with cancer: using a mediation model to test a symptom cluster. Oncol Nurs Forum 2005;32:542.

15. Alsaadi SM, McAuley JH, Hush JM, Maher CG. Prevalence of sleep disturbance in patients with low back pain. Eur Spine J 2011;20:737-743.

16. Grushka M, Epstein JB, Gorsky M. Burning mouth syndrome. Am Fam Physician 2002;65:615-620.

17. Headache Classification Committee of the International Headache

Society (IHS). The International Classification of Headache Disor- ders, 3rd edition (beta version). Cephalalgia 2013;33:629-808.

18. Buysse DJ, Reynolds CF 3rd, Monk TH, Berman SR, Kupfer DJ.

The Pittsburgh Sleep Quality Index: a new instrument for psychi- atric practice and research. Psychiatry Res 1989;28:193-213.

19. Johns MW. A new method for measuring daytime sleepiness: the Epworth sleepiness scale. Sleep 1991;14:540-545.

20. Choi H, Kim SJ, Kim B, Kim I. Korean versions of self-reported sleep questionnaires for research and practice on sleep distur- bance. Korean J Rehabil Nurs 2012;15:1-10.

21. Cho YW, Lee JH, Son HK, Lee SH, Shin C, Johns MW. The reli- ability and validity of the Korean version of the Epworth sleepi- ness scale. Sleep Breath 2011;15:377-384.

22. Sun A, Wu KM, Wang YP, Lin HP, Chen HM, Chiang CP. Burn- ing mouth syndrome: a review and update. J Oral Pathol Med 2013;42:649-655.

23. Fortuna G, Di Lorenzo M, Pollio A. Complex oral sensitivity dis- order: a reappraisal of current classification of burning mouth syndrome. Oral Dis 2013;19:730-732.

24. Lee CF, Lin KY, Lin MC, Lin CL, Chang SN, Kao CH. Sleep disor- ders increase the risk of burning mouth syndrome: a retrospective population-based cohort study. Sleep Med 2014;15:1405-1410.

25. Smith MT, Haythornthwaite JA. How do sleep disturbance and chronic pain inter-relate? Insights from the longitudinal and cognitive-behavioral clinical trials literature. Sleep Med Rev 2004;8:119-132.

26. Finan PH, Goodin BR, Smith MT. The association of sleep and pain: an update and a path forward. J Pain 2013;14:1539-1552.

27. Breslau N, Roth T, Rosenthal L, Andreski P. Sleep disturbance and psychiatric disorders: a longitudinal epidemiological study of young adults. Biol Psychiatry 1996;39:411-418.

28. Barker KE, Savage NW. Burning mouth syndrome: an update on recent findings. Aust Dent J 2005;50:220-223.

29. Johns MW. Sensitivity and specificity of the multiple sleep la- tency test (MSLT), the maintenance of wakefulness test and the epworth sleepiness scale: failure of the MSLT as a gold standard.

J Sleep Res 2000;9:5-11.

30. Burkhalter H, Serina SM, Engberg S, Wirz-justice A, Steiger J, De Geest S. Structure validity of the Pittsburg sleep quality index in renal transplant recipients: a confirmatory factor analysis. Sleep Biol Rhythm 2010;8:274-281.

31. Lee JS, Jeong DU. Sleep and pain. Sleep Med Psychophysiol

2012;19:63-67.

수치

Table 2 showed the scores for the seven components
Table 4. Comparison of the ESS scores between BMS and control group
Table 6. Evaluation of relationship between NRS and the PSQI rank in BMS patients (n=30)

참조

관련 문서

Results: In this research, in the group with fibromyalgia patients group, systemic lupus erythematosus patients group and without systemic autoimmune

The change in active oxygen was decreased after exercise in the exercise group than in the control group, and there was a statistically significant

Competence had a positive (+) influence on satisfaction with human relationships and self-confidence also had the positive (+) influence. However, in attractiveness,

Serum uric acid levels and risk for vascular disease in patients with metabolic syndrome... Prevalence if the metabolic syndrome in a Turkish

The AST levels in the male KRG administration group at 4 and 8 mo decreased sig- nificantly compared to the control group (p &lt; 0.05), and there was no significant

In the graft group, the weights of adipose tissue were significantly increased, compared to the contralateral control in both 3-and 7-day ( p &lt; 0.05) (Table 1, Fig..

In elderly metastatic colon cancer patients, the treatment results of combination therapy with targeted treatment showed similar results to those reported in clinical trials

Associations among variables related with pain-related TMD and sleep apnea The number of active TrPs in the masticatory muscles showed significant interactions with variety