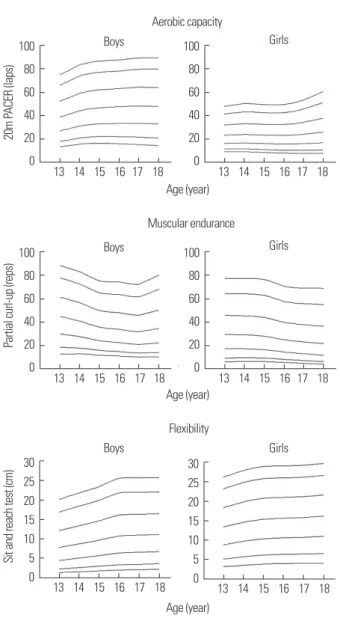
Physical Fitness Levels in Korean Adolescents: The National Fitness Award Project
10
0
0
전체 글
(2)
(3)
(4)
(5)
(6)
(7)
(8)
(10)
수치


+2

관련 문서
The purpose of this case study was to find comparison of sports related physical fitness and anaerobic power changes of college hockey players and
The purpose of this study is to investigate how participation in 8-week swimming and resistance exercise programs affects changes in health fitness and
In the change of functional fitness, muscle strength and endurance, cardiopulmonary endurance, wits, and flexibility showed significantly increased results,
The purpose of this study was to investigate the change of body composition and physical fitness after 12 weeks of practice with middle-aged women centered
Physical fitness changes on college students who played ultimate frisbee showed increases in muscular strength, muscle endurance(, cardiopulmonary endurance,
The purpose of this study is to analyze the thesis that Taekwondo poomsae has positive effects on Physical Fitness of Students with Intellectual
In conclusion, it was confirmed that the winter training program is an effective exercise program by inducing positive changes in the physical fitness and
In the exercise group health related fitness factors, cardiorespiratory endurance, muscular strength, muscular endurance, flexibility, showed statistically significant
