DOI : 10.3341/jkos.2007.48.10.1379
녹내장은 시신경과 망막신경섬유층에 특징적인 손상 으로 인해 시야장애를 일으키는 진행성 시신경병증으로 조기 발견하여 적절히 치료하지 않으면 심한 경우 실명 에 이르는 질환이다.1 녹내장은 망막신경절세포의 손상 으로 인해 망막시신경섬유층의 두께가 감소하며, 이러 한 변화는 시신경의 변화보다 선행하고 시야결손은 망 막신경절세포의 축삭이 40% 가량 소실되기 전까지는 나타나지 않는다고 알려져 있다.2-5
따라서 시신경검사와 시야검사가 녹내장의 진단과 경과관찰에 전통적인 중요한 검사이지만, 망막신경섬유 층의 검사는 녹내장을 조기에 발견하는데 이들 검사보 다 더 유용한 검사라고 할 수 있다.2
이러한 망막신경섬유층의 검사는 전통적으로 Red free photography를 이용하지만 백내장 같은 매체혼
탁이 있는 경우, 고도근시가 있는 경우 검사가 쉽지 않 으며 해석이 주관적이고 정량적 계측이 불가능하다는 단점이 있다. 최근에 많은 연구자들에 의해서 시신경과 망막신경섬유층 두께의 정량적으로 계측하는 방법이 연 구되고 많은 장비들이 개발되었다.
빛간섭단층촬영(Optical coherence tomography, OCT)은 초음파와 비슷한 원리지만 초음파 대신 레이 저를 이용하며, 각각의 망막층에서 반사되는 광선의 시 간적 차이를 간섭계를 이용하여 망막의 층간 구조를 8~10 µm의 축해상력으로 영상화한 비침습적인 장비 이다. 망막의 단층상을 직접 측정할 수 있어 기준면을 필요로 하지 않으며 굴절이상과 안축장에 영향을 받지 않고, 백내장의 핵경화에도 영향을 받지 않는 것으로 알려져 있다.6 또한 여러 보고에서 재현성이 입증되었 고 시야검사와도 높은 상관관계를 보이는 것으로 알려 져 있다.7
빛간섭단층촬영을 이용하여 시신경유두형태와 망막 신경섬유두께의 변화를 정량적으로 측정하면 시신경과 망막신경섬유의 녹내장성 변화를 시야검사나 전통적인 시신경검사에서보다 조기에 발견할 수 있고 경과관찰에 도 유용한 정보를 얻을 수 있다. 그러나 망막신경섬유 두께는 인종에 따라 차이가 있다고 알려져 있고8-10 또
빛간섭단층촬영을 이용한 정상, 녹내장의증, 초기 녹내장에서의 변수 비교분석
박수은․정진권․정지용․박성희 순천향대학교 의과대학 안과학교실
목적 : 빛간섭단층촬영을 이용하여 초기 녹내장군, 녹내장의증군 그리고 연령을 조정한 정상대조군에서 시신경유두분
석지표와 망막신경섬유분석지표를 세 군 간에 비교분석하고 어떤 지표가 정상과 초기 녹내장을 구분하는데 유용한지 알아보고자 하였다.
대상과 방법 : 빛간섭단층촬영과 Humphrey 자동시야검사를 시행한 정상대조군 102안, 녹내장의증군 72안, 초기
녹내장군 85안을 후향적으로 조사하여 시신경유두분석, 망막신경섬유분석의 지표를 비교분석하였다.
결과 : 시신경유두분석지표와 망막신경섬유분석지표의 Area under the receiver operating characteristic (AUROC) curve는 각각 0.637~0.753, 0.506~0.759이었다. 정상과 초기 녹내장을 구분하는데 있어서 AUROC curve가 가장 넓은 지표는 망막신경섬유분석지표의 average thickness로 cut off value 92.17 µm에서 민감도 49.4%, 특이도 93.1%이었다.
결론 : 빛간섭단층촬영은 정상과 초기 녹내장을 구분하는데 있어 비교적 높은 민감도와 특이도를 가지고 있어 녹내장 을 조기진단하고 경과 관찰하는 데 도움을 줄 수 있을 것으로 생각된다.
<한안지 48(10):1379-1387, 2007>
<접수일 : 2007년 1월 31일, 심사통과일 : 2007년 7월 4일>
통신저자 : 박 성 희
서울시 용산구 한남동 657 순천향대학교병원 안과
Tel: 02-709-9354, Fax: 02-978-7797 E-mail: [email protected]
한 장비자체의 정상치가 주로 서양인을 대상으로 한 것 이어서 한국인에게 바로 적용하는 것은 무리가 있을 것 이라 생각된다.
따라서 저자는 한국인을 대상으로 빛간섭단층촬영을 이용하여 정상대조군, 녹내장의증군, 평균 MD (mean deviation)가 -6dB보다 큰 초기 녹내장군의 시신경 유두분석지표와 망막신경섬유분석지표를 세 군 간에 비 교분석하여 어떤 지표가 녹내장을 조기진단 하는데 유 용한 지 알아보고자 하였다.
대상과 방법
순천향대학교 서울병원을 방문하여 녹내장, 녹내장의증, 정상으로 진단 받은 환자 중 2003년 10월부터 2004년 9월까지 빛간섭단층촬영(Stratus OCT, software ver. 3.0, Carl Zeiss Meditec Inc, Dubin, CA, U.S.A.)와 Humphrey 자동시야검사(Humphrey field analyzer, Allergan Humphrey Ins. U.S.A.) 를 시행한 환자를 대상으로 후향적으로 조사하였다. 모 든 대상군은 최대교정시력이 0.5이상이고 굴절이상이 4디옵터 이내로 검사에 영향을 미칠 수 있는 백내장이 나 유리체혼탁 등 다른 안질환이나 외상, 신경학적 질 환이 없는 환자를 대상으로 하였다. 모든 대상군은 시 력검사, 굴절검사, 세극등검사, 안압측정, 안저검사, 전 방각검사와 같은 전반적인 안과 검사를 시행하였다.
대상군과 나이를 맞춘 정상대조군은 녹내장의 가족 력이 없으며 골드만 압평안압계를 사용하여 여러 번 측 정한 안압이 항상 21 mmHg이하이고, 녹내장성 시신 경 변화가 없고, Humphrey 자동시야검사에서 정상 소견을 보인 군을 대상으로 하였다. 녹내장의증군은 Humphrey 자동시야검사상 정상소견을 보이나 시신 경유두함몰비가 0.6보다 크거나 양안의 시신경유두함 몰비의 차가 0.2보다 큰 경우, 전반적 또는 국소적인 시신경테의 얇아짐, 시신경유두출혈과 같은 녹내장성 시신경병증의 소견이 있는 군으로 정의하였다. 초기 녹 내장 환자는 Humphrey 자동시야검사상 녹내장성 시 야결손을 보이는 것과 동시에 녹내장성 시신경병증이 있는 군을 대상으로 하였다. 녹내장성 시야장애는 Humphrey 자동 시야계의 GHT (glaucoma hemifield test)가 비정상이거나, pattern deviation plot에서 궁상영역에 최소한 3개 이상의 점의 역치가 정상의 5%
미만에서 나타나고 그 중 한 점이 1%미만일 때로 정하 였고 시야결손의 지표인 MD값이 -6dB보다 큰 경우를 초기 녹내장으로 정의 하였다(Table 1).
시야검사는 Humphrey 자동시야계의 central 24-2 (SITA standard strategy) 프로그램을 사용하였으
며 주시상실, 가양성 반응 또는 가음성 반응이 20%를 초과하는 경우는 분석대상에서 제외하였고 빛간섭단층 촬영과 Humphrey 자동시야검사는 최대 1개월 이내 의 결과를 사용하였다. 빛간섭단층촬영시 피검자의 동 공은 5 mm이상이 되도록 하였으며 한명의 숙련된 검 사자에 의하여 검사를 시행하였다. 시신경유두분석 (Optic nerve head analysis, ONHA)은 Fast optic disc scan을 이용하였는데 이는 30도 간격의 6 개의 radial scan을 시행해서 프로그램에 의해 망막색 소상피층의 끝을 연결한 선과 평행하게 150 µm위에 가상의 선을 정한 후 그 아래를 시신경유두함몰로 위 를 시신경테로 정하였고, 이는 모두 자동으로 측정되었 다. 망막신경섬유분석(Retinal nerve fiber layer analysis, RNFLA)은 3.4 mm 지름의 원 모양으로 시신경유두 주위를 검사하여 상측을 12시, 비측을 3시, 하측을 6시, 이측을 9시로 정하여 시각으로 표현하였으 며 360도 검사부위를 4분원 하여 평균 망막 두께를 구 하였다.
세 군 간의 빛간섭단층촬영의 시신경유두분석과 망 막신경섬유분석 지표를 ANOVA를 이용하여 비교하였 고 군간 분석은 Tukey Kramer test를 이용하였다.
또한, Receiver operating characteristic (ROC) curve를 이용하여 정상대조군과 초기 녹내장을 판별하 는 데 가장 유용한 지표와 cut off value를 알아보았 다. 통계처리는 SPSS (Version 11.5 for Window) 프로그램을 사용하였다.
결 과
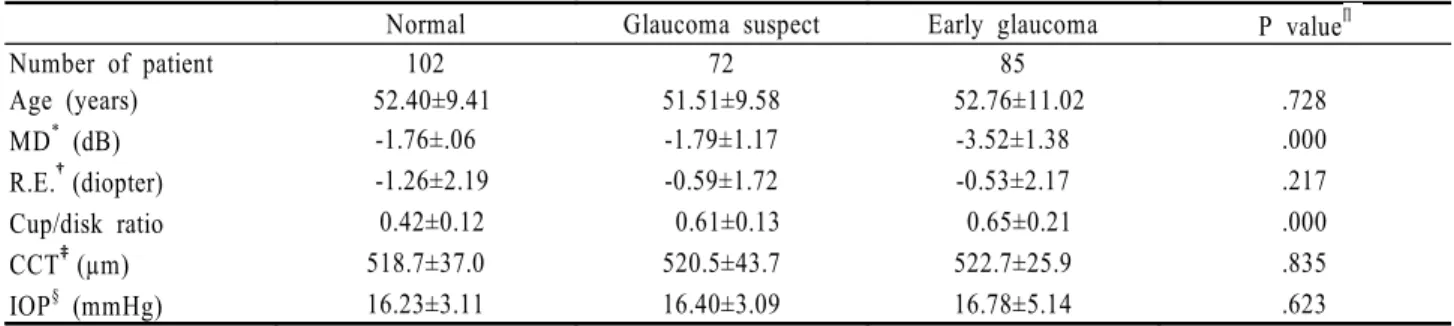
전체 193명 259안중 정상대조군 51명 102안, 녹내 장의증군 65명 72안, 초기 녹내장군 77명 85안이었 다. 평균나이는 정상대조군, 녹내장의증군 그리고 초기 녹내장군이 각각 52.4, 51.5, 52.7세로 세 군 간의 통 계적으로 유의한 차이(P>0.728)는 없었고 굴절이상, 중심각막두께, 그리고 안압도 유의한 차이가 없었다.
그러나 Humphrey 자동시야검사계의 MD (P<0.000) 와 시신경유두비(P<0.000)는 세 군 간에 통계학적으 로 유의한 차이가 있었다(Table 2).
시신경유두분석에서 정상대조군과 녹내장의증군간에 유의한 차이를 보이는 지표는 vertical integrated rim volume, cup/disk area ratio, cup/disk horizontal ratio, 그리고 cup/disk vertical ratio이었고 녹내장의 증군과 초기 녹내장군 사이에는 horizontal integrated rim area와 rim area간에 유의한 차이를 보였다. 정 상과 초기 녹내장군을 비교해보면 모든 parameter가 유의한 차이를 보였는데 neural rim에 관련된 parameter는
Table 1. Criteria for each subject Enrolled group Criteria
All subjects Best corrected visual acuity >0.5
Refractive error <4 diopter (Spherical equivalent)
No history of systemic disease, trauma, and secondary causes of glaucoma No significant cataract or vitreous opacity
Normal subject Intraocular pressure (IOP) ≤21 mmHg with repeated measure Normal finding on ocular examination
Absence of glaucomatous optic neuropathy (GON) defined as vertical cup/disk asymmetry between fellow eyes of 0.2 or less cup/disk ratio of 0.6 or less
Intact neural rim without peripapillary hemorrhages, notches, localized pallor, or RNFL (Retinal nerve fiber layer) defects Normal visual field defined as
mean deviation and pattern standard deviation within 95% confidence limits Glaucoma hemifield test (GHT): within normal limit
Glaucoma suspect Intraocular pressure (IOP) ≤21 mmHg with repeated measure Presence of glaucomatous optic neuropathy (GON)
Normal visual field (GHT: within normal limit or borderline) Early glaucoma Glaucomatous optic neuropathy plus
Glaucomatous visual field loss in the corresponding hemifield location Based on liberal criteria
GHT : outside normal limit
Mean deviation >-6dB in Humphrey field analyzer Enrolled group Criteria
All subjects Best corrected visual acuity >0.5
Refractive error <4 diopter (Spherical equivalent)
No history of systemic disease, trauma, and secondary causes of glaucoma No significant cataract or vitreous opacity
Normal subject Intraocular pressure (IOP) ≤21 mmHg with repeated measure Normal finding on ocular examination
Absence of glaucomatous optic neuropathy (GON) defined as vertical cup/disk asymmetry between fellow eyes of 0.2 or less cup/disk ratio of 0.6 or less
Intact neural rim without peripapillary hemorrhages, notches, localized pallor, or RNFL (Retinal nerve fiber layer) defects Normal visual field defined as
mean deviation and pattern standard deviation within 95% confidence limits Glaucoma hemifield test (GHT): within normal limit
Glaucoma suspect Intraocular pressure (IOP) ≤21 mmHg with repeated measure Presence of glaucomatous optic neuropathy (GON)
Normal visual field (GHT: within normal limit or borderline) Early glaucoma Glaucomatous optic neuropathy plus
Glaucomatous visual field loss in the corresponding hemifield location Based on liberal criteria
GHT: outside normal limit
Mean deviation > -6dB in Humphrey field analyzer
모두 초기 녹내장군에서 통계적으로 유의하게 저하되어 있었고 시신경유두함몰비와 관련된 지표는 모두 초기 녹내장군에서 통계적으로 유의하게 증가되어 있었다 (Table 3).
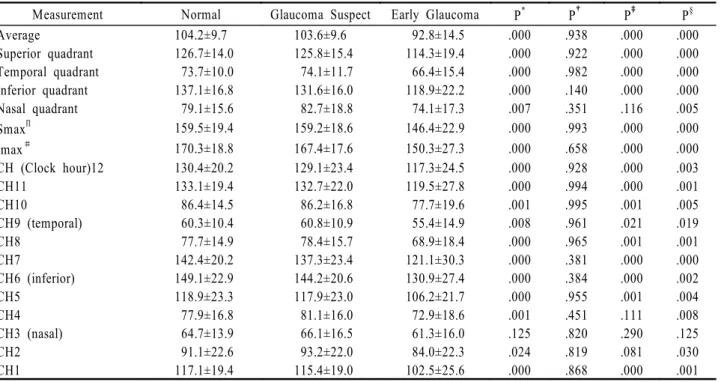
망막신경섬유두께분석에서 세 군간 비교에서는 3시 방향(비측)(P=0.125)을 제외한 모든 지표에서 통계 적으로 유의한 차이가 있었지만 군간 비교에서는 정상 대조군과 녹내장의증군 간에 유의한 차이를 보이는 항 목은 없었으며 정상대조군과 초기 녹내장군 비교 시 비 측 사분면, 2시, 3시, 그리고 4시를 제외한 모든 지표 에서 초기 녹내장군의 망막신경섬유두께가 통계적으 로 유의한 감소를 보였다. 녹내장의증군과 초기 녹내 장군 비교 시에는 3시 방향을 제외한 모든 지표가 초 기 녹내장군에서 통계적으로 유의하게 감소되어 있었 다(Table 4).
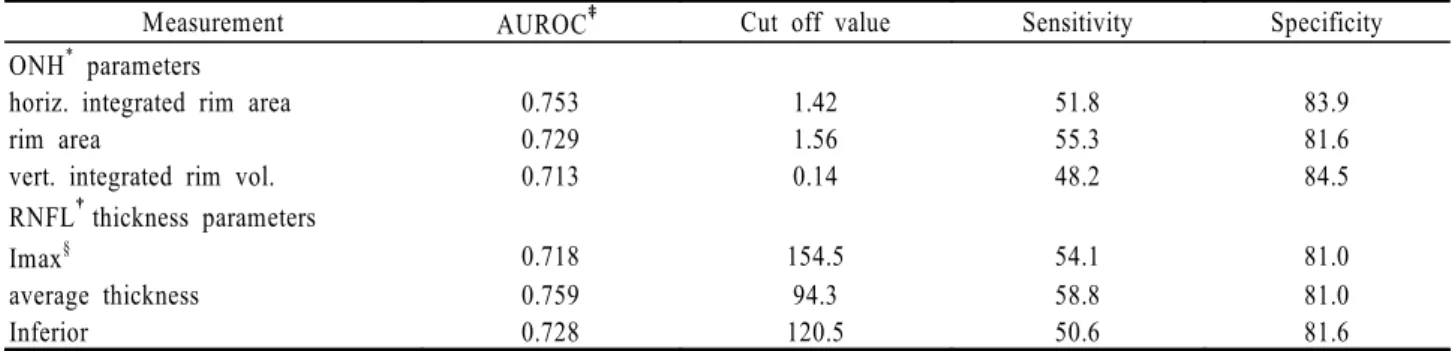
AUROC curve가 넓은 지표는 시신경유두분석에서 는 horizontal integrated rim area (0.753), rim area (0.729), vertical integrated rim volume (0.713)순이었고 망막신경섬유분석에서는 average
thickness (0.759), inferior thickness (0.728), Imax (0.718)순으로 나타났다. 목표 특이도를 90%
이상으로 하였을 때 결정되는 민감도는 시신경유두분석 의 horizontal integrated rim area는 47.1%, rim area는 45.9%, vertical integrated rim volume은 41.2%이었고, 망막신경섬유분석의 Imax 는 37.6%, average thickness는 50.6%, inferior thickness는 35.3%이었다. 목표 특이도를 80%이상으 로 하였을 때의 민감도는 시신경유두분석의 horizontal integrated rim area는 51.8%, rim area는 55.3%, vertical integrated rim volume은 48.2%이었고, 망막신경섬유분석의 Imax는 54.1%, average thickness 는 58.8%, inferior thickness는 50.6% 로 상승하 였다(Table 5, 6).
가장 넓은 AUROC curve를 보인 지표는 망막신경 섬유분석지표 average thickness로 cut off value 92.17 µm에서 민감도 49.4%, 특이도 93.1%이었고 시신경분석지표 horizontal integrated rim area 가 그 다음으로 cut off value 1.529 mm2에서 민감 Table 2. Backgrounds of subjects
Normal Glaucoma suspect Early glaucoma P valueΠ
Number of patient 102 72 85
Age (years) 52.40±9.41 51.51±9.58 52.76±11.02 .728
MD* (dB) -1.76±.06 -1.79±1.17 -3.52±1.38 .000
R.E.†(diopter) -1.26±2.19 -0.59±1.72 -0.53±2.17 .217
Cup/disk ratio 0.42±0.12 0.61±0.13 0.65±0.21 .000
CCT‡(µm) 518.7±37.0 520.5±43.7 522.7±25.9 .835
IOP§ (mmHg) 16.23±3.11 16.40±3.09 16.78±5.14 .623
MD*: mean deviation.
R.E.†: refractive error.
CCT‡: central corneal thickness.
IOP§: intraocular pressure.
P valueΠ: statistical significance was tested by ANOVA.
Table 3. Comparison of OCT measured optic nerve head (ONH) analysis parameter value among groups
Measurement Normal Glaucoma suspect Early glaucoma P*
vert. integrated rim vol. (mm3) 0.27±0.16 0.22±0.13 0.18±0.14 .000†
horiz. Integrated Rim Area (mm2) 1.62±0.20 1.60±0.21 1.39±0.24 .000‡
rim area (mm2) 1.54±0.35 1.44±0.33 1.20±0.45 .000‡
cup/disk area ratio 0.42±0.14 0.51±0.13 0.55±0.16 .000†
cup/disk horiz. ratio 0.69±0.15 0.76±0.12 0.78±0.13 .000†
cup/disk vert. ratio 0.59±0.13 0.66±0.10 0.68±0.14 .012†
P*: ANOVA, Tuckey‐Kramer test was performed in normal, glaucoma suspect, and early glaucoma patient.
†: Normal group significantly different from early glaucoma and glaucoma suspect groups.
‡: Early glaucoma group significantly different from normal and glaucoma suspect groups.
도 72.9%, 특이도 65.5%를 보였다(Fig. 1, 2).
고 찰
녹내장의 기본적인 병리학적 변화는 망막신경절세포 와 망막신경섬유의 손상으로, 녹내장을 진단하는 전통 적인 방법은 안압측정, 시야검사, 주관적인 시신경유두 검사 등이 있다. 안압은 녹내장의 중요한 위험인자의
하나이지만 나이, 인종, 각막두께에 따라 차이가 있고 일중변동이 있어서 진단적 가치는 감소되는 추세이다.
또한 망막신경섬유사진은 정성적이고 주관적인 검사방 법으로 정량적인 분석이 불가능하다. 시야검사는 통계 적인 연구가 충분히 이루어져 있지만 환자의 협조가 절 대적으로 필요하고 시신경 축삭의 손상이 어느 정도 진 행이 되어야 시야결손이 나타나 조기에 발견하는 데는 한계점이 있다.1-5 따라서 망막신경섬유층의 미세한 변 Table 5. Area under the receiver operating characteristic (AUROC) curve, best combination of sensitivity/specificity with specificity
≥90% for the individual OCT parameters detecting early glaucoma
Measurement AUROC‡ Cut off value Sensitivity Specificity
ONH* parameters
horiz. integrated rim area 0.753 1.35 47.1% 92.0%
rim area 0.729 1.11 45.9% 91.4%
vert. integrated rim vol. 0.713 0.13 41.2% 91.4%
RNFL†thickness parameters
Imax§ 0.718 144.5 37.6% 92.0%
average thickness 0.759 92.5 50.6% 92.0%
inferior 0.728 111.5 35.3% 93.7%
ONH*= optic nerve head; RNFL†= retinal nerve fiber layer; AUROC‡= area under the ROC curve; Imax§= Inferior maximum.
Table 4. Comparison of OCT measured retinal nerve fiber layer (RNFL) thickness (µm) analysis parameter value among groups
Measurement Normal Glaucoma Suspect Early Glaucoma P* P† P‡ P§
Average 104.2±9.7 103.6±9.6 92.8±14.5 .000 .938 .000 .000
Superior quadrant 126.7±14.0 125.8±15.4 114.3±19.4 .000 .922 .000 .000
Temporal quadrant 73.7±10.0 74.1±11.7 66.4±15.4 .000 .982 .000 .000
Inferior quadrant 137.1±16.8 131.6±16.0 118.9±22.2 .000 .140 .000 .000
Nasal quadrant 79.1±15.6 82.7±18.8 74.1±17.3 .007 .351 .116 .005
SmaxΠ 159.5±19.4 159.2±18.6 146.4±22.9 .000 .993 .000 .000
Imax# 170.3±18.8 167.4±17.6 150.3±27.3 .000 .658 .000 .000
CH (Clock hour)12 130.4±20.2 129.1±23.4 117.3±24.5 .000 .928 .000 .003
CH11 133.1±19.4 132.7±22.0 119.5±27.8 .000 .994 .000 .001
CH10 86.4±14.5 86.2±16.8 77.7±19.6 .001 .995 .001 .005
CH9 (temporal) 60.3±10.4 60.8±10.9 55.4±14.9 .008 .961 .021 .019
CH8 77.7±14.9 78.4±15.7 68.9±18.4 .000 .965 .001 .001
CH7 142.4±20.2 137.3±23.4 121.1±30.3 .000 .381 .000 .000
CH6 (inferior) 149.1±22.9 144.2±20.6 130.9±27.4 .000 .384 .000 .002
CH5 118.9±23.3 117.9±23.0 106.2±21.7 .000 .955 .001 .004
CH4 77.9±16.8 81.1±16.0 72.9±18.6 .001 .451 .111 .008
CH3 (nasal) 64.7±13.9 66.1±16.5 61.3±16.0 .125 .820 .290 .125
CH2 91.1±22.6 93.2±22.0 84.0±22.3 .024 .819 .081 .030
CH1 117.1±19.4 115.4±19.0 102.5±25.6 .000 .868 .000 .001
SmaxΠ= Superior maximum; Imaxδ= Inferior maximum.
P*: ANOVA test was performed in normal, glaucoma suspect, and early glaucoma patient.
P†: Tuckey-Kramer test was performed in normal and glaucoma suspect.
P‡: Tuckey-Kramer test was performed in normal and early glaucoma.
P§: Tuckey-Kramer test was performed in glaucoma suspect and early glaucoma.
SmaxΠ= Superior maximum; Imax#= Inferior maximum.
Table 6. Area under the receiver operating characteristic (AUROC) curve, best combination of sensitivity/specificity with specificity
≥80% for the individual OCT parameters detecting early glaucoma
Measurement AUROC‡ Cut off value Sensitivity Specificity
ONH* parameters
horiz. integrated rim area 0.753 1.42 51.8 83.9
rim area 0.729 1.56 55.3 81.6
vert. integrated rim vol. 0.713 0.14 48.2 84.5
RNFL†thickness parameters
Imax§ 0.718 154.5 54.1 81.0
average thickness 0.759 94.3 58.8 81.0
Inferior 0.728 120.5 50.6 81.6
ONH*= optic nerve head; RNFL†= retinal nerve fiber layer; AUROC‡= area under the ROC curve; Imax§= Inferior maximum.
Figure 1. Receiver operating characteristic (ROC) curve of horizontal integrated rim width in control group and early glaucoma group. It has the best discriminating capability. Cut-off value 1.529 mm2 yields high diagnostic value with sensitivity 72.9% and specificity 65.5%.
Figure 2. Receiver operating characteristic (ROC) curve of average thickness in control group and early glaucoma group. It has the best discriminating capability among thickness parameters. Cut off value 92.17 µm yields high diagnostic value with sensitivity 49.4% and specificity 93.1%.
화를 정량적으로 관찰할 수 있다면 기존의 검사보다 녹 내장을 조기에 진단하고 진행여부를 판단하는데 도움을 줄 수 있을 것이다. 최근에 개발되어 사용되고 있는 여 러 가지 영상진단장비는 그 원리에 차이는 있지만 시신 경과 망막신경섬유층의 정량적 분석이 가능하고 재현성 이 높은 검사가 가능하다.11-13
빛간섭단층촬영은 레이저를 이용하여 초음파검사와 비슷하게 눈의 구조를 관찰하는 장치로서 각 조직의 특 징에 따라 반사되는 광선의 양을 측정함으로써 망막의 단층 상을 만들어 망막신경섬유의 정량적인 분석이 가 능하다. 또한 빛간섭단층촬영 자체 프로그램에는 정상 서양인의 망막신경섬유두께가 내장되어있어 이를 바탕 으로 정상치의 95%를 벗어난 경우는 노란색으로, 99%를 벗어난 경우는 빨간색으로 각각 색깔별로 표시 해주는데 망막신경섬유두께는 인종 간에도 차이가 있어 서 한국인을 대상으로 한 녹내장선별검사에 바로 적용 하기에는 한계점이 있다. 또한 나이가 들어감에 따라 망막신경섬유두께가 의미 있게 감소한다고 알려져 있 어,14,15 본 연구에서는 나이를 보정하여 정상대조군, 녹 내장의증군, 초기 녹내장군 세 군 간의 망막신경섬유지 표와 시신경유두지표의 차이를 비교하여 보고자 하였다.
본 연구에서 초기 녹내장환자의 안압이 평균 16.78 mmHg로 정상대조군과 녹내장의증군을 비교 시 차이 가 없었는데 이는 초기 녹내장환자에 정상안압녹내장이 포함되어 있었고, 타 병원에서 치료를 받던 환자가 3차 병원인 본원으로 의뢰되어 대부분 약물 치료를 받고 있 었기 때문이라고 생각한다.
본 연구에서 검안경으로 검사한 정상대조군의 시신 경유두함몰비는 0.42이고 빛간섭단층촬영으로 측정한 cup/disk horizontal ratio는 0.69 cup/disk vertical ratio는 0.59로 빛간섭단층촬영 측정치가 크 게 측정되었고 녹내장의증군과 초기 녹내장환자군에서 도 빛간섭단층촬영으로 측정한 시신경유두함몰비가 검 안경으로 검사한 것 보다 크게 측정되었다. Sim and Park17은 한국인을 대상으로 시행한 연구에서 검안경 으로 검사한 정상인의 시신경유두함몰비가 0.52, 빛간 섭단층촬영으로 측정한 cup/disk horizontal ratio 는 0.72, cup/disk vertical ratio는 0.62로 빛간섭 단층촬영 측정치가 크게 측정되고 녹내장의증과 녹내장 환자에서도 마찬가지로 빛간섭단층촬영 측정치가 크다 고 보고하여 본 검사와 유사한 결과를 보였다. 검안경 으로 측정한 시신경유두함몰비가 빛간섭단층촬영으로 측정한 것과 차이를 보이는 이유에 대해서 Sim and Park17은 빛간섭단층촬영의 기준면의 설정이 서양인 검사를 위해 고안된 망막색소상피층 위쪽 150 µm로 획일화 되어 있는 것이 원인일 것이라고 추정하였다.
또한 Hrynchak et al16은 빛간섭단층촬영에서 시신 경유두를 결정할 때 망막색소상피층의 끝을 기준으로 정하는 것, 시신경유두함몰을 결정하는 데 사용되는 기 준면, 기울어진 시신경유두에서의 수평측정치가 망막표 면과 직각을 이루지 않는 것, 피검자의 주시가 느린 속 도로 조사되는 광선을 따라가는 것, 그리고 영상화를 위한 정상 각도를 벗어나는 것을 시신경유두함몰비 차 이의 원인이라고 보고 하였다.
빛간섭단층촬영을 이용한 시신경유두분석 6가지 지 표 모두 정상대조군과 초기 녹내장환자군 간에 유의한 차이를 보였으며 AUROC curve가 넓은 지표는 horizontal integrated rim area (0.753), rim area (0.729), vertical integrated rim volume (0.713)순이었다. Sim and Park17은 정상, 녹내장 의증, 그리고 녹내장환자를 대상으로 시신경유두분석지 표를 비교한 결과 AUROC curve가 horizontal integrated rim area (0.772), vertical integrated rim volume (0.741), rim area (0.723)순으로 넓 다고 보고하였다. 이는 본 연구의 AUROC curve가 가장 넓은 세 가지 지표보다 면적이 넓고 순서에도 차 이가 있는데 이는 대상 녹내장환자군의 평균 MD가 -13.9dB로 본 연구 녹내장군의 평균 MD -3.52dB보 다 세배이상 큰 것으로 대상환자군의 녹내장진행정도의 차이로 생각된다. AUROC curve가 가장 넓은 세 가 지 지표 모두 시신경유두테를 측정한 것인데 이는 망막 신경섬유층의 두께와 직접적인 관계가 있는 것으로 녹 내장성 시신경병증의 주된 병변과 일치하는 결과이다.
망막신경섬유지표에서는 average thickness (0.759), inferior thickness (0.728), Imax (0.718)순으로 AUROC curve가 넓었는데 세 가지 지표 모두 망막의 하측망막신경섬유의 두께 감소를 나타내는 것으로 이는 시신경의 하측이 녹내장성 신경손상에 취약하여 녹내장 성 시야 변화가 하측 시야보다 상측 시야에서 먼저 발 생한다는 사실과 일치하는 소견이다. Kanamori et al18은 정상, 녹내장의증, 초기 녹내장 환자를 대상으로 망막신경섬유지표를 분석하였는데 7시 방향(0.873), inferior thickness (0.863), average thickness (0.841)순으로 정확도가 높다고 보고하여 저자들과 유 사한 결과를 보였다. 또한 Zangwill et al19과 Hoh et al20도 초기 녹내장환자에서 하측망막신경섬유에 대한 AUROC curve가 다른 곳에 비해 더 넓게 나타 나 진단의 정확도가 다른 부위보다 높다고 보고하였다.
목표 특이도를 80%이상 그리고 90%이상으로 하였 을 때의 민감도는 기존의 보고에 비해 낮은 결과를 보 였는데 이는 초기 녹내장으로 대상을 설정하여 MD가 기존의 연구 대상과 비교해 볼 때 덜 감소되어있었고
서양인을 대상으로 한 연구 결과이므로 인종간의 차이 를 고려하지 않을 수 없으며 다수의 한국인을 대상으로 한 추가적인 연구가 필요하리라 생각된다.
시신경유두의 크기는 개인 간의 차이가 크고 시신경 유두크기가 클수록 유두함몰비도 커지고 망막신경섬유 두께에도 영향을 미치므로 시신경크기를 고려하지 않은 빛간섭단층촬영을 이용한 시신경유두분석은 오차가 있 으리라 생각되며 시신경유두크기를 객관적으로 측정하 여 크기에 따른 차이를 고려한 후 지표를 비교분석하는 추가적인 연구가 필요하리라 생각된다. 또한 녹내장환 자에서 흔히 발견되는 유두주위위축은 시신경유두분석 이나 망막신경섬유분석에 비정상적인 오차를 초래할 수 있다고 알려져 있어 이러한 단점을 보완할 수 있는 장 치와 연구가 필요하리라 생각한다.
따라서 빛간섭단층촬영에 내장된 프로그램을 이용하 여 녹내장의 선별 검사로 사용하는 데는 정상서양인을 대상으로 분석이므로 다수의 한국인을 대상으로 한 정 상치에 대한 서양인과의 비교분석이 필요하고 시신경유 두주위위축, 시신경유두 기울어짐과 같은 형태학적인 문제를 고려하여 분석한다면 비교적 높은 민감도를 보 이는 빛간섭단층촬영의 망막신경섬유분석, 시신경유두 분석 지표가 녹내장을 조기 진단하는데 그리고 경과관 찰에 유용한 정보를 제공할 것으로 생각된다.
참고문헌
1) Gupta N, Weinerb RN. New definition of glaucoma. Curr Opin Ophthalmol 1997;8:38-41.
2) Quigley HA, Miller NR, George T. Clinical evaluation of nerve fiber layer atrophy as a indicator of glaucomatous optic nerve damage. Arch Ophthalmol 1980;98:1564-71.
3) Tuulonen A, Lehtola J, Airaksinen PJ. Nerve fiber layer defects with normal visual fields. Ophthalmology 1993;110:587-98.
4) Quigley HA, Dunkelberg GR, Green WR. Retinal ganglion cell atrophy correlated with automated perimetry in human eyes with glaucoma. Am J Ophthalmol 1989;107:453-64.
5) Sommer A, Katz J, Quigley HA, et al. Clinically detectable nerve fiber layer atrophy precedes the onset of glaucomatous field loss. Arch Ophthalmol 1991;109:77-83.
6) Schuman JS, Tamar PK, Hertzmark E, et al. Reproducibility of nerve fiber layer thickness measurements using optical coherence tomography. Ophthalmology 1996;103:1889-98.
7) Blumenthal EZ, Williams JM, Weinreb RN, et al.
Reproducibility of nerve fiber layer thickness measurements by use of optical coherence tomography. Ophthalmology 2000;107:
2278-82.
8) Jonas JB, Schmidt AM, Muller-Bergh JA, et al. Human optic nerve fiber count and optic disc size. Invest Ophthalmol Vis Sci 1992;33:2012-8.
9) Varma R, Skaf M, Barrone E. Retinal nerve fiber layer thickness in normal human eyes. Ophthalmology 1996;103:
2114-9.
10) Tsai CS, Zangwill L, Gonzalez C, et al. Ethnic differences in optic nerve topography. J Glaucoma 1995;4:248-57.
11) Huang D, Swanson EA, Lin CP, et al. Optical coherence tomography. Science 1991;54:1178-81.
12) Schuman JS, Hee MR, Arya Av, et al. Optical coherence tomography of the human retina. Arch Ophthalmol 1995;113:
325-32.
13) Schuman JS, Hee MR, Puliafito CA, et al. Quantification of nerve fiber layer thickness in normal and glaucomatous eyes using optical coherence tomography. Arch Ophthalmol 1995;113:586-96.
14) Balazsi AG, Rootman J, Drance SM, et al. The effect of age on the nerve fiber population of the human optic nerve. Am J Ophthalmol 1984;97:760-6.
15) Johnson BM, Miao M, Sadun M. Age related decline of human optic nerve axon populations. Age 1987;10:5-9.
16) Hrynchak P, Hutchings N, Jones D, Simpson T. A comparison of cup-to-disc ratio measurement in normal subjects using optical coherence tomography image analysis of the optic nerve head and stereo fundus biomicroscopy. Ophthalmic Physiol Opt 2004;24:543-50.
17) Sim JO, Park CK. Optic nerve head analysis obtained by optical coherence tomography for the diagnosis of glaucoma in Koreans. J Korean Ophthalmol Soc 2004;45:1885-92.
18) Kanamori A, Nakamura M, Escano M, et al. Evaluation of the glaucomatous damage on retinal nerve fiber layer thickness measured by optical coherence tomography. Am J Ophthalmol 2003;135:513-20.
19) Zangwill LM, Bowd C, Berry CC, et al. Discriminating between normal and glaucomatous eye using the Heidelberg Retina Tomography, GDx Nerve Fiber Analyser, and Optical Coherence Tomographt. Arch Ophthalmol 2001;119:985-93.
20) Hoh ST, Greenfield DS, Mistberger A, et al. Optical coherence tomography and scanning laser polarimetry in normal, ocular hypertension and glaucomatous eyes. Am J Ophthalmol 2000;129:129-33.
=ABSTRACT=
Optical Coherence Tomography Parameters of Normal, Glaucoma Suspect, and Early Glaucoma Patients
Su Eun Park, M.D., Jin Kwon Jung, M.D., Ji Yong Jung, M.D., Song Hee Park, M.D.
Department of Ophthalmology, College of Medicine, Soonchunhyang University, Seoul, Korea
Purpose: The objective of this study is to compare optic nerve head (ONH) analysis parameters and retinal nerve fiber layer (RNFL) thickness parameters as measured by optical coherence tomography (OCT) among age-matched normal eyes, glaucoma-suspect eyes, and early glaucomatous eyes; and to determine the discriminating parameter best suited to distinguish early glaucoma in age-matched normal eyes and glaucoma- suspect eyes.
Methods: One hundred two normal eyes, 72 glaucoma-suspect eyes, and 85 eyes with early glaucoma that had been submitted to OCT and Humphrey field analysis were enrolled in this study. Optic nerve head analysis values and RNFL thickness values with OCT scans were compared among all groups. Sensitivity and specificity for the detection of early glaucoma were determined with a receiver operating characteristic (ROC) curve.
Results: The best-suited parameters were determined to be from 0.637 to 0.753 in optic nerve head parameters and from 0.506 to 0.759 in RNFL thickness parameters calculated with the area under the ROC curve (AUROC). The average thickness for early glaucomatous eye (0.818) had the widest AUROC among all parameters. The sensitivity and specificity of RNFL thickness parameter were determined to be 49.4%
and 93.1%, respectively, at the cut-off value 92.17 µm.
Conclusions: Optic nerve head and RNFL thickness parameters measured with OCT have relatively high sensitivity and specificity for detecting early glaucomatous eyes. Furthermore, they may provide clinically relevant information for the detection of early glaucomatous damage and for monitoring glaucomatous changes.
J Korean Ophthalmol Soc 48(10):1379-1387, 2007
Key Words: Optical coherence tomography, Optic disc parameter, Retinal nerve fiber layer thickness parameter
Address reprint requests to Song Hee Park M.D.
Department of Ophthalmology, College of Medicine, Soonchunhyang University
#657 Hannam-dong, Yongsan-gu, Seoul 140-743, Korea
Tel: 82-2-709-9354, Fax: 82-2-798-7797, E-mail: [email protected]