Corresponding author: Shim, Jae Lan https://orcid.org/0000-0002-7795-0149
Department of Nursing, Dongguk University, 123 Dongdae-ro, Gyeongju 38066, Korea.
Tel: +82-54-703-7804, Fax: +82-54-770-2616, E-mail: jrshim@dongguk.ac.kr, Received: Sep 23, 2019 / Revised: Nov 3, 2019 / Accepted: Nov 29, 2019
This is an open access article distributed under the terms of the Creative Commons Attribution Non-Commercial License (http://creativecommons.org/licenses/
by-nc/3.0), which permits unrestricted non-commercial use, distribution, and reproduction in any medium, provided the original work is properly cited.
ORIGINAL ARTICLE Open Access
Factors Influencing Pre-Diabetes in Middle-aged Women based on the KNHANES
Kim, Kyung Ae1 · Shim, Jae Lan2
1Assistant Professor, College of Nursing, Kyungdong University, Wonju, Korea
2Assistant Professor, Department of Nursing, Dongguk University, Gyeongju, Korea
Purpose: This study was conducted to identify the predictive factors for pre-diabetes in middle-aged Korean women based on the Korean National Health and Nutrition Examination Survey (KNHANES). Methods: In this cross-sectional study, data were extracted from the second year of the 6th KNHANES (2013~2015), conducted at 129 sites from January to December 2014. The 1,275 subjects were middle-aged women between 40 and 64 years of age charac- terized as “pre-diabetic” (n=618) or “normal” (n=657) according to the American Diabetes Association (ADA) standard. Multivariate binary logistic regression was used to determine factors influencing pre-diabetes in mid- dle-aged women. Results: The significant factors for pre-diabetes were a Waist-to-Height Ratio (WHtR) > 0.53 (Odds Ratio [OR]=1.71, 95% Confidence Interval [CI]=1.27~2.29), increasing prevalence of hypercholesterolemia (OR=2.02, 95% CI=1.42~2.86), and low level of High-Density Lipoprotein (HDL) cholesterol (OR=1.89, 95% CI=1.18~3.02). In ad- dition, as age increased after 50 years, the proportion of WHtR > 0.53 decreased in the normal group, but increased with age in the pre-diabetes group. Conclusion: Education to raise awareness about diabetes including pre-diabetes is needed for effective management of hyperlipidemia and central obesity to ensure a healthy middle age.
Key Words: Prediabetic state; Women; Hypercholesterolemia; Obesity; Abdomen
INTRODUCTION
Pre-diabetes is a health status that means blood sugar level is higher than normal, but not yet high enough for a diagnosis of diabetes. The blood sugar range for pre-dia- betes is 100~125 mg/dL and the hemoglobin A1c range is 5.7~6.4% [1]. In addition to an increasing prevalence of dia- betes, the pre-diabetic population is expected to include more than 470 million people by 2030 [2]. The death rate as- sociated with diabetes is increasing every year [3], and in- dividuals who are pre-diabetic are at high risk for develop- ment of diabetes, with an annualized conversion rate of 5~10%[2,4]. Individuals with prediabetes are at high risk, not only for transit to Diabetes Mellitus (DM) but also for Cardiovascular Disease (CVD) in their later lives [3].
For women, physiological aging and changes begin at middle age, and decreased activity leads to a higher risk of diabetes because of increased insulin resistance [4-6].
Fasting insulin and blood glucose levels were higher in postmenopausal women than in premenopausal women.
Menopause was also associated with the selective accu- mulation of fat in the abdominal cavity, resulting in in- creased abdominal obesity [4-6]. Obesity and central obe- sity are the most prominent risk factors in the prevalence of diabetes, which is more distinct in women. The increase in obesity after middle-age in women increases their in- cidence of diabetes. However, men have increased obesity and diabetes at a younger age but a lower incidence than women after middle age [7]. As the prevalence of diabetes is increasing, there is a need to explore determinants be- yond the traditional risk factors, for example, sedentary behavior and obesity [8]. In particular, pre-diabetes is re- lated to visceral obesity, high triglycerides, low level of High-Density Lipoprotein (HDL) cholesterol, and hyper- tension [9]. Therefore, specific health care is needed to pre- vent problems associated with pre-diabetes in middle-aged
women.
In a prior study, risk factors linked with undiagnosed diabetes and pre-diabetes were investigated using multi- ple logistic regression, and the overall prevalence of dia- betes and pre-diabetes was found to be 6.6% and 16.6%, re- spectively [10]. According to the World Health Organiza- tion’s (WHO) STEPwise Approach to Risk Factor Surveil- lance (STEPS) study in Palau of 1,915 adults aged 25~64 years, middle-aged adult, hypertension, hypertriglyceri- demia, and central obesity, which includes a large waist circumference or waist-hip ratio, were identified as pre- dictors of diabetes [11].
Middle-aged women in particular undergo hormonal changes related to menopause [7] and display signs of ag- ing, as well as a decline of physical functioning of all organs. This results in decreased opportunity for physical activity, excessive calorific intake, and loss of balance in energy consumption, and therefore they experience in- creased body weight and complications such as obesity [6,12]. In a systematic review, women were found to have a higher Body Mass Index (BMI) than men [13], and wom- en with pre-diabetes are more likely than men to develop diabetes mellitus [7]. Additionally, in West Asia, women aged 40~55 years showed significantly higher BMI and Waist-to-Hip Ratio (WHtR) values than women aged < 40 years [14]. In Korean studies, 28.6% of women in their 50s were found to have metabolic syndrome [15], high blood pressure, high fasting blood glucose, hyperlipidemia, low HDL cholesterol, and low exercise levels [16-19]. In a co- hort study that identified factors influencing pre-diabetes, obesity, low HDL cholesterol levels, low physical activity, and hypertension were found to be major causes of pre- diabetes and were identified as modifiable risk factors [17].
Thus, screening tests for health education in high-risk middle-aged adults with obesity and insufficient physical activity are urgently needed [1].
In most previous studies, which included adults of all ages [10,11,16,17], pre-diabetes was associated with phys- iological changes such as hormonal changes in women af- ter middle age and a further increase in obesity and reduc- tion in physical activity. In addition, the results of pre- vious studies showed that predictors of pre-diabetes are modifiable factors. Therefore, this study aimed to deter- mine whether these factors affected classification as pre- diabetic by analyzing national representative data. The re- sults of this study will identify pre-diabetic risk factors for middle-aged women, contribute to reducing the preva- lence of diabetes, and serve as the basis for a nursing inter- vention planning strategy to control risk factors.
METHODS
1. Research Design and ProcedureThis study was a secondary analysis using data from the 6th National Health and Nutrition Examination Survey (KNHANES). The investigation was a descriptive correla- tion study comparing a normal group with a pre-diabetes risk group to identify risk factors for pre-diabetes in mid- dle-aged women. The survey sampling design adopted was a complex, stratified, multi-stage, probability-clus- tered survey of a representative sample of the commun- ity-dwelling civilian population.
According to the 2014 KNHANES Report [18] by the Korea Centers for Disease Control and Prevention, the prevalence of chronic diseases such as obesity, hyperten- sion, and diabetes from 2005 to 2014 markedly increased in 2014. Therefore, the analysis was conducted to identify pre-diabetic risk groups for middle-aged women in 2014.
2. Setting and Sample
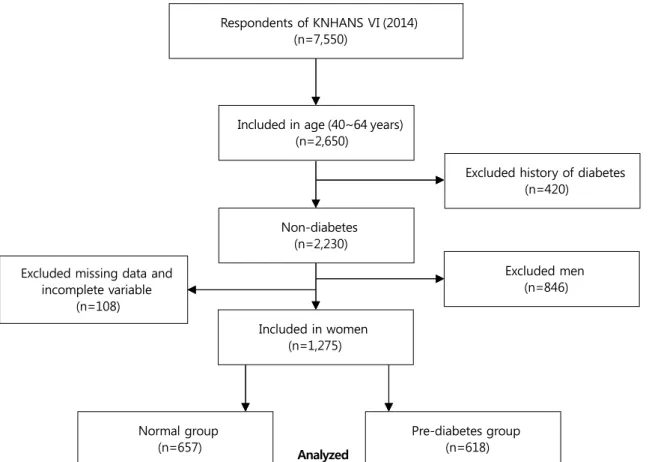
This study was based on raw data extracted for the year 2014, the second year of the 6th National Health and Nut- rition Examination Survey (2013~2015). The data extrac- ted covered 7,550 respondents from infants to the elderly in a composite sample design, with 3,840 household resi- dents of 129 survey sites nationwide, and was stratified based on the intrinsic layers [gender, age, residential area, household, education]. Among these subjects, 2,650 mid- dle-aged people aged 40 to 64 were extracted. Next, from this group we extracted 1,275 middle-aged women who were not diagnosed or treated for diabetes, thereby ex- cluding 846 men and 108 women with missing data.
The pre-diabetes group was classified using the Ameri- can Diabetes Association (ADA) standard as having a 100 to 125 mg/dL Fasting Blood Sugar (FBS) or 5.7 to 6.4% gly- cated hemoglobin (HbA1c), and the normal group inclu- ded subjects who did not meet this standard [1] (Figure 1).
3. Measurements
1) Socio-demographic and clinical characteristics
The individual components of the health interview questionnaire included information on cigarette smoking, alcohol use, activity limitation, physical activity, and per- ceived health status, all of which were collected via ques- tionnaires. Disease-related characteristics including smok- ing, height, weight, and BMI were also collected.
Risk factors for pre-diabetes based on the American
Respondents of KNHANS Ⅵ (2014) (n=7,550)
Included in age (40~64 years) (n=2,650)
Non-diabetes (n=2,230)
Normal group (n=657)
Included in women (n=1,275)
Excluded history of diabetes (n=420)
Excluded missing data and incomplete variable
(n=108)
Analyzed
Excluded men (n=846)
Pre-diabetes group (n=618)
Figure 1. Flow chart of the study population.
Diabetes Association guidelines of 2018 were used as the criteria for screening for diabetes [1,2]. With regard to the presence of diabetes mellitus, presence or absence of CVD, and physiological parameters, the hematological test items of the screening test included fasting blood glucose, HbA1c, total cholesterol, fat, HDL, low-density cholesterol (LDL), and blood pressure measured by a nurse.
2) Central obesity
WHtR is used as a parameter for measurement of cen- tral obesity [20]. To determine if the use of WHtR in addi- tion to BMI or Waist Circumference (WC) could help iden- tify those at an increased cardiometabolic risk, participants were categorized according to BMI (overweight or non- overweight) and WC (with or without central obesity), and each of the BMI and WC groups was further stratified by WHtR (WHtR < 0.53 vs. WHtR ≥0.53) [21].
3) Physical activity
The levels of physical activity were scored using the International Physical Activity Questionnaire (IPAQ)[22].
Physical activity included activities such as vigorous-in- tensity physical activity during the last 7 days (running, climbing, biking, swimming, soccer, jumping rope, sports
activities such as singles tennis, physical activity, and car- rying heavy items), moderate physical activity except walk- ing (including slow swimming, doubles tennis, volleyball, badminton, ping-pong, general physical activity, and light- weight cargo handling activities), and walking activities (including walking for commuting, moving, and exercis- ing).
The results of the IPAQ were converted into minutes of exercise, and the amount of exercise was calculated as the Metabolic Equivalent of Task (MET-min/week, MET). The total physical activity score was calculated by adding walk- ing MET (3.3 × min × day), moderate-intensive physical activity MET (4.0 × min × day), and vigorous-intensity physical activity MET (8.0 × min × day). According to the MET results, physical activity levels were classified as low, moderate, and high. Low-physical activity was classified as less than 500 MET, moderate-physical activity as 501 to 999 MET, and high-physical activity as more than 1000 MET [23].
4. Data Collection
Survey data for the second year of the 6th KNHANES (2013~2015) used in this investigation were collected from
129 sites from January to December 2014, after which a screening and health questionnaire was administered.
Health questionnaires were administered by a professio- nal survey team consisting of nurses, dietitians, and health professionals. The KNHANES collects data for several vari- ables regarding participants’ demographic, social, health, and nutritional status from three component surveys: the health interview, health examination, and nutrition survey.
5. Ethical Considerations
The original data describing the national health and nu- trition utilized in this study were in compliance with the personal information protection law and the statistical law, for which only data were provided that cannot be es- timated from survey data collected with the approval of the research ethics review committee of the disease man- agement headquarters (2013-12EXP-03-5C). A separate eth- ics review of the present study was not needed because publicly available data were used. The researcher con- ducted the study in consideration of the advice provided on the homepage of the National Health and Nutrition Survey (https://knhanes.cdc.go.kr/) and the rules for dis- closure and use of raw materials.
6. Statistical Analysis
The SPSS/WIN 23.0 program (IBM SPSS Statistics, Chi- cago, IL, USA) was used for the statistical data analysis.
We added sample weights and adjusted the analyses for a complex sample design in order to represent the entire Korean population. To use a method of analysis allowing complex sample design elements, clusters (primary ex- traction units) are plots and stratified variables are var- iance estimates. To assign the appropriate weight to each variable of the analysis, the weights were calculated by ap- plying the health questionnaire and the examination weight.
In the x2 test, missing values via mean imputation, which fills in missing values with the mean value for the variable, were used to prevent the exaggeration of the significance of the results.
The multivariate logistic model was applied to identify the risk factors for pre-diabetes using a backward variable selection method that puts significant variables in the uni- variate analysis and applies pre-diabetes risk factors to the parent group, leaving only the significant variables. In the multivariate logistic analysis, 173 (13.6%) of the 1,275 sub- jects were missing data. In the logistic regression analysis, missing values were treated with pairwise deletion, which removes only missing values of variables for individuals,
to minimize information loss resulting from missing data, and uses the remaining variables to calculate confidence intervals and regression coefficients. A two-tailed p-value less than .005 was considered statistically significant.
RESULTS
1. Participants’ General CharacteristicsWe analyzed data collected from women aged 40 to 65 after dividing them into two groups: 618 participants in the pre-diabetes group and 657 in the normal group. The results showed that age, education, monthly household income, and occupation were significantly different be- tween two groups (p<.001). Alcohol consumption was higher in the pre-diabetes group, with significant differ- ences between the two groups (t=10.23, p=.037). When asked about their health status, 21.2% of the pre-diabetic group gave a response of “good,” as did 30.6% of the nor- mal group, which was a significant difference (t=10.33, p=
.016). However, there was no difference between two groups as to whether they were living together or smoking (Table 1).
2. Risk Factors for Pre-Diabetes
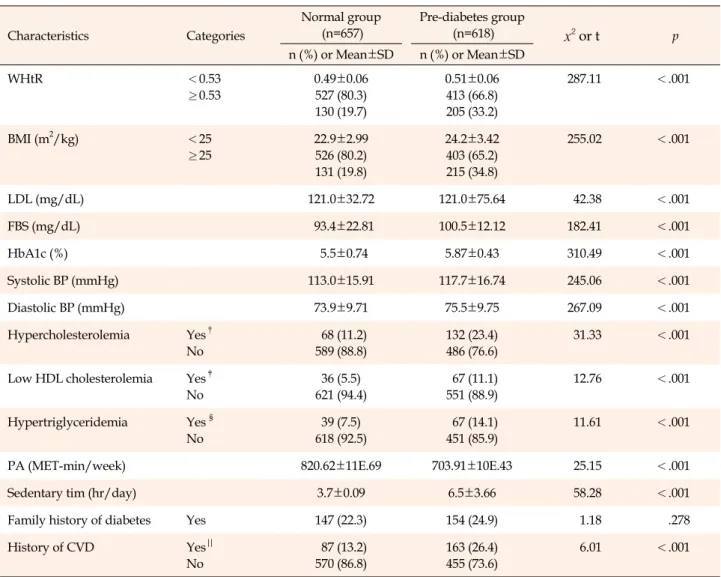
Overall, 19.7% of the individuals in the normal group and 33.2% in the pre-diabetic group had a WHtR of over 0.53 (t=287.11, p<.001), and 19.8% of individuals in the normal group and 34.8% in the pre-diabetic group had a BMI of over 25 kg/m2(t=255.02, p<.001). Additionally, a significant difference was found between the pre-diabetic group and the normal group in participants who had hy- percholesterolemia (total cholesterol > 240 mg/dL or tak- ing cholesterol lowering medication) (t=31.33, p<.001), low levels of HDL cholesterol (HDL < 40 mg/dL) (t=12.76, p<
.001), and hypertriglyceridemia (triglyceride > 200 mg/dL) (t=11.61, p<.001).
The amount of physical activity measured with IPAQ showed the physical activity of the subjects for the last 7 days, which was converted into MET (minute/week).
There was a significant difference between the two groups:
820.6 MET for the normal group and 703.9 MET for the pre-diabetic group (t=25.15, p<.001). There were also dif- ferences in sedentary time, with 3.7 hours for those in the normal group and 6.5 hours in the pre-diabetic group (t=58.28, p<.001). The history of CVD was 26.4% in the pre-diabetic group and 13.2% in the normal group (t=6.01, p<.001) (Table 2).
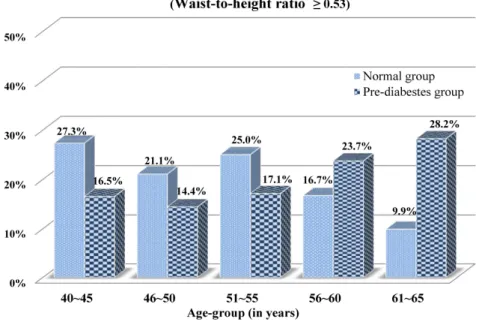
In the age-specific classifications of WHtR over 0.53, we
Table 1. General Characteristics of the Subjects (N=1,275) Characteristics Categories
Normal group (n=657)
Pre-diabetes group
(n=618) x2 or t p
n (%) or Mean±SD n (%) or Mean±SD
Age (year) 52.47±7.06 53.7±7.07 249.32 <.001
Living with Spouse or children Divorced/unmarried
563 (85.7) 94 (14.3)
521 (84.3) 97 (15.7)
9.47 .149
Education ≤Middle school
High school
≥College
192 (29.0) 270 (41.2) 195 (29.8)
229 (37.0) 284 (46.0) 105 (17.0)
33.01 <.001
Household income (10,000 won/monthly)
≤100 101~200 201~300
≥300
157 (24.0) 175 (26.7) 168 (25.6) 157 (23.7)
133 (21.5) 155 (25.1) 153 (24.8) 177 (28.6)
21.21 <.001
Occupation Managerial/professional Service /sale
Routine /manual Unemployed/housewives
127 (19.3) 117 (17.8) 112 (17.0) 301 (45.9)
79 (12.9) 140 (22.7) 145 (23.6) 254 (40.8)
22.30 <.001
Smoking Current smoker
Ex-smoker/never
24 (3.7) 633 (96.3)
20 (3.2) 598 (96.8)
1.23 .747
Alcohol drinking Daily
≥2/week
<1/Months None
21 (3.2) 185 (28.2) 76 (11.6) 375 (57.0)
16 (2.6) 138 (22.3)
60 (9.7) 404 (65.4)
10.23 .037
Perceived health status Good Moderate Poor
201 (30.6) 358 (54.5) 98 (14.9)
132 (21.2) 374 (60.6) 112 (18.2)
10.33 .016
n=unweighted count; SD=standard deviation; %=weighted count.
found that the percentage of middle-aged women with WHtR above 0.53 in the pre-diabetes group increased as the age increased to 50 years or older (Figure 2).
3. Factors Influencing Pre-Diabetes
Table 3 shows the factors associated with pre-diabetes in middle-aged women based on multivariate logistic re- gression. First, in the analytical procedure, parental groups such as middle-aged women and the undiagnosed dia- betic group were designated and their significant varia- bles in Table 1 entered in the analytical program, followed by WHtR, BMI, hypertriglyceridemia, physical activity, sedentary time, and CVD history. Finally, age and month- ly income, which are continuous covariates, were used as adjust variables.
Significant factors associated with the pre-diabetes were WHtR values, hypercholesterolemia, and low cholester- olemia. Middle-aged women with WHtR values over 0.53 were 1.7 times more likely (Odds Ratio [OR]=1.71, 95%
Confidence Interval [CI]=1.27~2.29, p<.001) to develop
pre-diabetes than those with WHtR values less than 0.53.
Women with hypercholesterolemia were more likely to de- velop pre-diabetes (OR=2.02, 95% CI=1.42~2.86, p<.001).
In addition, the likelihood of developing pre-diabetes was significantly higher in women with low HDL cholester- olemia than those without low HDL cholesterolemia (OR=
1.89, 95% CI=1.18~3.02, p=.008).
DISCUSSION
This study was conducted to compare a pre-diabetes group and a normal group classified according to ADA criteria in order to identify the predictive factors for pre- diabetes in Korean middle-aged women.
The results showed that middle-aged women who had a WHtR of more than 0.53, a key predictor of metabolic syndrome [21], were 33.2% in the pre-diabetic group and 19.7% in the normal group. In addition, 34.8% of women in the pre-diabetes group had a BMI of more than 25 kg/m2, versus only 19.8% of women in the normal group. Addi- tionally, the prevalence of women with WHtR ≥0.53 in
Table 2. Risk Factors related to Pre-diabetes (N=1,275)
Characteristics Categories
Normal group (n=657)
Pre-diabetes group
(n=618) x2 or t p
n (%) or Mean±SD n (%) or Mean±SD
WHtR <0.53
≥0.53
0.49±0.06 527 (80.3) 130 (19.7)
0.51±0.06 413 (66.8) 205 (33.2)
287.11 <.001
BMI (m2/kg) <25
≥25
22.9±2.99 526 (80.2) 131 (19.8)
24.2±3.42 403 (65.2) 215 (34.8)
255.02 <.001
LDL (mg/dL) 121.0±32.72 121.0±75.64 42.38 <.001
FBS (mg/dL) 93.4±22.81 100.5±12.12 182.41 <.001
HbA1c (%) 5.5±0.74 5.87±0.43 310.49 <.001
Systolic BP (mmHg) 113.0±15.91 117.7±16.74 245.06 <.001
Diastolic BP (mmHg) 73.9±9.71 75.5±9.75 267.09 <.001
Hypercholesterolemia Yes† No
68 (11.2) 589 (88.8)
132 (23.4) 486 (76.6)
31.33 <.001
Low HDL cholesterolemia Yes‡ No
36 (5.5) 621 (94.4)
67 (11.1) 551 (88.9)
12.76 <.001
Hypertriglyceridemia Yes § No
39 (7.5) 618 (92.5)
67 (14.1) 451 (85.9)
11.61 <.001
PA (MET-min/week) 820.62±11E.69 703.91±10E.43 25.15 <.001
Sedentary tim (hr/day) 3.7±0.09 6.5±3.66 58.28 <.001
Family history of diabetes Yes 147 (22.3) 154 (24.9) 1.18 .278
History of CVD Yes||
No
87 (13.2) 570 (86.8)
163 (26.4) 455 (73.6)
6.01 <.001
BP=blood pressure; BMI=body mass index; CVD=cardiovascular disease; E=exponential function; FBS=fasting blood sugar; HbA1c=glycated hemoglobin; HDL=high density lipoprotein; LDL=low density lipoprotein; MET=metabolic equivalent of task (min/week); n=unweighted count;
PA=physical activity; WHtR=waist to height ratio; %=weighted count; †total cholesterol >240 mg/dL or a person taking cholesterol lowering drugs; ‡HDL <40 mg/dL; §Triglyceride >200 mg/dL; ||Angina, myocardial infarction, heart failure.
the pre-diabetic group tended to increase with age, while tending to decrease in the normal group. In this study, middle-aged women with WHtR values of≥0.53 were more likely to develop pre-diabetes than those with WHtR values less than 0.53. This result was similar to the finding of an increase in WHtR, a significant determinant of pre- diabetes, in 1,148 patients in a cohort study in Netherlands (NLCS) [24]. The finding is also consistent with that of a cohort study of 1,184 adults in Spain, which showed a strong relationship between abdominal obesity and pre- diabetes in both males and females [17]. Moreover, a sur- vey to estimate the prevalence of pre-diabetes and dia- betes with 1,915 subjects among adults 18 years or older in Palau found significant associations with pre-diabetes [11], and a cohort study of 816 pre-diabetic Korean adults over
the age of 40 showed that increases in metabolic-synd- rome-related factors and WHtR were predictive of pre-dia- betes [21]. These results suggest that middle-aged women with pre-diabetes need to change their lifestyles to reduce abdominal obesity [1].
In order to reduce WHtR levels, regular physical activ- ity along with lifestyle changes is important, as is reducing sedentary time [11,17,24]. A review of the epidemiological evidence showed that women who had a moderate phys- ical activity of about 30 minutes a day saw a lowered ini- tiation and progression of the risk of CVD through benefi- cial effects, not only on adiposity but also on insulin sensi- tivity, glycemic control, type 2 diabetes, blood pressure, lipid, endothelial function, and inflammation defenses [14]. Despite these benefits, the measured amounts of phy-
Figure 2. Distribution of waist-to-height ratio classified by age groups.
Table 3. Predictors of Pre-diabetes in Middle-aged Women (N=1,275)
Characteristics β SE Wald p OR 95% CI
WHtR
<0.53 (reference)
≥0.53 .54 0.15 12.79 <.001
1
1.71 1.27~2.29
Hypercholesterolemia No (reference)
Yes† .70 0.18 15.34 <.001
1
2.02 1.42~2.86
Low HDL Cholesterolemia No (reference)
Yes‡ .64 0.24 7.02 .008
1
1.89 1.18~3.02
Nagelkerke R2=.145, p=.938
CI=confidence interval; HDL=high density lipoprotein; OR=odds ratio; SE=standard error; WHtR=waist to height ratio; †Total Cholesterol
>240 mg/dL or a person taking cholesterol lowering drugs; ‡HDL <40mg/dL.
sical activity using IPAQ in this study were 703.9 MET in the pre-diabetes group and 820.6 MET in the normal group, showing that both groups experienced more than the 600 MET of physical exercise recommended by the ADA [25].
However, the physical activity of the pre-diabetes group was lower than that of the normal group. This result is consistent with and supports the outcome of National Health and Nutrition Examination Survey (NHANES) in the United States of America, which showed that among 7,501 adults between the ages of 20 and 65, the physical ac- tivity of the 433 individuals in the pre-diabetes group was less than that of the 884 individuals in the normal group [26]. Moreover, this study showed sedentary time was 6.5 hours in the pre-diabetic group and 3.7 hours in the nor-
mal group-that is, the former spent 2.8 hours more than the latter in a sedentary state. The results of the current study also showed that the pre-diabetic group had fewer physical activities and longer sedentary time than the nor- mal group, even though the former should act to promote their physical activities. These results supported the find- ing that the major causes of pre-diabetes in women were obesity, waist circumference, increase in sedentary life- style, and decrease of physical activities [11,17,19,27]. Mid- dle-aged women known to have a high burden of Non- Communicable Diseases (NCD), including diabetes, who increased their physical activities have been shown to have decreased blood sugar, triglycerides, LDL levels, and central obesity, as well as increased HDL level [11,23]. The
American Diabetes Association (ADA) states that among asymptomatic pre-diabetic patients, those over 45 years of age with a BMI over 25 kg/m2 are likely to develop dia- betes mellitus if they do not modify their lifestyle [1,21]. In addition, adults who are recognized earlier in the pre-dia- betes stage are more likely to undertake physical activities and weight management, which may play a role in re- ducing the future morbidity rate of diabetes mellitus [19, 27]. Furthermore, the results of a study of 2,300 adults in Europe and globally are corroborated by the results of this study that increased physical activity and lower sedentary time were more closely connected with CVD, and physical activity was positively associated with improved waist circumference, blood pressure, mean arterial pressure, fast- ing insulin, 2 hr-glucose, Homeostasis Model Assessment of Insulin Resistance (HOMA-IR), triglycerides, C-Reac- tive Protein (CRP), and HDL levels [19]. Therefore, it is suggested that in order to reduce or prevent the preva- lence of diabetes in the future, it is important to engage in physical activities, and proactive interventional strategies are required to promote such physical activities.
Evaluation of cholesterol in the pre-diabetes group re- vealed that 23.4% of participants had been diagnosed with hypercholesterolemia or were receiving treatment, 11.1%
had HDL cholesterol levels < 40 mg/dL, and 14.1% had triglyceride levels >240 mg/dL, whereas only 11.2%, 5.5%, and 7.5% of participants in the normal group, respectively, were found to have these characteristics. This study also showed that lower HDL cholesterol or diagnosis of hyper- cholesterolemia was associated with a higher probability of being diagnosed with pre-diabetes.
Menopause-associated estrogen depression in mid- dle-aged females is known to reduce the function of vas- cular endothelial, vascular reserve, and blood lipids [28], which causes a significant increase in BMI, fasting blood glucose, and blood pressure, accelerating the incidence of CVD, including the occurrence of dyslipidemia [29]. In ad- dition, an investigation of 25,925 middle-aged women over 45 years of age without diabetes mellitus, adjusting for BMI, blood pressure, and lifestyle factors, showed that a higher lipoprotein insulin resistance score was asso- ciated with an increased likelihood of being diagnosed with diabetes [29], which supports the results of another study showing that lipoprotein insulin resistance is af- fected by dyslipoproteinemia [30,31]. This insulin resist- ance is also related to obesity, and in cases where HDL is low and triglycerides are increasing, it influences pre-dia- betes, suggesting that management and treatment of cho- lesterol and lifestyle modification are very important for middle-aged women [32]. In addition, high total cholester-
ol causes atherosclerosis and CVD [33]. In this study, uni- variate analysis revealed that significantly more indivi- duals in the pre-diabetes group had prevalence of the CVD than in the normal group. The findings are supported by the Korean National Health Insurance Service-National Sample Cohort study, which revealed that the pre-diabetic group had a 1.3 times higher risk of cardiovascular mor- bidity in the 44.1% of patients with blood glucose levels of 100~125 mg/dL in a group of 13,829 adults observed for an average of 6.5 years [34].
This finding implies that an interventional strategy is needed to prevent middle-aged women with cardiova- scular risk factors from progressing to pre-diabetes and highlights the need for improvement in lifestyle as well as proactive treatment to manage cholesterol in pre-diabetic women.
Our study has some limitations. One limitation is that the cross-sectional study design could not infer the causal relationship. Thus, in future studies a longitudinal design is required regarding the incidence of diabetes to infer causality. Another limitation is that although menopause is a time of important hormonal changes in middle-aged women, this study did not confirm the risk of prediabetes in women of menopausal and pre- and post-menopausal ages. Therefore, we suggest that future research address this point. Another limitation is that some of the socio- demographic characteristics were measured based on re- sponses to a self-report questionnaire, so care must be taken when interpreting it. Despite these limitations, this study is meaningful in that it analyzes relatively large samples of the Korean population with a stratified mul- ti-stage probability cluster questionnaire to identify the predictors of pre-diabetic morbidity in Korean middle- aged women. Previous studies conducted gender compar- isons without limiting the age of onset of diabetes and pre-diabetes. However, very few studies have analyzed middle-aged women who have an increased prevalence of pre-diabetes and diabetes due to hormonal changes.
This study found that low HDL, high cholesterol levels, and a WHtR of more than 0.53 increased pre-diabetes incidence. Therefore, the contribution of this study is that cholesterol management and abdominal obesity manage- ment in middle-aged women can be important in prevent- ing pre-diabetes.
CONCLUSION
This study was conducted to identify factors influenc- ing pre-diabetes with a focus on middle-aged women, who are vulnerable to hormonal changes and physical changes,
in accordance with the standards of diabetes diagnosis based on the National Health and Nutrition Survey. Signi- ficant factors for pre-diabetes were WHtR, hypercho- lesterolemia, and low HDL cholesterol. Additionally, the management of central obesity and cholesterol was found to be essential for middle-aged women with pre-diabetes.
To manage central obesity and cholesterol effectively, middle-aged women should receive education to increase their awareness of non-communicable diseases, such as diabetes, as this could facilitate healthy middle-aged menopause. Accordingly, further investigation of specific factors and characteristics influencing diabetes mellitus in middle-aged women is warranted, as is the development of intervention programs and the investigation of their effectiveness.
CONFLICTS OF INTEREST
The authors declared no conflict of interest.
AUTHORSHIP
Study conception and design acquisition - KKA and SJL; Data col- lection - KKA and SJL; Analysis and interpretation of the data - KKA and SJL; Drafting - KKA; Critical revision of the manuscript - SJL; Final approval - KKA and SJL.
ACKNOWLEDGEMENT
This work was supported by the Dongguk University Research Fund of 2018.
REFERENCES
1. American Diabetes Association. Classification and diagnosis of diabetes: standards of medical care in diabetes-2018. Dia- betes Care. 2018;41(Supplement1):13-27.
https://doi.org/10.2337/dc18-S002
2. Tabák AG, Herder C, Rathmann W, Brunner EJ, Kivimäki M.
Prediabetes: a high-risk state for diabetes development. The Lancet. 2012;379(9833):2279-90.
https://doi.org/10.1016/S0140-6736(12)60283-9
3. Huang Y, Cai X, Mai W, Li M, Hu Y. Association between pre- diabetes and risk of cardiovascular disease and all causes mor- tality: systematic review and meta-analysis. BMJ. 2016;355:
i5953. https://doi.org/10.1136/bmj.i5953
4. DeJesus RS, Breitkopf CR, Rutten LJ, Jacobson DJ, Wilson PM, Sauver JS. Incidence rate of prediabetes progression to dia- betes: modeling an optimum target group for intervention.
Population Health Management. 2017;20(3):216-23.
https://doi.org/10.1089/pop.2016.0067
5. Luo B, Zhang J, Hu Z, Gao F, Zhou Q, Song S, et al. Diabetes-re- lated behaviours among elderly people with pre-diabetes in
rural communities of Hunan, China: a cross-sectional study.
BMJ open. 2018;8(1):e015747.
6. Kim KE, Hwang SY. Impact of physical activity, central obesity and depression on the quality of life according to the presence of cardiovascular risk among menopausal middle-aged wom- en: Secondary data analysis. Korean Journal of Adult Nursing.
2017;29(4):382-92.
7. Kautzky-Willer A, Harreiter J, Pacini G. Sex and gender differ- ences in risk, pathophysiology and complications of type 2 diabetes mellitus. Endocrine Reviews. 2016;37(3):278-316.
https://doi.org/10.1210/er.2015-1137
8. Hamilton MT, Hamilton DG, Zderic TW. Sedentary behavior as a mediator of type 2 diabetes. Diabetes and Physical Acti- vity. 2014;60:11-26. https://doi.org/10.1159/000357332 9. Bhowmik B, Siddiquee T, Mujumder A, Afsana F, Ahmed T,
Mdala I, et al. Serum lipid profile and its association with dia- betes and prediabetes in a rural Bangladeshi population.
International Journal of Environmental Research and Public Health. 2018;15(9):1944.
https://doi.org/10.3390/ijerph15091944
10. Okwechime IO, Roberson S, Odoi A. Prevalence and pre- dictors of pre-diabetes and diabetes amongadults 18 years or older in Florida: a multinomial logistic modeling approach.
Plos One. 2015;10(12):e0145781.
https://doi.org/10.1371/journal.pone.0145781
11. Hilawe EH, Chiang C, Yatsuya H, Wang C, Ikerdeu E, Honjo K, et al. Prevalence and predictors of prediabetes and diabetes among adults in Palau: population-based national STEPS survey. Nagoya Journal of Medical Science. 2016;78(4):475-83.
https://doi.org/10.18999/nagjms.78.4.475
12. Song HJ, Lee EK, Kwon JW. Gender differences in the impact of obesity on health-related quality of life. Asia Pacific Journal of Public Health. 2016;28(2):146-56.
https://doi.org/10.1177/1010539515626267
13. Worrall-Carter L, Ski C, Scruth E, Campbell M, Page K. Sys- tematic review of cardiovascular disease in women: assessing the risk. Nursing & Health Sciences. 2011;13(4):529-35.
https://doi.org/10.1111/j.1442-2018.2011.00645.x
14. Dosi R, Bhatt N, Shah P, Patell R. Cardiovascular disease and menopause. Journal of Clinical and Diagnostic Research. 2014;
8(2):62-4. https://doi.org/10.7860/jcdr/2014/6457.4009 15. Shin HM, Jee SH, Kim JH, Kim MR. The influence on car-
diovascular mortality of the metabolic syndrome in Korean postmenopausal women. The Journal of Korean Society of Menopause. 2012;18(1):6-14.
https://doi.org/10.6118/jksm.2012.18.1.6
16. Lin X, Zhang X, Guo J, Roberts CK, McKenzie S, Wu WC, et al.
Effects of exercise training on cardiorespiratory fitness and bi- omarkers of cardiometabolic health: a systematic review and meta-analysis of randomized controlled trials. Journal of Ame-
rican Heart Association. 2015;4(7):e002014.
https://doi.org/10.1161/JAHA.115.002014
17. Díaz-Redondo A, Giráldez-García C, Carrillo L, Serrano R, García-Soidán FJ, Artola S, et al. Modifiable risk factors asso- ciated with pre-diabetes in men and women: a cross- sectional analysis of the cohort study in primary health care on the evo- lution of patients with pre-diabetes (PREDAPS-Study). BMC Family Practice. 2015;16:5.
https://doi.org/10.1186/s12875-014-0216-3
18. Reports of the 6th National Health and Nutrition Survey in 2014. [Internet]. Osong: Centers for Disease Control and Pre- vention 2014; 2015 [cited 2015 Octber 06]. Available from:
https://www.cdc.go.kr/board.es?mid=a20501000000&bid=
0015&act=view&list_no=65846
19. Swindell N, Mackintosh K, McNarry M, Stephens JW, Sluik D, Fogelholm M, et al. Objectively measured physical activity and sedentary time are associated with cardiometabolic risk factors in adults with pre-diabetes: The PREVIEW Study. Dia- betes Care. 2018;41(3):562-9.
https://doi.org/10.2337/dc17-1057
20. Borel AL, Coumes S, Reche F, Ruckly S, Pépin JL, Tamisier R, et al. Waist, neck circumferences, waist-to-hip ratio: which is the best cardiometabolic risk marker in women with severe obe- sity? The SOON cohort. Plos One. 2018;13(11):e0206617.
https://doi.org/10.1371/journal.pone.0206617
21. Kim JM, Back MK, Ju SH, Shin MY, Kim MJ, Park YH, et al.
Validation of waist-to-height ratio for predicting metabolic syndrome in patients with pre-diabetes. The Korean Journal of Obesity. 2015;24(1):36-43.
https://doi.org/10.7570/kjo.2015.24.1.36
22. Sigmundová D, Sigmund E, Hamrík Z, Kalman M, Pavelka J, Frömel K. Sedentary behaviour and physical activity of rando- mised sample of Czech adults aged 20-64 years: IPAQ and GPAQ studies between 2002 and 2011. Central European Journal of Public Health. 2015;23:S91-6.
https://doi.org/10.21101/cejph.a4142
23. Lin CH, Chiang SL, Yates P, Lee MS, Hung YJ, Tzeng WC, et al.
Moderate physical activity level as a protective factor against metabolic syndrome in middle-aged and older women. Jour- nal of Clinical Nursing 2015;24(9-10):1234-45.
https://doi.org/10.1111/jocn.12683
24. Ligthart S, van Herpt TT, Leening MJ, Kavousi M, Hofman A, Stricker BH, et al. Lifetime risk of developing impaired glucose metabolism and eventual progression from pre-diabetes to type 2 diabetes: a prospective cohort study. Lancet Diabetes &
Endocrinology. 2016;4(1):44-51.
https://doi.org/10.1016/s2213-8587(15)00362-9
25. American Diabetes Association. Standards of medical care in diabetes-2015 abridged for primary care providers. Clinical Diabetes. 2015;33(2):97-111.
https://doi.org/10.2337/diaclin.33.2.97
26. Farni K, Shoham DA, Cao G, Luke AH, Layden J, Cooper RS, et al. Physical activity and pre-diabetes-an unacknowledged mid-life crisis: findings from NHANES 2003-2006. Peer J.
2014;2:e499. https://doi.org/10.7717/peerj.499
27. Mayega RW, Guwatudde D, Makumbi F, Nakwagala FN, Peterson S, Tomson G, et al. Diabetes and pre-diabetes among persons aged 35 to 60 years in eastern Uganda: prevalence and associated factors. Plos One. 2013:8(8):e72554.
https://doi.org/10.1371/journal.pone.0072554
28. Shifren JL, Gass ML. NAMS Recommendations for Clinical Care of Midlife Women Working Group. The North American Menopause Society recommendations for clinical care of mid- life women. Menopause. 2014;21(10):1038-62.
https://doi.org/10.1097/gme.0000000000000319
29. Joo JK, Son JB, Jung JE, Kim SC, Lee KS. Differences of preva- lence and components of metabolic syndrome according to menopausal status. Journal of Korean Society Menopause.
2012;18(3):155-62.
https://doi.org/10.6118/jksm.2012.18.3.155
30. Harada PH, Demler OV, Dugani SB, Akinkuolie AO, Moorthy MV, Ridker P M, et al. Lipoprotein insulin resistance score and risk of incident diabetes during extended follow-up of 20 years: the women's health study. Journal of Clinical Lipidol- ogy. 2017;11(5):1257-67.
https://doi.org/10.1016/j.jacl.2017.06.008
31. Flores-Guerrero JL, Connelly MA, Shalaurova I, Gruppen EG, Kieneker LM, Dullaart RP, et al. Lipoprotein insulin resistance index, a high-throughput measure of insulin resistance, is as- sociated with incident type II diabetes mellitus in the pre- vention of renal and vascular end-stage disease study. Journal of Clinical Lipidology. 2019;13(1):129-37.
https://doi.org/10.1016/j.jacl.2018.11.009
32. Mayo Clinic. Pre-diabetes [Internet]. United States: Mayo Clinic;
2017 [cited 2017 August 02]. Available from:
https://www.mayoclinic.org/diseases-conditions/prediabet es/symptoms-causes/syc-20355278
33. Ravnskov U, de Lorgeril M, Diamond DM, Hama R, Hamazaki T, Hammarskjöld, B, et al. LDL-C does not cause cardiovascu- lar disease: a comprehensive review of the current literature.
Expert Review of Clinical Pharmacology. 2018;11(10):959-70.
https://doi.org/10.1080/17512433.2018.1519391
34. Jeon J, Cho ER, Jung KJ, Jee SH. Fasting blood glucose levels trajectory and risk of cardiovascular disease in Korean pop- ulation: National Health Insurance Service-National Sample Cohort (NHIS-NSC). Journal of Health Informatics Statistics.
2016;41(4):403-10.
https://doi.org/10.21032/jhis.2016.41.4.403