건강한 한국 성인에서 비타민 D 농도와 내장지방면적의 상관관계
백정기, 원지혜, 신혜린, 김대연, 김규남, 이선영
인제대학교 상계백병원 가정의학과
Association between Vitamin D Concentration and Visceral Fat Area in Healthy Korean Adults
Jeong Ki Paek, Ji Hye Won, Hye Rin Shin, Dea Youn Kim, Kyunam Kim, Seon Yeong Lee Department of Family Medicine, Inje University Sanggye Paik Hospital, Seoul, Korea
Background: Studies on the relationship between vitamin D and visceral fat area (VFA; intra-abdominal fat area) have been actively conducted. But, there is a few Korean population-based studies about the association between serum vitamin D level and VFA. The aim of our study was to explore the correlation between serum 25-hydroxyvitamin D (25[OH]D) levels and VFA measured using bioelectrical impedance analysis (BIA; electric impedance) in healthy Korean adults.
Methods: This cross-sectional study involved 1,945 adults aged 20-70 years who visited a health promotion center. All subjects underwent the BIA to estimate the VFA. Serum 25(OH)D level was measured using chem- iluminescent immunoassay. Multiple regression analysis was performed to identify independent correlation of VFA and serum 25(OH)D level.
Results: The prevalence of vitamin D deficiency (25[OH]D: 20-29 ng/mL) and insufficiency (25[OH]D <20 ng/mL) were 54.4% and 38.1%, respectively. After having adjusted age and season, VFA were negatively asso- ciated with serum 25(OH)D levels in both men (P<0.001) and women (P<0.001). The obese group with VFA ≥ 100 cm
2had significant lower serum 25(OH)D level in men (P<0.001) and women (P=0.0034).
Conclusions: VFA measured using BIA could be negatively associated with serum 25(OH)D levels in healthy Korean adult.
Korean J Health Promot 2017;17(3):129-136
Keywords: Vitamin D, Intra-abdominal fat, Electric impedance, Obesity
■ Received: July 10, 2017 ■ Accepted: August 21, 2017
■Corresponding author : Seon Yeong Lee, MD, PhD Department of Family Medicine, Inje University Sanggye Paik Hospital, 1342 Dongil-ro, Nowon-gu, Seoul 01757, Korea Tel: +82-2-950-1150, Fax: +82-2-952-4093
E-mail: [email protected]
Copyright ⓒ 2017 The Korean Society of Health Promotion and Disease Prevention
This is an Open Access article distributed under the terms of the Creative Commons Attribution Non-Commercial License (http://creativecommons.org/licenses/by-nc/3.0/) which permits unrestricted noncommercial use, distribution, and reproduction in any medium, provided the original work is properly cited.
Introduction
In the past, it has been demonstrated that vitamin D is an essential nutrient of bone metabolism and calcium homeostasis.
1)In recent years, it has become clearer that vi- tamin D has additional physiological functions by cell sig- naling and regulating gene expression.
2)Several studies have
reported that vitamin D deficiency affects obesity-related metabolic disease including diabetes, cardiovascular disease, and moreover autoimmune disease and cancer.
3,4)In this context, the relationship between obesity, which
is being recognized as a major global public health problem,
and vitamin D is interestingly evaluated. Several cross-sec-
tional study and meta-analysis have reported that blood vi-
tamin D concentration is negatively correlated with obesity
indicators, such as body weight, body mass index (BMI),
percentage body fat (PBF), visceral adipose tissue (VAT).
5,6)The risk of metabolic diseases appears based on different
region of body fat accumulates, especially, visceral adipos-
ity seems to have a closer relationship than another anthro-
pometric indicator.
7)On that basis, researches for the rela- tionship between visceral fat and vitamin D are actively dis- cussed and studied. Our study is to explore the correlation between visceral fat area (VFA) and vitamin D in healthy Korean adults, using bioelectrical impedance analysis (BIA) as a simple and inexpensive method for measure of VFA.
Methods
1. Subjects
This retrospective cross-sectional study based on data ex- tracted from the medical records. We enrolled 2,881 sub- jects coming to the Health Promotion Center, for routine health check-up during April to December in 2016. A total of 1,945 subjects (1,395 men and 550 women) were in- cluded for analysis according to the following eligibility criteria. Inclusion criteria were as follows: 1) age of 20-70 years, 2) individuals who measured serum 25-hydroxyvita- min D (25[OH]D) concentration and conducted BIA.
Exclusion criteria were as follows: 1) individuals with BMI less than 18.5 kg/m
2, 2) with kidney or liver disease, 3) with diabetes, inflammatory bowel disease and absorptive dis- ease, 4) with thyroid or parathyroid disease, 5) with malig- nancy, psychiatric disease, and 6) with history of organ transplantation. Demographic information containing age, gender, height, weight, smoking behavior, alcohol behavior, past medical history and medication history was obtained from a standardized questionnaire. This study was con- ducted in accordance with the Declaration of Helsinki and approved by the institutional review board of the Inje University Sanggye Paik Hospital (IRB No. 2017-06-029).
2. Laboratory measurements
All blood samples were taken after at least 12 hour-fasting. Total cholesterol, triglyceride (TG), high den- sity lipoprotein cholesterol (HDLC), low density lip- oprotein cholesterol (LDLC), fasting glucose were meas- ured using dedicated reagents by automatic chemistry ana- lyzer (AU 5400; Beckman-Coulter, Fullerton, CA, USA).
Serum 25(OH)D levels were measured using chem- iluminescent immunoassay (Advia Vitamin D Total assay;
Siemens Healthcare, Erlangen, Germany).
3. Anthropometric and body fat measurements
Anthropometric measurement was taken after at least 12 hour-fasting with subjects wearing light lobe and no shoes.
Weight and height were measured to the nearest 0.1 kg and 0.1 cm each other using an automatic scale (BSM330;
Biospace, Seoul, Korea). Body mass index was calculated as weight in kilograms divided by height in meters squared.
VFA and PBF were estimated by the bioelectrical im- pedance analysis (BIA) method (Inbody770; Biospace).
There is a diversity of references regarding on range of blood vitamin d levels. In the current study, a serum level of 25(OH)D <20 ng/mL is defined as vitamin D deficiency, whereas a level 20-29 ng/mL is insufficient, and a level ≥30 ng/mL is sufficient.
8)Obesity was defined as a BMI value exceeding 25 kg/m
2.
9)Or obesity was defined as PBF ≥25%
in men and PBF ≥30% in women.
10)Visceral fat obesity was defined as a VFA exceeding 100 cm
2.
11)4. Statistical analyses
Continuous variables are expressed as means±standard deviation, categorical variables were presented as a total number (percentage). The subgroup comparisons between the men and women group were tested using in- dependent-sample t-test. Pearson correlation analysis was performed to analyze the relationships between serum 25(OH)D and other variables. Multiple regression analysis was performed to identify independent correlations of obesity-related variables and serum 25(OH)D levels.
Participants were divided into obese and non-obese group
according to their obesity-related variables, the subgroup
comparisons in serum vitamin D status between obese and
non-obese group were conducted using independent-sample
t-test. The local-weighted scatterplot smoothing models
(Loess) was used to explore the association between obe-
sity-related variables and serum 25(OH)D levels of gender-
and age-group. Loess is a nonparametric method for fitting
a smooth curve between two variables, which was per-
formed in R statistical package (R version 3.2.5). Statistical
analysis was performed by SPSS statistical software version
19.0 (IBM Corp., Armonk, NY, USA). A P-value <0.05
was regarded as statistically significant.
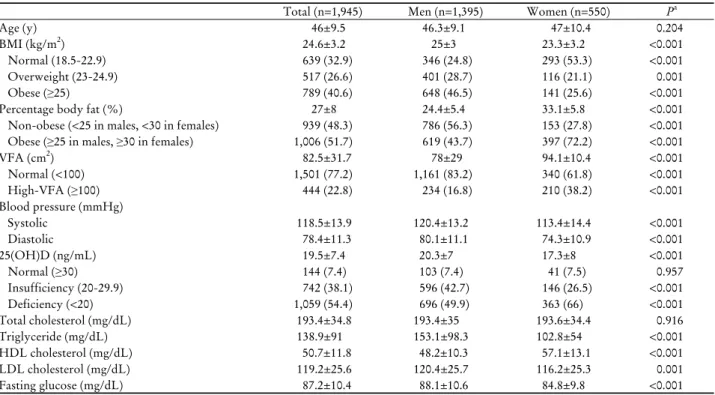
Total (n=1,945) Men (n=1,395) Women (n=550) Pa
Age (y) 46±9.5 46.3±9.1 47±10.4 0.204
BMI (kg/m2) 24.6±3.2 25±3 23.3±3.2 <0.001
Normal (18.5-22.9) 639 (32.9) 346 (24.8) 293 (53.3) <0.001
Overweight (23-24.9) 517 (26.6) 401 (28.7) 116 (21.1) 0.001
Obese (≥25) 789 (40.6) 648 (46.5) 141 (25.6) <0.001
Percentage body fat (%) 27±8 24.4±5.4 33.1±5.8 <0.001
Non-obese (<25 in males, <30 in females) 939 (48.3) 786 (56.3) 153 (27.8) <0.001 Obese (≥25 in males, ≥30 in females) 1,006 (51.7) 619 (43.7) 397 (72.2) <0.001
VFA (cm2) 82.5±31.7 78±29 94.1±10.4 <0.001
Normal (<100) 1,501 (77.2) 1,161 (83.2) 340 (61.8) <0.001
High-VFA (≥100) 444 (22.8) 234 (16.8) 210 (38.2) <0.001
Blood pressure (mmHg)
Systolic 118.5±13.9 120.4±13.2 113.4±14.4 <0.001
Diastolic 78.4±11.3 80.1±11.1 74.3±10.9 <0.001
25(OH)D (ng/mL) 19.5±7.4 20.3±7 17.3±8 <0.001
Normal (≥30) 144 (7.4) 103 (7.4) 41 (7.5) 0.957
Insufficiency (20-29.9) 742 (38.1) 596 (42.7) 146 (26.5) <0.001
Deficiency (<20) 1,059 (54.4) 696 (49.9) 363 (66) <0.001
Total cholesterol (mg/dL) 193.4±34.8 193.4±35 193.6±34.4 0.916
Triglyceride (mg/dL) 138.9±91 153.1±98.3 102.8±54 <0.001
HDL cholesterol (mg/dL) 50.7±11.8 48.2±10.3 57.1±13.1 <0.001
LDL cholesterol (mg/dL) 119.2±25.6 120.4±25.7 116.2±25.3 0.001
Fasting glucose (mg/dL) 87.2±10.4 88.1±10.6 84.8±9.8 <0.001
Abbreviations: BMI, body mass index; VFA, visceral fat area; 25(OH)D; 25-hydroxyvitamin D; HDL, high density lipoprotein; LDL, low density lipoprotein.
Variables are presented as mean±standard deviation or number (%).
aP-value from an independent-sample t-test for continuous variables and χ2 test for categorical variables.
Table 1. Characteristics of study subjects
Results
1. The characteristics of the study subjects
The characteristics of the subjects were shown in Table 1.
The prevalence of vitamin D deficiency was higher in wom- en (66%) than in men (49.9%), while the prevalence of vita- min D insufficiency was higher in men (42.7%) than in women (26.5%). In the case of sufficient vitamin D level, prevalence was shown similar in men (7.4%) and in women (7.5%). The prevalence of obesity based on BMI was higher in men (46.5%) than in women (25.6%), while the preva- lence of obesity based on PBF was higher in women (72.2%) than in men (43.7%). In the case of high VFA lev- el, prevalence was discovered higher in women (38.2%) than in men (16.8%). There was significant difference in BMI, PBF, VFA, systolic blood pressure, diastolic blood pressure, serum 25(OH)D, TG, HDLC, LDLC, fasting glucose. However, there was no difference in age (P=0.204) and total cholesterol (P=0.916) between the men and women.
2. Relation analysis of vitamin D and obesity-related variables
To evaluate the variables associated with serum 25(OH)D levels, correlation analysis was conducted (Table 2). Serum 25(OH)D levels had negative association with VFA, BMI, PBF, TG in both men and women, whereas age had pos- itive association. Serum 25(OH)D levels was negatively as- sociated with systolic and diastolic blood pressure, total cholesterol, fasting glucose only in men. Serum 25(OH)D levels was positively associated with HDLC only in men, serum 25(OH)D levels was positively associated with LDLC only in women. Changes of serum 25(OH)D levels according to their obesity-related variables between the obese and non-obese groups (Figure 1). The non-obese groups divided by BMI and VFA presented a higher serum 25(OH)D levels in both men and women. Although the non-obese group divided by PBF exhibited a significantly higher serum 25(OH)D levels only in men.
3. Regression analysis
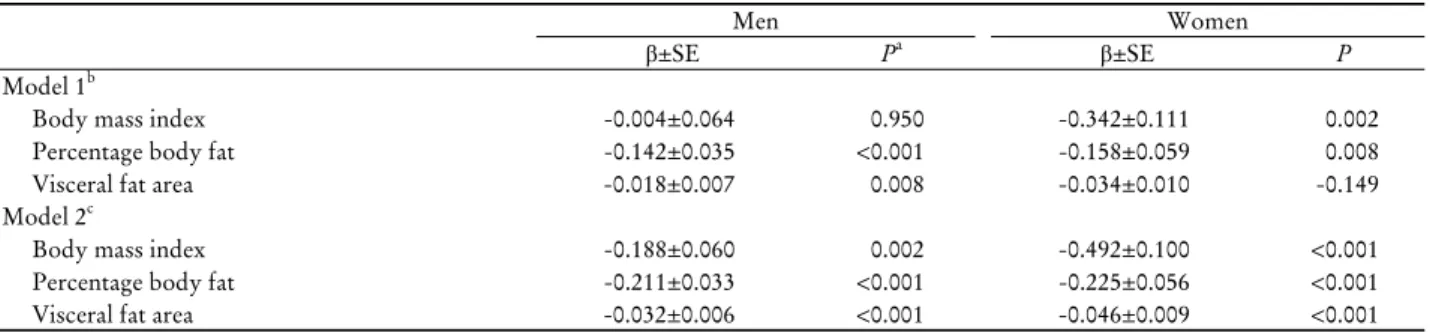
After having adjusted age and season, BMI, PBF, VFA
A B
C D
E F
Figure 1. Differential serum 25-hydroxyvitamin D (25[OH]D) concentrations in subjects with or without obesity. (A, B) Comparison of serum 25-hydroxyvitamin D (25[OH]D) levels according to body mass index (BMI) in men and women. Subjects with a BMI ≥25 kg/m
2were classified as obese. (C, D) Comparison of serum 25(OH)D levels according to percentage body fat (PBF) in men and women.
Men with a PBF ≥25 % and women with a PBF ≥30 % were classified as obese. (E, F) Comparison of serum 25[OH]D levels according to visceral fat area (VFA) in men and women. Subjects with a VFA ≥100 cm
2were classified as obese. Data are presented as mean±standard deviation.
*Pvalue from an independent-sample
t-test.
Men Women
ra Pb r P
Age 0.142 <0.001 0.305 <0.001
Body mass index -0.127 <0.001 -0.134 0.002 Percentage body fat -0.195 <0.001 -0.096 0.025 Visceral fat area -0.185 <0.001 -0.153 <0.001 Systolic blood pressure -0.079 0.003 -0.038 0.379 Diastolic blood pressure -0.115 <0.001 -0.064 0.133 Total cholesterol -0.087 0.001 0.060 0.160 Triglyceride -0.312 <0.001 -0.163 <0.001 High density lipoprotein
cholesterol 0.058 0.031 0.006 0.892
Low density lipoprotein
cholesterol -0.029 0.284 0.105 0.014
Fasting glucose -0.062 0.020 -0.029 0.493 Abbreviation: 25(OH)D, 25-hydroxyvitamin D.
aCorrelation coefficients.
bP-value are calculated by Pearson correlation analysis.
Table 2. Correlation between serum 25(OH)D and variables
were negatively associated with serum 25(OH)D levels in the multiple regression analysis (Table 3). The Loess smoothing curves overall appeared that serum 25(OH)D levels tend to decrease with increasing obesity-related varia- bles gene, in some cases, which shown different slope ac- cording specific part of curves (Figure 2). Serum 25(OH)D level presented consistent decrease according with increas- ing BMI in men, radical decrease was observed in women at the range of BMI over 25 kg/m
2. Serum 25(OH)D level represented decreasing trend at the range of VFA under 100 cm
2and over 100 cm
2in men and women respectively.
Serum 25(OH)D level presented decrease according with increasing PBF all over the scales in men, decrease was ob- served only at the range of PBF over 35% in women.
Serum 25(OH)D level presented decrease according with increasing VFA all over scales in women over 50 years, de- crease was observed only at the range of with VFA over 100 cm
2in women under 50 years old.
Discussion
South Korea is one of the countries which has a high prevalence of vitamin D deficiency or insufficiency,
12)fur- thermore, lifestyle is gradually changing into fewer outdoor activities during the daytime. Nevertheless, there are fewer domestic researches on relationship between vitamin D lev- el and obesity. The aim of our study was to evaluate the association serum vitamin D levels and obesity-related vari- ables, especially VFA.
We analyzed men and women separately due to differ- ence in distribution of body fat between men and women.
The results of the correlation analysis and multiple re-
gression analysis indicated that BMI, PBF, VFA were neg-
atively associated with serum 25(OH)D levels in men and
women. There is a significant high levels of serum vitamin
D in non-obese groups as compared to the obese groups,
except for the case of women with PBF <30%. In existing
studies, researches have reported inconsistent outcomes on
association between blood vitamin D levels and obesity-re-
Men Women
β±SE Pa β±SE P
Model 1b
Body mass index -0.004±0.064 0.950 -0.342±0.111 0.002
Percentage body fat -0.142±0.035 <0.001 -0.158±0.059 0.008
Visceral fat area -0.018±0.007 0.008 -0.034±0.010 -0.149
Model 2c
Body mass index -0.188±0.060 0.002 -0.492±0.100 <0.001
Percentage body fat -0.211±0.033 <0.001 -0.225±0.056 <0.001
Visceral fat area -0.032±0.006 <0.001 -0.046±0.009 <0.001
Abbreviation: SE, standard error.
aP-value are calculated by multiple regression analysis.
bModel 1 was adjusted for age, SBP, DBP, total cholesterol, TG, HDL-C, LDL-C, glucose and season.
cModel 2 was adjusted for age and season. Model 2 was final model.
Table 3. Regression analysis of relationship between vitamin D and obesity indices
Abbreviations: Loess, local-weighted scatterplot smoothing models; 25(OH)D, 25-hydroxyvitamin D; BMI, body mass index; VFA, visceral fat area; PBF, percentage body fat.
Figure 2. Correlation between 25(OH)D and fatness indices in men and women (A-C); in women aged ≥50 and <50 years (D).
Smoothing curve with 95% confidence interval (shaded areas) are fitted by a Loess curve.
A B
C D
lated variables. Majority of studies was reported that obe- sity-related variables, such as, weight, waist circumference, BMI, PBF, visceral adipose tissue have negative correlation with blood vitamin D levels.
13-15)In several studies, VFA showed significant correlation with blood vitamin D levels, although weight, waist circumference but not BMI.
16,17)As vitamin D binding proteins (VDR) are discovered in many tissues, it has been identified that vitamin D affects various medical conditions. VDR play a role in various bio- logical responses, such as, cell proliferation-inhibition, cell maturation and immune system.
18)To explain why vitamin D deficiency occurs in obese population, the following mechanisms have been suggested: 1) less sunlight exposure due to less activity, 2) reduced vitamin D synthetic ca- pacity, 3) sequestration of vitamin D in adipose tissue, and 4) dilution effect by quantitative increase.
19)Several mecha- nisms have been suggested to explain the role of vitamin D in obesity, but it is not clear yet, which include: 1) Increased levels of parathyroid hormone in vitamin D defi- ciency, that can increase lipogenesis by overflow of calcium into adipocytes,
20)2) Decreased leptin synthesis due to de- pletion of vitamin D, that may increase appetite and lead to obesity.
21)Vitamin D deficiency less than 20 ng/mL (50 nmol/L) had significant correlation with occurrence of obe- sity in the cohort study of 2,460 Norwegian subjects.
22)A meta-analysis presented that vitamin D supplement did not improve obesity-related variables,
23,24)whereas other meta-analysis presented that blood vitamin D levels in- crease as weight or PBF decreases.
25)Sun et al.
16)demonstrated that serum vitamin D levels are negatively correlated with VFA using magnetic resonance imaging (MRI), which is in correspond with outcome of our study, But not BMI. Shin et al.
17)found that 25(OH)D is negatively correlated with visceral adipose tissue using and is not associated with waist circumference and BMI.
These findings were partially similar to the results of our study. Kim and Kim
26)suggested that 25(OH)D is asso- ciated with adiposity but not with the indicators used to estimate adiposity, such as waist circumference or BMI.
These findings were inconsistent with our outcomes that BMI, PBF, VFA estimated by BIA were associated with 25(OH)D. Most of previous studies used sophisticated methods to estimate of the amount of adipose tissue, such as computed tomography (CT), dual-energy x-ray absorpti- ometry (DEXA) and MRI. Above mentioned imaging mo-
dalities are precise, but expensive or higher risk related to radiation. BIA is modality to assess body composition from differences of tissue conductivity. Existing studies demon- strated that BIA accurately estimate body fat and VFA.
27-29)Nagai et al.
27)reported that VFA measured using BIA is strongly correlated with CT-measured VFA (r=0.905, P<0.01). BIA is considered useful method to measure adiposity, relatively less expensive, less exposed to radiation and easier. In our knowledge, researches of association be- tween blood vitamin D levels and VFA measured using BIA are few and none of domestic research exists.
The strength of our study is to evaluate the relationship between serum 25(OH)D and VFA in a large number of Korean healthy subjects and use BIA, which is easier, less expensive and less risk of radiation, to measure VFA.
Whereas there are several limitations. First, we could not reveal the causal relationship between vitamin D and VFA, because this study was a cross-sectional study. Second, the results of this study could not be generalized because there may be selection bias in that only healthy adults who vis- ited the Health Promotion Center were enrolled. Third, self-reporting questionnaire precluded from taking com- plete demographic data. Information on menopausal status and vitamin D supplementation as mentioned above, drink- ing, smoking and degree of sunlight exposure was in- complete and unreliable. Therefore, prospective studies should be conducted on more populations in the future.
Zhang et al.
30)discovered that higher VFA increases the risk of vitamin D deficiency and insufficiency in men and pre-menopausal women, but not in post-menopausal women. In our study, we could not have a reliable in- formation about menopausal status owing to limitations of self-reporting questionnaire, accordingly, women were grouped into two based on the age of 50 instead of meno- pausal status. (Figure 2D) In our study, serum vitamin D level reduces as VFA increases in women over 50 years old, menopause or impending. In this regard, there are disagree- ment with the results of above-mentioned. A relative small number of women, lack of information about menopausal status and vitamin D supplement are considered to be a cause of these disagreement. Thus, much more research re- mains to be done to further understand difference in the correlation of VFA and vitamin D status between post- and premenopausal women.
Interestingly, in the smooth curve fitted by Loess shown
different patterns of the shape and slope of the curves be- tween men and women. Furthermore, the points of in- flection on curves almost matched with existing reference points of obesity. To determine the cutoff point of obe- sity-related variable for assessing risk of vitamin D defi- ciency or insufficiency, more research is needed.
In conclusion, VFA measured using BIA could be neg- atively correlated with serum 25(OH)D levels in healthy Korean adult. VFA measured using BIA is expected to be a convenient biomarker for assessing risk of vitamin D defi- ciency or insufficiency in routine health check-up in the near future, more needs to prospective researches on large of subjects.
요약
연구배경: 비타민 D와 내장지방의 상관관계에 대한 연구
가 활발히 이루어지고 있으나 , 국내 연구는 많지 않은 실정
이다. 본 연구는 건강한 한국인 성인에서 혈청 비타민 D 농도와 생체 전기 저항 측정법으로 측정한 내장지방면적 사이의 연관성에 대해 알아보고자 하였다.
방법: 본 단면연구는 건강증진센터를 방문한 20-70세의 1,945명의 성인을 대상자로 하였다. 모든 대상자에서 생체 전기 저항 측정법으로 내장지방면적을 추정하고, 화학발광 면역 분석법으로 혈청 25-hydroxyvitamin D (25[OH]D) 농 도를 측정하였다. 다중회귀분석을 시행하여 내장지방면적 과 혈청 25(OH)D의 독립적인 상관관계를 확인하였다.
결과: 비타민 D 결핍(25[OH]D: 20-29 ng/mL)과 부족 (25[OH]D <20 ng/mL)의 유병률은 각각 54.4%와 38.1%였 다. 나이와 계절을 보정한 후, 내장지방면적은 남성(P<0.001) 및 여성(P<0.001)에서 혈청 25(OH)D 농도와 음의 상관관계 를 보였다 .
결론: 건강한 한국인 성인에서 생체 전기 저항 측정법으 로 측정한 내장지방면적과 혈청 25(OH)D 농도는 음의 상 관관계를 보였다.
중심 단어: 비타민 D, 내장지방면적, 생체 전기 저항 측정 법, 비만
REFERENCES
1. Lips P. Vitamin D deficiency and secondary hyperparath- yroidism in the elderly: consequences for bone loss and fractures and therapeutic implications. Endocr Rev 2001;22(4):477-501.
2. Ahn J, Albanes D, Berndt SI, Peters U, Chatterjee N, Freedman ND, et al. Vitamin D-related genes, serum vitamin D concen-
trations and prostate cancer risk. Carcinogenesis 2009;30(5):
769-76.
3. Cardoso AT, Nanji L, Costa J, Vaz-Carneiro A. Analysis of the cochrane review: vitamin D supplementation for prevention of cancer in adults. Cochrane Database Syst Rev. 2014, 6:CD007469. Acta Med Port 2014;27(4):411-3.
4. Strange RC, Shipman KE, Ramachandran S. Metabolic syn- drome: a review of the role of vitamin D in mediating suscepti- bility and outcome. World J Diabetes 2015;6(7):896-911.
5. Yao Y, Zhu L, He L, Duan Y, Liang W, Nie Z, et al. A meta-analysis of the relationship between vitamin D deficiency and obesity. Int J Clin Exp Med 2015;8(9):14977-84.
6. Zittermann A, Ernst JB, Gummert JF, Börgermann J. Vitamin D supplementation, body weight and human serum 25-hydrox- yvitamin D response: a systematic review. Eur J Nutr 2014;53(2):367-74.
7. Fox CS, Massaro JM, Hoffmann U, Pou KM, Mauro- vich-Horvat P, Liu CY, et al. Abdominal visceral and subcuta- neous adipose tissue compartments: association with metabolic risk factors in the Framingham Heart Study. Circulation 2007;116(1):39-48.
8. Holick MF. Vitamin D deficiency. N Engl J Med 2007;357(3):
266-81.
9. Organization WH. The Asia-Pacific perspective: redefining obesity and its treatment. Sydney: Health Communications Australia, 2000.
10. Sim SJ, Park HS. The cut-off values of body fat to identify car- diovascular risk among Korean adults. J Korean Soc Study Obes 2004;13(1):14-21.
11. Choi HJ, Yoon K, Han KH, Kim SH. The cut-off values of the visceral fat area to identify metabolic syndrome among Korean adults: using visceral fat area presented by body composition analyzer, inbody 4.0. Korean J Obes 2006;15(4):219-26.
12. Lips P, Hosking D, Lippuner K, Norquist JM, Wehren L, Maalouf G, et al. The prevalence of vitamin D inadequacy amongst women with osteoporosis: an international epidemio- logical investigation. J Intern Med 2006;260(3):245-54.
13. Arunabh S, Pollack S, Yeh J, Aloia JF. Body fat content and 25-hydroxyvitamin D levels in healthy women. J Clin Endocrinol Metab 2003;88(1):157-61.
14. Snijder MB, van Dam RM, Visser M, Deeg DJ, Dekker JM, Bouter LM, et al. Adiposity in relation to vitamin D status and parathyroid hormone levels: a population-based study in older men and women. J Clin Endocrinol Metab 2005;90(7):4119-23.
15. Jorde R, Sneve M, Emaus N, Figenschau Y, Grimnes G.
Cross-sectional and longitudinal relation between serum 25-hydroxyvitamin D and body mass index: the Tromsø study.
Eur J Nutr 2010;49(7):401-7.
16. Sun X, Cao ZB, Tanisawa K, Ito T, Oshima S, Ishimi Y, et al.
Associations between the serum 25(OH)D concentration and lipid profiles in Japanese men. J Atheroscler Thromb 2015;22(4):355-62.
17. Shin SR, Han AL, Park SH. Vitamin D status and its relation with abdominal adiposity and cardiovascular risk factors of Korean adults in certain areas. Korean J Obes 2015;24(1):30-5.
18. Ross AC, Manson JE, Abrams SA, Aloia JF, Brannon PM, Clinton SK, et al. The 2011 report on dietary reference intakes for calcium and vitamin D from the Institute of Medicine: what clinicians need to know. J Clin Endocrinol Metab
2011;96(1):53-8.
19. Vanlint S. Vitamin D and obesity. Nutrients 2013;5(3):949-56.
20. Hjelmesaeth J, Hofsø D, Aasheim ET, Jenssen T, Moan J, Hager H, et al. Parathyroid hormone, but not vitamin D, is associated with the metabolic syndrome in morbidly obese women and men: a cross-sectional study. Cardiovasc Diabetol 2009;8:7.
21. Kremer R, Campbell PP, Reinhardt T, Gilsanz V. Vitamin D status and its relationship to body fat, final height, and peak bone mass in young women. J Clin Endocrinol Metab 2009;94(1):67-73.
22. Mai XM, Chen Y, Camargo CA Jr, Langhammer A. Cross-sec- tional and prospective cohort study of serum 25-hydroxyvitamin D level and obesity in adults: the HUNT study. Am J Epidemiol 2012;175(10):1029-36.
23. Pathak K, Soares MJ, Calton EK, Zhao Y, Hallett J. Vitamin D supplementation and body weight status: a systematic review and meta-analysis of randomized controlled trials. Obes Rev 2014;15(6):528-37.
24. Chandler PD, Wang L, Zhang X, Sesso HD, Moorthy MV, Obi O, et al. Effect of vitamin D supplementation alone or with cal- cium on adiposity measures: a systematic review and meta-analysis of randomized controlled trials. Nutr Rev 2015;73(9):577-93.
25. Pannu PK, Zhao Y, Soares MJ. Reductions in body weight and percent fat mass increase the vitamin D status of obese subjects:
a systematic review and metaregression analysis. Nutr Res 2016;36(3):201-13.
26. Kim D, Kim J. Association between serum 25-hydroxyvitamin D levels and adiposity measurements in the general Korean population. Nutr Res Pract 2016;10(2):206-11.
27. Nagai M, Komiya H, Mori Y, Ohta T, Kasahara Y, Ikeda Y.
Estimating visceral fat area by multifrequency bioelectrical impedance. Diabetes Care 2010;33(5):1077-9.
28. Xu L, Cheng X, Wang J, Cao Q, Sato T, Wang M, et al.
Comparisons of body-composition prediction accuracy: a study of 2 bioelectric impedance consumer devices in healthy Chinese persons using DXA and MRI as criteria methods. J Clin Densitom 2011;14(4):458-64.
29. Ryo M, Maeda K, Onda T, Katashima M, Okumiya A, Nishida M, et al. A new simple method for the measurement of visceral fat accumulation by bioelectrical impedance. Diabetes Care 2005;28(2):451-3.
30. Zhang M, Li P, Zhu Y, Chang H, Wang X, Liu W, et al. Higher visceral fat area increases the risk of vitamin D insufficiency and deficiency in Chinese adults. Nutr Metab (Lond) 2015;12:50.
![Figure 1. Differential serum 25-hydroxyvitamin D (25[OH]D) concentrations in subjects with or without obesity](https://thumb-ap.123doks.com/thumbv2/123dokinfo/4703413.259462/4.892.86.427.160.402/figure-differential-serum-hydroxyvitamin-oh-concentrations-subjects-obesity.webp)