ABSTRACT
Background: The big data provided by Health Insurance Review and Assessment (HIRA) contains data from nearly all Korean populations enrolled in the National Health Insurance Service. We aimed to identify the incidence of facial fractures and its trends in Korea using this big data from HIRA.
Methods: We used the Korean Standard Classification of Disease and Cause of Death 6, 7 for diagnosis codes. A total of 582,318 patients were included in the final analysis. All statistical analyses were performed using SAS software and SPSS software.
Results: The incidence of facial fractures consistently declined, from 107,695 cases in 2011 to 87,306 cases in 2016. The incidence of facial fractures was the highest in June 2011 (n = 26,423) and lowest in January 2014 (n = 10,282). Nasal bone fractures were the most common, followed by orbit and frontal sinus fractures. The percentage of nasal bone fractures declined, whereas those of orbital fractures increased from 2011 to 2016 (P < 0.001). Among orbital fractures, inferior wall fractures were the most common, followed by medial wall fractures.
Among mandibular fractures, angle fractures were the most common, followed by condylar process and symphysis fractures. Although it was difficult to predict the most common type of zygomatic and maxilla fractures, their incidence consistently declined since 2011.
Conclusion: We observed trends in facial fractures in Korea using big data including information for nearly all nations in Korea. Therefore, it is possible to predict the incidence of facial fractures. This study is meaningful in that it is the first study that investigated the incidence of facial fractures by specific type.
Keywords: Big Data; Bone Fractures; Facial Bones
INTRODUCTION
Big data has begun garnering attention and is now widely used in many areas of society.1 In an attempt to keep abreast with these advances and to promote health, the Korean government has granted access to health utilization information by researchers in the private and public sectors since 2015. This was possible only because Korea adopted a single health insurance system known as the National Health Insurance Service (NHIS). Korea is a prime example of a country in which the entire population is enrolled in a single health insurance system.
Original Article
Received: Jun 20, 2019 Accepted: Nov 21, 2019 Address for Correspondence:
Yong-Ha Kim, MD, PhD
Department of Plastic and Reconstructive Surgery, Yeungnam University College of Medicine, 170 Hyeonchung-ro, Nam-gu, Daegu 42415, Republic of Korea.
E-mail: [email protected]
© 2020 The Korean Academy of Medical Sciences.
This is an Open Access article distributed under the terms of the Creative Commons Attribution Non-Commercial License (https://
creativecommons.org/licenses/by-nc/4.0/) which permits unrestricted non-commercial use, distribution, and reproduction in any medium, provided the original work is properly cited.
ORCID iDs Cheol-Heum Park
https://orcid.org/0000-0003-0410-7158 Kyu Jin Chung
https://orcid.org/0000-0001-6335-1818 Tae Gon Kim
https://orcid.org/0000-0002-6738-4630 Jun Ho Lee
https://orcid.org/0000-0002-0062-6420 Il-Kug Kim
https://orcid.org/0000-0002-2428-8403 Yong-Ha Kim
https://orcid.org/0000-0002-1804-9086 Presentation
This article was presented at the PRS Korea 2018 on November 9–11, 2018 in Seoul, Korea.
Cheol-Heum Park , Kyu Jin Chung , Tae Gon Kim , Jun Ho Lee , Il-Kug Kim , and Yong-Ha Kim
Department of Plastic and Reconstructive Surgery, Yeungnam University College of Medicine, Daegu, Korea
Big Data Statistical Analysis of Facial Fractures in Korea
Surgery
Funding
This work was supported by a 2017 Yeungnam University Research Grant.
Disclosure
The authors have no potential conflicts of interest to disclose.
Author Contributions
Conceptualization: Kim YH, Park CH, Chung KJ; Data curation: Park CH; Formal analysis:
Park CH; Funding acquisition: Park CH;
Investigation: Park CH; Methodology: Park CH; Project administration: Kim YH, Park CH; Resources: Park CH; Software: Park CH;
Supervision: Kim YH, Park CH, Chung KJ;
Validation: Kim YH, Park CH, Chung KJ, Kim TG, Lee JH, Kim IK; Visualization: Kim YH, Park CH, Chung KJ, Kim TG, Lee JH, Kim IK; Writing - original draft: Park CH; Writing - review &
editing: Park CH.
The Health Insurance Review and Assessment (HIRA) database stores all data from the NHIS and has provided access to these data to healthcare professionals for research purposes since 2015. Researchers (e.g., physicians, nurses, medical technicians) can access health utilization data from individuals who are registered in the NHIS.1 With the preventive medicine and neurology departments at the forefront, there are many ongoing studies in the medical field utilizing this data.2,3 Facial fracture analysis is another field that could benefit greatly from this data.
The face is the most conspicuous part of the human body. For this reason, a defect in the facial bones critically undermines a person's quality of life. There are significant negative social and functional impacts related to facial trauma and scarring.4 In cases of facial trauma, a patient's physical appearance needs to be recovered to pre-accident conditions via surgery, which is both time-consuming and costly.5
Identifying and predicting trends in facial fractures would promote health, ultimately boosting quality of life. Accurately understanding and predicting potential facial fractures would undoubtedly be a valuable accomplishment from incorporating big data into medicine.
To date, studies on facial fractures have been retrospective studies in single hospitals and single departments.6-8 There have also been studies that have analyzed the trends in facial fractures within a region by combining data from medical institutions within the region.
The big data provided by HIRA contains data from nearly all Korean populations enrolled in the NHIS. We aimed to identify the incidence of facial fracture and its trends in Korea using this big data from HIRA. It will be the first study using and analyzing the database of almost all populations. Therefore, it can be more accurate than other studies about the incidence of facial fractures in Korea.
METHODS
Data extraction
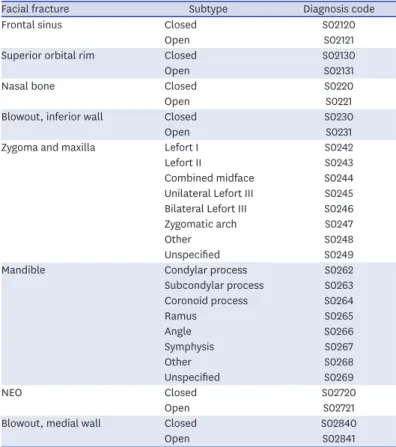
Billing statement identification codes for all patients who received healthcare services because of facial fractures in Korea between January 2010 and August 2017 were obtained from HIRA. The billing statement identification code contains the patient ID and diagnosis code, showing when a specific patient received healthcare services and for what type of facial fracture. Korean Standard Classification of Disease and Cause of Death (KCD) 6 was implemented in 2011 and has been revised to KCD 7 in 2015. KCD 7 is almost identical to KCD 6 in terms of facial fracture categories. Therefore, we used the KCD 6 and 7 for diagnosis codes (Table 1). The billing statement also contained information regarding gender and age, which enabled researchers to conduct gender-and age-specific analyses.
Data processing
A total of 83,014,212 billing statements were obtained from HIRA. KCD 6 was implemented in 2011; therefore, we excluded data from the year 2010, as there were many omitted or newly created diagnosis codes compared to those in KCD 5. Data from January 2017 to August 2017 were also excluded because they were incomplete. To prevent duplicate counting of patients who received several treatments for the same diagnosis code, we only included the earliest hospital utilization data for a single facial fracture for each individual to calculate the
incidence of the corresponding facial fracture in the corresponding year. As a result of this process, a total of 582,318 patients were included in the final analysis (Fig. 1).
Data analysis
We analyzed the number of facial fractures by year, month (season), age, gender, and type of fracture. We divided age groups into three groups: youth, adult, and elderly. The upper limit of the youth group was set to 19 years, the age that generally marks the end of growth. The youth group was further divided into infantile (0–2 years), child (3–12 years), and adolescent (13–19 years). The adult and elderly groups were divided at 60 years of age, based on the judgment that differences in activity according to employment status has a substantial impact on facial fractures. We performed a cross-tabulation analysis using the gender-specific number of facial fractures in a given year, as well as yearly man and woman populations shown in the annual health insurance statistics report. Facial fractures were classified into nasal bone fractures, orbital fractures, frontal sinus fractures, maxillary fractures, mandibular fractures, and nasoorbitoethmoid fractures. Orbital fractures were further divided into medial wall, inferior wall, and superior wall fractures.8-10 Maxillary and mandibular fractures were classified on the basis of the diagnosis codes for comparison.
Age groups were compared after standardization because the population distribution varied across age groups. Standardization was performed using the 2011–2016 annual health insurance statistics reports published by the NHIS according to the following equation:
number of patients in a given year/total population of the age group in given year × 100,000.
It meant the incidence in a given year per 100,000 populations.
Table 1. Diagnosis codes for facial fractures based on KCD 6, 7
Facial fracture Subtype Diagnosis code
Frontal sinus Closed S02120
Open S02121
Superior orbital rim Closed S02130
Open S02131
Nasal bone Closed S0220
Open S0221
Blowout, inferior wall Closed S0230
Open S0231
Zygoma and maxilla Lefort I S0242
Lefort II S0243
Combined midface S0244
Unilateral Lefort III S0245 Bilateral Lefort III S0246
Zygomatic arch S0247
Other S0248
Unspecified S0249
Mandible Condylar process S0262
Subcondylar process S0263
Coronoid process S0264
Ramus S0265
Angle S0266
Symphysis S0267
Other S0268
Unspecified S0269
NEO Closed S02720
Open S02721
Blowout, medial wall Closed S02840
Open S02841
NEO = nasoorbitoethmoidal fracture, KCD = Korean Standard Classification of Disease and Cause of Death.
Statistical analysis
All statistical analyses were performed using SAS software (SAS Institute INC, Cary, NC, USA) and SPSS (IBM Corporation, Armonk, NY, USA) software. To determine whether the incidences of fractures differ seasonally, analysis of variance was performed using monthly data. Finally, gender-specific differences in incidences of fractures were investigated using χ2 tests.
Ethics statement
The present study protocol was reviewed and approved by the Institutional Review Board of Yeungnam University College of Medicine (approval No. YUMC 2018-01-007).
RESULTS
Incidence of fractures by year
The incidence of facial fractures per 100,000 populations had decreased consistently, from 212 in 2011 to 171 in 2016 (Fig. 2).
Incidence of fractures by month and season
There were no significant differences in monthly incidence (Fig. 3). When observed seasonally, facial fractures were most frequent in spring and least frequent in the winter (P < 0.001) (Fig. 4).
Fractures by age group
By age group, the youth group accounted for 31.0% of all fractures, while the adult and elderly groups accounted for 59.7% and 9.2%, respectively. The number of patients was the highest in the adult group and lowest in the elderly group (Fig. 5). After standardization, the incidence was found to occur most frequently in youth, followed by the adult group. The The number of medical use about facial bone fracture
from Jan. 2010 to Aug. 2017 supplied by HIRA (n = 83,014,212)
The number of patients from Jan. 2010 to Aug. 2017 (n = 745,897)
The number of fractures from Jan. 2011 to Dec. 2016 (n = 641,522)
Exclude data using KCD 5 Exclude incomplete data in 2017 The number of patients
from Jan. 2011 to Dec. 2016 (n = 582,318)
Year Yearly distribution
Gender Men Women
Age Youth Adult Elderly
Month Categorized
by season
Fracture types Frontal bone
Orbit Nasal bone Zygoma and maxilla
Mandible NEO Fig. 1. Flow chart of screening the number of patients with diagnosed facial fractures.
HIRA = Health Insurance Review and Assessment, KCD = Korean Standard Classification of Disease and Cause of Death, NEO = nasoorbitoethmoidal fracture.
number of patients in the elderly population is the lowest, but it is increasing every year, and after standardization, there is a significant increase in annual incidence (Fig. 6).
The youth group was further divided into infant, child, and adolescent groups, and the number of patients was the highest among adolescents (Fig. 7). After standardization, facial
0
2016 Year
2011 150
50
Incidence per 100,000 population
250
100 200
2012 2013 2014 2015
212 203
190 181 176 171
Fig. 2. Number of patients by year.
0
Month
2011. 01 2011. 03
2011. 05 2011. 07
2011. 09 2011. 11
2012. 012012. 032012. 052012. 072012. 092012. 1 1
2013. 012013. 032013. 052013. 072013. 092013. 1 1
2014. 012014. 032014. 052014. 072014. 092014. 1 1
2015. 012015. 032015. 052015. 072015. 092015. 1 1
2016. 012016. 032016. 052016. 072016. 092016. 1 1
15,000
5,000
No. of patients
25,000 30,000
10,000 20,000
Fig. 3. Number of patients by month.
120,000
Spring Summer Autumn Winter 140,000
No. of fractures
160,000
130,000 150,000
153,754
145,598 149,158
133,808
Fig. 4. Number of the facial fractures by season.
0
Year 30,000
10,000
No. of patients
50,000 70,000
20,000 40,000 60,000
2016
2011 2012 2013 2014 2015
Youth (0–19) Adult (20–60) Elderly (61–)
Fig. 5. Number of the patients by age groups.
0
Year 150
100Incidence per ,000 population 50 300 400
100 200 350
250
2016
2011 2012 2013 2014 2015
Youth (0–19) Adult (20–60) Elderly (61–)
334.8
195.6 196.9 186.6 178.5 173.9 169.6
115.7 102.7
100.7 101.7
101.5 99.1
299.0
270.5 259.3 251.0
228.0
Fig. 6. Incidence per 100,000 population by age groups. Number of patients in a given year/total population of the age group in given year × 100,000.
0
Year
No. of patients
5,000 25,000
15,000 20,000
10,000
2016
2011 2012 2013 2014 2015
Infantile (0–2) Child (3–12) Adolescent (13–19)
Fig. 7. Number of patients among youth.
fractures most frequently occurred in the adolescent group, followed by the infantile group.
In the infantile group, the total number of patients was below 2,000 cases per year, which was lower than other age groups. All three groups showed a declining trend of facial fractures annually (Fig. 8).
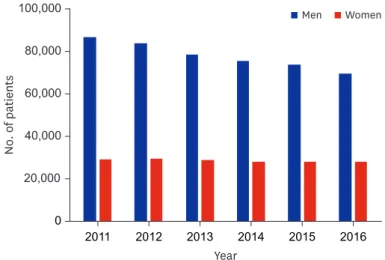
Fractures by gender
In a six-year study period, a total of 582,318 cases of patients were diagnosed, with 425,265 men patients and 157,053 women patients (Fig. 9). Both the number and percentage of fracture cases were higher among men than among women. The incidence of facial fractures declined in both gender over the six years. However, the percentage of fractures in woman patients rose (P < 0.001).
Fractures by facial area
Nasal bone fractures were the most common, followed by orbital and frontal sinus fractures.
The percentage of nasal bone fractures declined, whereas those of orbital wall fractures increased from 2011 to 2016 (P < 0.001) (Fig. 10). Among orbital wall fractures, inferior
0
Year
Incidence per 100,000 population
200 400
50 300
150 350
250
100
2016
2011 2012 2013 2014 2015
Infantile (0–2) Child (3–12) Adolescent (13–19)
86.2
52.4 48.6 44.7 41.3 38.6 35.7
82.1 78.7 70.4 60.6 57.3
355.2
309.0
275.5 272.9 271.4
241.6
Fig. 8. Incidence per 100,000 population among youth. Number of patients in a given year/total population of the age group in given year × 100,000.
0
Year 20,000
No. of patients
60,000 100,000
40,000 80,000
2016 2011 2012 2013 2014 2015
Men Women
Fig. 9. Comparison of gender-related differences in the number of patients by year.
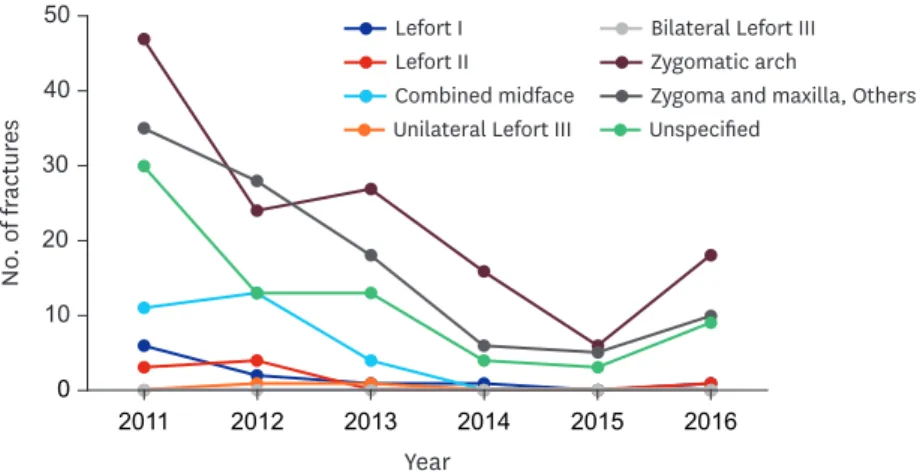
wall fractures were the most common, followed by medial wall fractures (Fig. 11). Among mandibular fractures, angle fractures were the most common, followed by condylar process and symphysis fractures (Fig. 12). The incidence of zygomatic and maxilla fractures had decreased since 2011 (Fig. 13).
0
2016 Year
2011 80,000
40,000
No. of fractures
120,000
60,000 100,000
2012 2013 2014 2015
Nasal bone Orbit Frontal bone NEO Mandible Zygoma and maxilla
Frontal bone NEO Mandible Zygoma and maxilla
0
2016 Year
2011 1,200
. of frNoactures 400 1,800
800 1,600
2012 2013 2014 2015 1,400
1,000
200 600 20,000
Fig. 10. Comparison of facial fractures prevalence among facial areas by year.
NEO = nasoorbitoethmoidal fracture.
0
2016 Year
2011 15,000
5,000
No. of fractures
25,000
10,000 20,000
2012 2013 2014 2015
Inferior Medial Superior
Fig. 11. Number of orbital fractures by subtypes.
0
2016 Year
2011 60
. of frNoactures 20 100
40 80
2012 2013 2014 2015 Condylar process
Subcondylar process Coronoid process Ramus
Angle Symphysis Other Unspecified
Fig. 12. Number of mandibular fractures by subtypes.
DISCUSSION
The authors analyzed the data of 582,318 patients among 83,014,212 medical uses related to facial fractures and found the following results.
The number of facial fractures consistently declined over the years, from 107,695 cases in 2011 to 87,306 cases in 2016. There was no clear monthly trend; however, the number of fractures tended to increase from January to June, and the number was the highest in the spring season. By gender, both men and women showed decreasing trend, but the proportion of women was relatively increased. The number of facial fractures was higher in order of adult, youth and elderly, but after standardization, the most frequent was youth group. The elderly population had the lowest incidence of fractures but increased annually. Nasal bone fractures were the most common, accounting for 70.9% of all fractures, followed by orbital wall fractures, 28.3%.
While the population of Korea is growing gradually, the incidence of facial fractures is decreasing. With standardization, the age group with the highest incidence of facial fractures was the youth group, presumably because this age group is more active and is more careless than other age groups. It was interesting that the incidence in the elderly group is increasing annually. This represents the fact that with the aging society, the elderly people's social and outdoor activities increase, and therefore there are higher risks of their facial fractures as well as the overall number of fractures. Thus, we should prepare for preventing facial fractures in elderly individuals for economizing national health costs. The growing percentage of women facial fractures may be related to the rising level of social activity on the part of women.
By season, incidence of fracture was the highest in the spring, which is a season in which outdoor activity increases.
Another value of this study is analysis of detailed facial fractures. We found that the
percentage of nasal bone fracture is diminishing, while that of orbital wall fractures is rising.
Among the orbital wall fractures, inferior wall fracture was the most common, followed by medial wall fracture, while the number of fractures increased in medial wall and decreased in inferior wall.11-15 In mandibular fractures, angle fracture was the most common in this study, and fracture in other regions did not show any significant difference. This result differed
0
2016 Year
2011 30
10
No. of fractures
50
20 40
2012 2013 2014 2015 Lefort I
Lefort II
Combined midface Unilateral Lefort III
Bilateral Lefort III Zygomatic arch
Zygoma and maxilla, Others Unspecified
Fig. 13. Number of zygomatic and maxilla fractures by subtypes.
from the previous reports in which condyle fractures were the most common.16 In zygomatic and maxilla fractures, we could not find any dominant subtype fracture.
The main reason for this detailed analysis about subtype of facial fractures is the
popularization of CT. The increase in CT imaging and the expansion of insurance benefits contribute to the accuracy of the diagnosis. In terms of diagnostic codes, the KCD was also changed from 5 to 6 with reference to changing from The International Statistical Classification of Diseases and Related Health Problems 9 to 10. Although KCD 6 and 7 make it possible to classify facial fractures in more detail, past KCD 5 was inadequate.
The results obtained from big data depend on the method used. In this paper, we only included the earliest health service utilization for each individual to calculate the number of fractures in the corresponding year in order to prevent duplicate counting of fractures for the same individual in cases in which one person underwent several treatments for the same diagnosis. Therefore, we only counted the first fracture even when one patient had several fractures in a single year. The accuracy of this method is lower than that of a retrospective survey in a single institution. However, this method produces statistically significant results with a considerably greater number of cases.
We were able to observe national trends in facial fractures because Korea implements a single health insurance system. Although KCD 6 and 7 do not have a complete classification for facial fractures, these codes make it possible to identify the area of fracture and number of open or closed fractures for each diagnosis in detail.
This is the first study to examine the frequency and trends of facial fractures in the Korean population using Big Data. Korea has adopted a single, uncommon health insurance system, so the authors were able to analyze Big Data's data. We used this data to analyze the frequency of facial fractures, annual, monthly, seasonal variation, age, gender, and detailed fracture analysis, as well as national trends.
Nevertheless, there are several limitations in this study. A major limitation of this study is that the raw data itself may be flawed when health professionals omit some diagnosis codes during entry. For example, when other fractures were present in addition to a nasal bone fracture, health professionals only entered the diagnosis code for nasal fracture. This results in a partial omission. Furthermore, in cases of facial laceration and related facial fracture, entering only the facial laceration code without entering the fracture code would result in a complete omission of the fracture code.
Another limitation of this study is that the data from automobile accidents is missing.
Because car accident data has the patient's medical records for each insurer, it is impossible to investigate individual medical records of each insurer under the Personal Information Protection Act of the Republic of Korea.
The other limitation is that KCD 6 and 7 include incomplete diagnosis codes that have not been completely categorized. For example, under zygomatic and maxilla fractures, zygomatic arch has its own code for fractures, but there is no code for zygomatic body fractures.
In the case of a body fracture, depending on the medical institution, the accuracy of the diagnosis is reduced by omitting it or borrowing another code. Also, there is no distinction between simple fractures and comminuted fractures in all fracture categories. In the case
of comminuted fractures, there is a big difference in that the treatment is difficult and the prognosis is poor.
The authors used Big Data to examine the frequency of facial fractures in the Korean population and to analyze the facial fractures by detailed classification. It is important that this study is the first to investigate the frequency and trend of facial fractures in Koreans using Big Data.
ACKNOWLEDGMENTS
The authors thank Joon Sakong MD, PhD and Min-Ah Nah MD, Department of Preventive Medicine and Public Health, Yeungnam University College of Medicine, Korea, for their technical assistance for this study.
REFERENCES
1. Kim JA, Yoon S, Kim LY, Kim DS. Towards actualizing the value potential of Korea Health Insurance Review and Assessment (HIRA) data as a resource for health research: Strengths, limitations, applications, and strategies for optimal use of HIRA data. J Korean Med Sci 2017;32(5):718-28.
PUBMED | CROSSREF
2. Lazer D, Kennedy R, King G, Vespignani A. Big data. The parable of Google Flu: traps in big data analysis.
Science 2014;343(6176):1203-5.
PUBMED | CROSSREF
3. Yoo JH. Has the incidence of acute pyelonephritis increased in Korea? – Big Data as a double-edged sword. J Korean Med Sci 2018;33(49):e317.
PUBMED | CROSSREF
4. Kim JW, Lee JH, Kim TG, Kim YH, Chung KJ. Breast reconstruction statistics in Korea from the big data hub of the Health Insurance Review and Assessment service. Arch Plast Surg 2018;45(5):441-8.
PUBMED | CROSSREF
5. Levine E, Degutis L, Pruzinsky T, Shin J, Persing JA. Quality of life and facial trauma: psychological and body image effects. Ann Plast Surg 2005;54(5):502-10.
PUBMED | CROSSREF
6. Kim KS, Lee HG, Shin JH, Hwang JH, Lee SY. Trend analysis of nasal bone fracture. Arch Craniofac Surg 2018;19(4):270-4.
PUBMED | CROSSREF
7. Kim BJ, Lee SI, Chung CM. A retrospective analysis of 303 cases of facial bone fracture: Socioeconomic status and injury characteristics. Arch Craniofac Surg 2015;16(3):136-42.
PUBMED | CROSSREF
8. Lee JH, Mun GH, Bang SI. A clinical & statistical analysis of the facial bone fractures: 7 years survey.
J Korean Soc Plast Reconstr Surg 1998;25(6):1046-52.
9. Park MS, Kim YJ, Kim H, Nam SH, Choi YW. Prevalence of diplopia and extraocular movement limitation according to the location of isolated pure blowout fractures. Arch Plast Surg 2012;39(3):204-8.
PUBMED | CROSSREF
10. Song SH, Kwon H, Oh SH, Kim SJ, Park J, Kim SI. Open reduction of zygoma fractures with the extended transconjunctival approach and T-bar screw reduction. Arch Plast Surg 2018;45(4):325-32.
PUBMED | CROSSREF
11. Lee HB, Lee SH. New anthropometric data for preoperative planning in orbital wall fracture treatment:
the use of eyelid drooping. Arch Craniofac Surg 2018;19(4):248-53.
PUBMED | CROSSREF
12. Erdmann D, Follmar KE, Debruijn M, Bruno AD, Jung SH, Edelman D, et al. A retrospective analysis of facial fracture etiologies. Ann Plast Surg 2008;60(4):398-403.
PUBMED | CROSSREF
13. Kim YH, Park Y, Chung KJ. Considerations for the management of medial orbital wall blowout fracture.
Arch Plast Surg 2016;43(3):229-36.
PUBMED | CROSSREF
14. Choi SH, Kang DH, Gu JH. The correlation between the orbital volume ratio and enophthalmos in unoperated blowout fractures. Arch Plast Surg 2016;43(6):518-22.
PUBMED | CROSSREF
15. Hur SW, Kim SE, Chung KJ, Lee JH, Kim TG, Kim YH. Combined orbital fractures: surgical strategy of sequential repair. Arch Plast Surg 2015;42(4):424-30.
PUBMED | CROSSREF
16. Olson RA, Fonseca RJ, Zeitler DL, Osbon DB. Fractures of the mandible: a review of 580 cases. J Oral Maxillofac Surg 1982;40(1):23-8.
PUBMED | CROSSREF