D I A B E T E S & M E T A B O L I S M J O U R N A L
This is an Open Access article distributed under the terms of the Creative Commons Attribution Non-Commercial License (http://creativecommons.org/licenses/by-nc/4.0/) which permits unrestricted non-commercial use, distribution, and reproduction in any medium, provided the original work is properly cited.
Adipokines and Insulin Resistance According to
Characteristics of Pregnant Women with Gestational Diabetes Mellitus
Eon Ju Jeon1, Seong Yeon Hong2, Ji Hyun Lee1
Departments of 1Internal Medicine, 2Obstetrics and Gynecology, Catholic University of Daegu School of Medicine, Daegu, Korea
Background: The aim of this study was to evaluate adipokines concentration and insulin resistance according to maternal age or obesity at pregnancy and weight change at diagnosed gestational diabetes mellitus (GDM) in pregnant women with GDM.
Methods: This study included 57 pregnant women who were diagnosed with GDM at 24 to 28 weeks of gestation. The subjects were classified into two or three groups according to pre-pregnancy body mass index (BMI, <25 kg/m2 vs. ≥25 kg/m2), maternal age at pregnancy (<35 years old vs. ≥35 years old), and weight change during pregnancy at screening for GDM (weight change below, within, and in excess of the recommended range). They were respectively compared in each group.
Results: Leptin, homeostasis model assessment of insulin resistance (HOMA-IR), and HOMA2-%B were increased in the group with pre-pregnancy BMI ≥25 kg/m2. Leptin and HOMA-IR were positively correlated with BMI both before pregnancy and at screening for GDM. There were no significant correlations between HOMA-IR and adipokines. HOMA-IR showed positive cor- relation with HOMA2-%B and negative correlation with HOMA2-%S.
Conclusion: Leptin and HOMA-IR at diagnosed GDM were increased in the GDM patients with obesity before pregnancy. They were positively correlated with BMI both before pregnancy and at screening for GDM. The effect of maternal age at pregnancy and weight change during pregnancy at GDM screening on adipokines and insulin resistance might be less pronounced than the effect of maternal obesity.
Keywords: Adipokines; Diabetes, gestational; Insulin resistance
Corresponding author: Ji Hyun Lee https://orcid.org/0000-0002-5671-0875 Department of Internal Medicine, Catholic University of Daegu School of Medicine, 33 Duryugongwon-ro 17-gil, Nam-gu, Daegu 42472, Korea
E-mail: [email protected]
INTRODUCTION
Gestational diabetes mellitus (GDM) is characterized by im- paired glucose tolerance (IGT) with first recognition of onset during pregnancy and is one of the most common complica- tions that can lead to risks for the mother and fetus [1]. The complications related to GDM are macrosomia, shoulder dys- tocia, still birth, hypertension, and obstetric complications [2,3]. Abnormal maternal glucose regulation occurs in 3% to 10% of pregnancies, and GDM accounts for 90% of cases of di- abetes mellitus (DM) in pregnancy [4]. According to the Kore- an Health Insurance Database, the prevalence of GDM in-
creased from 5.7% in 2009 to 9.5% in 2011 [5].
The pathogenesis of GDM has not been fully elucidated. The hallmark of GDM is increased insulin resistance. Insulin resis- tance is a physiologic metabolic change that is regulated during pregnancy to maintain glucose levels for the metabolic de- mands of the rapidly developing fetus. It is related to anti-insu- lin hormones secreted by the placenta, including human pla- cental lactogen, prolactin, glucocorticoid, and progesterone [6]. It is well known that the risk of GDM increases among women who are overweight or obese compared with lean or normal-weight women. Therefore, mechanisms linking obesity to insulin resistance, such as type 2 diabetes mellitus (T2DM), https://doi.org/10.4093/dmj.2017.41.6.457
pISSN 2233-6079 · eISSN 2233-6087
are likely to play a role in the development of GDM. In recent years, most studies about this have focused on leptin, resistin, and adiponectin as potential mediators of insulin resistance [7- 14]. These have been suggested to be implicated in the regula- tion of placental growth, development, and function and in fe- tal growth.
However, a few studies have reported on the role of adipo- kines and insulin resistance in GDM in the Korean population [15,16]. Kim [17] reported the similarities and differences from other racial/ethnic groups of GDM in Korean women.
GDM is increasing worldwide due in large part to the obesity epidemic. Although the frequency of GDM is relatively low among Korean women, the number of pregnant women with GDM is increasing and GDM remains a concern with ad- vanced maternal age and obesity at pregnancy and excessive weight gain during pregnancy. We evaluated adipokines con- centration and insulin resistance according to maternal age or obesity at pregnancy and weight change at diagnosed GDM in the pregnant women with GDM.
METHODS
Participants
In this cross-sectional study, 57 pregnant women with GDM were included between November 2007 and December 2010 at Daegu Catholic University Medical Center. A 50-g 1-hour glu- cose challenge test was performed at 24 to 28 weeks of gesta- tion. Those patients who had abnormal response (postload plasma glucose ≥140 mg/dL) accordingly underwent a 100-g, 3-hour oral glucose tolerance test (OGTT). Women were diag- nosed with GDM if at least two of four diagnostic criteria were met (fasting plasma glucose ≥95 mg/dL, 1-hour plasma glu- cose ≥180 mg/dL, 2-hour plasma glucose ≥155 mg/dL, or 3-hour plasma glucose ≥140 mg/dL) (Carpenter and Coustan criteria) [18]. Maternal data on age, pre-pregnancy weight and height, and family history of diabetes were acquired from the medical records. Maternal body mass index (BMI) was calcu- lated as weight divided by the square of height (kg/m2). The subjects were classified into three groups according to (1) pre- pregnancy BMI (<25 kg/m2 vs. ≥25 kg/m2), (2) maternal age at pregnancy (<35 years old vs. ≥35 years old), and (3) weight change during pregnancy at screening for GDM (weight gain below, within, and in excess of the recommended range). The results were respectively compared in each group. The ideal weight range for pregnancy is based on maternal height and
weight before pregnancy. The calculation is based on the guide- lines for pregnancy weight gain issued by the Institute of Medi- cine (IOM) in May 2009 [19], which suggest that recommen- dations to patients be based on pre-pregnancy BMI. For BMI levels <18.5, 18.5 to 24.9, 25 to 29.9, and >30 kg/m2, weight gain ranges are suggested at 28 to 40, 25 to 35, 15 to 25, and 11 to 20 pounds, respectively, and the recommended rates of weight gain are 1 to 1.3, 0.8 to 1, 0.5 to 0.7, and 0.4 to 0.6 pounds/week.
The study protocol was approved by the Institutional Review Board of Daegu Catholic University Medical Center (IRB num- ber CR-16-071). Informed consent was exempted by the board due to the retrospective nature of the study.
Biochemical measurements
All laboratory measurements were performed in the morning following an overnight fast (10 to 12 hours) at the time of the 100-g OGTT between 24 and 28 weeks. Glycosylated hemoglo- bin (HbA1c) levels were measured by high-performance liquid chromatography (Bio-Rad Laboratories, Hercules, CA, USA).
Total serum cholesterol, triglyceride, low density lipoprotein cholesterol, and high density lipoprotein cholesterol levels were measured by enzymatic methods using a Hitachi Modular An- alytics (Roche, Tokyo, Japan). Serum insulin and c-peptide were measured by electrochemiluminescence immunoassay using Roche Modular (Roche, Basel, Switzerland). For the mea- surement of adiponectin, a commercially available sandwich immunoassay kit (Human Adiponectin ELISA Kit; Millipore, St. Charles, MO, USA) was used, with intra-assay variability of 7.3% and inter-assay variability of 4.2%. The sensitivity of it was less than 0.5 ng/mL. Leptin was measured by a sandwich im- munoassay kit (Human Leptin ELISA Kit; Millipore). The in- tra-assay coefficient of variation was 4.7% and inter-assay coef- ficient of variation was 7%. Resistin was quantified using a sandwich enzyme immunoassay kit (Human Resistin Immu- noassay; R&D Systems, Minneapolis, MN, USA). The homeo- stasis model assessment of insulin resistance (HOMA-IR) index was calculated according to the formula: HOMA-IR=fasting glucose (mmol/L)×fasting insulin (mU/mL)/22.519 [20]. β- Cell function and insulin sensitivity were assessed by HOMA2-
%B and HOMA2-%S which were calculated using HOMA2 Computer Model (www.dtu.ox.ac.uk/homa).
Statistical analysis
The summary for basic characteristics was performed using descriptive analysis. The data were represented by mean±
standard deviation (SD) for normally distributed values and medians (range) for nonparametric values. The qualitative variables were reported as frequency and percent. Compari- sons of clinical parameters according to maternal factor were performed using two sample t-tests with normality or Mann- Whitney U test for nonparametric values. The categorical vari- ables were compared by chi-square test. Differences among groups according to weight change during pregnancy at screening were analyzed by analysis of variance or the Kruskal- Wallis test for nonparametric values. Pearson’s correlation co- efficient test was applied to assess the correlation between adi- pokines and clinical parameters, and for non-parametric val- ues, Spearman’s correlation was performed. Multivariate analy- sis was performed using multiple linear regression analysis. All statistical analyses were performed using SPSS version 18.0 for Windows (SPSS Inc., Chicago, IL, USA). P<0.05 was consid- ered statistically significant.
RESULTS
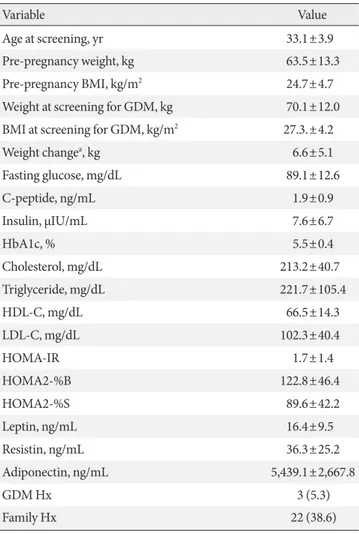
The clinical characteristics of the patients with GDM are sum- marized in Table 1. A total of 57 patents were evaluated in this study. Their mean age was 33.1±3.9 years. Mean pre-pregnan- cy weight and BMI were 63.5±13.3 kg and 24.7±4.7 kg/m2, re- spectively. Thirty-one patients (approximately 54%) were over- weight or obese before pregnancy. Three patients (5.3%) had a history of prior GDM and 22 patients (38.6%) had a family history of DM.
Comparisons of clinical parameters according to pre-preg- nancy BMI, maternal age at pregnancy, and weight change during pregnancy at GDM screening are shown in Tables 2-4.
The clinical parameters such as C-peptide, insulin, HbA1c, triglyceride, and leptin were significantly increased in GDM patients with pre-pregnancy BMI ≥25 kg/m2 compared to those with pre-pregnancy BMI <25 kg/m2 (Table 2). HOMA-IR (1.3±1.5 vs. 2.1±1.8, P=0.046) and HOMA2-%B (109.5±39.7 vs. 138.7±49.6, P=0.017) were significantly increased in the group with pre-pregnancy BMI ≥25 kg/m2, while HOMA2-
%S (109.8±43.4 vs. 64.3±24.9, P<0.001) was decreased. There were no significant differences in resistin and adiponectin be- tween these two groups.
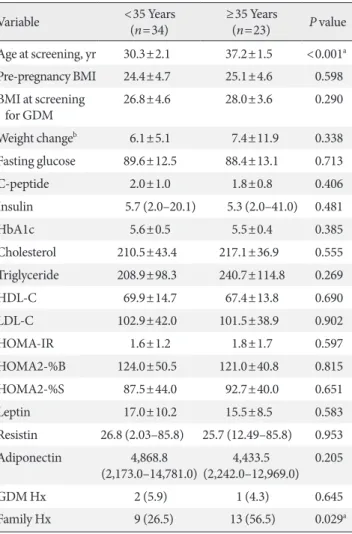
In comparisons according to maternal age at pregnancy, HOMA-IR and BMI were higher and adiponectin was lower in the GDM patients with age ≥35 years at pregnancy (Table 3).
However, there were no statistically significant differences. In
the group aged ≥35 years at pregnancy, a family history of DM was more frequent (56.5% vs. 26.5%, P=0.029).
When classified by weight change during pregnancy at screening, a higher BMI at screening was observed in the group with a weight change in excess of the recommended weight range (25.0±5.1, 27.8±3.3, and 29.9±2.3, P=0.025) (Table 4).
Pre-pregnancy BMI was similar among the groups. Although there were no statistically significant differences, leptin was higher in GDM patients who gained above the recommended weight range. Adipokines demonstrated no significant differ- ences among the groups.
Table 1. Basic characteristics of the subjects (n=57)
Variable Value
Age at screening, yr 33.1±3.9
Pre-pregnancy weight, kg 63.5±13.3
Pre-pregnancy BMI, kg/m2 24.7±4.7
Weight at screening for GDM, kg 70.1±12.0 BMI at screening for GDM, kg/m2 27.3.±4.2
Weight changea, kg 6.6±5.1
Fasting glucose, mg/dL 89.1±12.6
C-peptide, ng/mL 1.9±0.9
Insulin, µIU/mL 7.6±6.7
HbA1c, % 5.5±0.4
Cholesterol, mg/dL 213.2±40.7
Triglyceride, mg/dL 221.7±105.4
HDL-C, mg/dL 66.5±14.3
LDL-C, mg/dL 102.3±40.4
HOMA-IR 1.7±1.4
HOMA2-%B 122.8±46.4
HOMA2-%S 89.6±42.2
Leptin, ng/mL 16.4±9.5
Resistin, ng/mL 36.3±25.2
Adiponectin, ng/mL 5,439.1±2,667.8
GDM Hx 3 (5.3)
Family Hx 22 (38.6)
Values are presented as mean±standard deviation or number (%).
BMI, body mass index; HbA1c, glycosylated hemoglobin; HDL-C, high density lipoprotein cholesterol; LDL-C, low density lipoprotein cholesterol; HOMA-IR, homeostasis model assessment of insulin re- sistance; HOMA2-%B, homeostasis model assessment of insulin re- sistance 2-%B; HOMA2-%S, homeostasis model assessment of insu- lin resistance 2-%S; GDM, gestational diabetes mellitus; Hx, history.
aDuring pregnancy at screening for GDM.
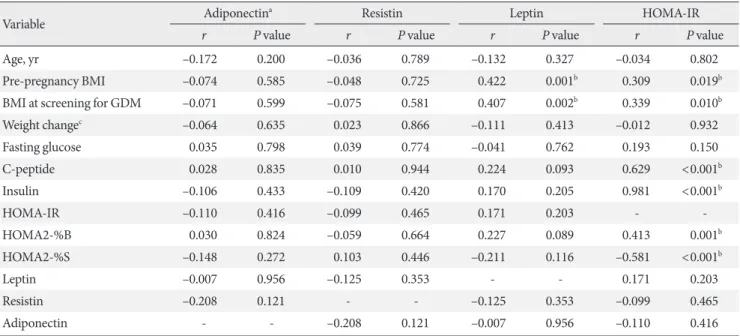
The correlations among metabolic parameters are shown in Table 5. Leptin and HOMA-IR were positively correlated with BMI at pregnancy as well as at screening for GDM. HOMA-IR was positively correlated with HOMA2-%B (r=0.413, P=0.001) and negatively correlated with HOMA2-%S (r=–0.581, P<
0.001). There were no correlations between insulin resistance and adipokines such as adiponectin, leptin, and resistin.
Multiple linear regression analyses were performed to assess relationships between maternal variables and each of the fol-
lowing variables for which correlation was significant: model I, leptin; model II, HOMA-IR (Table 6). HOMA2-%B was a neg- ative influence of HOMA-IR (β coefficient=–0.007, P<0.001) after adjustment for the other variables.
DISCUSSION
In this study, we examined the features of adipokines and insu- lin resistance according to the known risk factors of GDM Table 2. Comparisons of clinical parameters according to pre-
pregnancy BMI
Variable <25 kg/m2
(n=31) ≥25 kg/m2
(n=26) P value Age at screening, yr 33.0±3.7 33.2±4.2 0.884 Pre-pregnancy BMI 21.2±2.1 28.9±3.1 <0.001a BMI at screening
for GDM 24.3±2.9 30.9±2.4 <0.001a
Weight changeb 7.6±4.8 5.4±5.3 0.098
Fasting glucose 86.6±10.8 92.1±14.2 0.100
C-peptide 1.5±0.7 2.4±0.9 <0.001a
Insulin 3.9 (2.0–41.0) 7.8 (2.8–22.1) 0.012a
HbA1c 5.4±0.4 5.7±0.4 0.007a
Cholesterol 210.8±37.7 216.0±44.5 0.640
Triglyceride 185.0±87.5 265.5±109.7 0.003a
HDL-C 69.8±15.4 62.6±11.9 0.055
LDL-C 104.0±33.3 100.3±48.1 0.732
HOMA-IR 1.3±1.5 2.1±1.8 0.046a
HOMA2-%B 109.5±39.7 138.7±49.6 0.017a
HOMA2-%S 109.8±43.4 64.5±24.9 <0.001a
Leptin 13.9±7.0 19.3±11.3 0.039a
Resistin 37.8±28.7 34.5±20.6 0.615
Adiponectin 4,833.0
(2,181.0–11,726.5) 4,412.5
(2,173.0–14,781.0) 0.943
GDM Hx 2 (6.5) 1 (3.8) 0.661
Family Hx 11 (35.5) 11 (42.3) 0.598
Values are presented as mean±standard deviation, median (range), or number (%).
BMI, body mass index; GDM, gestational diabetes mellitus; HbA1c, glycosylated hemoglobin; HDL-C, high density lipoprotein cholester- ol; LDL-C, low density lipoprotein cholesterol; HOMA-IR, homeosta- sis model assessment of insulin resistance; HOMA2-%B, homeostasis model assessment of insulin resistance 2-%B; HOMA2-%S, homeo- stasis model assessment of insulin resistance 2-%S; Hx, history.
aP<0.05, bDuring pregnancy at screening for GDM.
Table 3. Comparisons of clinical parameters according to ma- ternal age at pregnancy
Variable <35 Years
(n=34) ≥35 Years
(n=23) P value Age at screening, yr 30.3±2.1 37.2±1.5 <0.001a Pre-pregnancy BMI 24.4±4.7 25.1±4.6 0.598 BMI at screening
for GDM 26.8±4.6 28.0±3.6 0.290
Weight changeb 6.1±5.1 7.4±11.9 0.338
Fasting glucose 89.6±12.5 88.4±13.1 0.713
C-peptide 2.0±1.0 1.8±0.8 0.406
Insulin 5.7 (2.0–20.1) 5.3 (2.0–41.0) 0.481
HbA1c 5.6±0.5 5.5±0.4 0.385
Cholesterol 210.5±43.4 217.1±36.9 0.555
Triglyceride 208.9±98.3 240.7±114.8 0.269
HDL-C 69.9±14.7 67.4±13.8 0.690
LDL-C 102.9±42.0 101.5±38.9 0.902
HOMA-IR 1.6±1.2 1.8±1.7 0.597
HOMA2-%B 124.0±50.5 121.0±40.8 0.815
HOMA2-%S 87.5±44.0 92.7±40.0 0.651
Leptin 17.0±10.2 15.5±8.5 0.583
Resistin 26.8 (2.03–85.8) 25.7 (12.49–85.8) 0.953 Adiponectin 4,868.8
(2,173.0–14,781.0) 4,433.5
(2,242.0–12,969.0) 0.205
GDM Hx 2 (5.9) 1 (4.3) 0.645
Family Hx 9 (26.5) 13 (56.5) 0.029a
Values are presented as mean±standard deviation, median (range), or number (%).
BMI, body mass index; GDM, gestational diabetes mellitus; HbA1c, glycosylated hemoglobin; HDL-C, high density lipoprotein cholester- ol; LDL-C, low density lipoprotein cholesterol; HOMA-IR, homeosta- sis model assessment of insulin resistance; HOMA2-%B, homeostasis model assessment of insulin resistance 2-%B; HOMA2-%S, homeo- stasis model assessment of insulin resistance 2-%S; Hx, history.
aP<0.05, bDuring pregnancy at screening for GDM.
such as pre-pregnancy BMI, maternal age at pregnancy, and weight change during pregnancy at GDM screening in preg- nant women with GDM. Leptin, HOMA-IR, and HOMA2-%B at diagnosed GDM were increased in the GDM with obesity (BMI ≥25 kg/m2) before pregnancy. They were positively cor- related with BMI both before pregnancy and at screening for GDM. The correlations between adipokines and insulin resis- tance were not statistically significant. The effect of maternal age at pregnancy and weight change during pregnancy at GDM screening on adipokines and insulin resistance might be less pronounced than the effect of maternal obesity.
Metabolic changes occur during pregnancy. In early gesta- tion, maternal fat is stored and insulin secretion increases, while insulin sensitivity remains unchanged or decreases and insulin resistance and facilitated lipolysis follow in late preg nancy [21]. Pregnancy has been characterized as a diabetogen-
ic state because of the progressive increases in postprandial glucose and the insulin response in the late gestation that de- creases up to 50% in insulin-mediate glucose disposal, as well as increases of 200% to 250% in insulin secretion to maintain euglycemia in the mother [21-23]. These changes become worse in pregnant women who develop GDM.
Recently, many studies have investigated adkipokines such as adiponectin and leptin, which are secreted only by fat cells, as well as other adipocytokines like resistin and interleukin 6, which can be secreted also by stromal cells in adipose tissue.
These are all related to regulation of insulin resistance. In addi- tion, adiponectin, leptin, and resistin are all known to be pro- duced within the intrauterine environment such as the placen- ta [24-26]. Adiponectin is a protein hormone that modulates a number of metabolic processes, including glucose regulation and fatty acid oxidation [27]. Circulating adiponectin levels are Table 4. Comparisons of clinical parameters according to the weight change during pregnancy at screening for GDM
Variable <Δa kg (n=28) Δa kg (n=20) >Δa kg (n=9) P value
Age at screening, yr 32.4±3.7 34.2±3.9 32.8±4.5 0.270
Pre-pregnancy BMI 25.0±5.1 24.3±3.3 24.8±2.9 0.948b
BMI at screening for GDM 25.0±5.1 27.8±2.4 29.9±2.3 0.025b,c
Weight changed 7.6±4.8 5.4±5.3 6.1±5.1 <0.001c
Fasting glucose 90.2±12.6 88.5±12.7 87.1±13.7 0.796
C-peptide 1.8±0.8 2.1±1.1 1.8±0.8 0.743
Insulin 6.4±4.6 9.9±9.2 6.1±4.2 0.164
HbA1c 5.8±0.4 5.5±0.4 5.5±0.6 0.895
Cholesterol 206.6±42.4 219.2±37.2 220.3±43.7 0.714
Triglyceride 212.1±92.0 248.6±118.4 192.0±113.1 0.332
HDL-C 66.7±13.0 67.3±18.1 64.2±8.0 0.879b
LDL-C 97.5±39.3 102.2±38.1 117.7±49.0 0.841
HOMA-IR 1.4±1.1 2.2±1.8 1.3±0.9 0.160
HOMA2-%B 115.6±44.0 131.4±52.0 125.8±46.4 0.506
HOMA2-%S 93.7±43.7 81.3±35.4 95.1±52.4 0.559
Leptin 16.1±9.4 16.5±9.7 17.0±10.4 0.973
Resistin 37.9±27.1 32.9±22.5 38.9±26.5 0.755
Adiponectin 5,693.2±2,436.4 5,006.3±2,837.4 5,610.6±3,152.6 0.672
GDM Hx 2 (7.1) 1 (5.0) 0 0.716
Family Hx 8 (28.6) 9 (45.0) 5 (55.6) 0.290
Values are presented as mean±standard deviation or number (%).
GDM, gestational diabetes mellitus; BMI, body mass index; HbA1c, glycosylated hemoglobin; HDL-C, high density lipoprotein cholesterol;
LDL-C, low density lipoprotein cholesterol; HOMA-IR, homeostasis model assessment of insulin resistance; HOMA2-%B, homeostasis model assessment of insulin resistance 2-%B; HOMA2-%S, homeostasis model assessment of insulin resistance 2-%S; Hx, history.
aRecommended range, bKruskal-Wallis test, cP<0.05, dDuring pregnancy at screening for GDM.
reduced in patients with GDM as compared to pregnant con- trols [28]. It leads to aggravate insulin resistance as adiponectin has insulin-sensitizing effects. Leptin is a hormone that helps to regulate energy balance by inhibiting hunger. In obesity, a
decreased sensitivity to leptin occurs and results in leptin resis- tance. Pregnancy is considered a leptin resistant state. Leptin levels reach two- or three-fold higher concentrations com- pared to the non-pregnant conditions with a peak occurring around 28 weeks of gestation and a decrease to pregravid con- centrations observed immediately after delivery [29]. Leptin levels are known to be related to adipose tissue mass and cor- related with body fat mass and BMI in both non-pregnant and pregnant women [30,31]. Leptin is closely correlated with hu- man choriogonadotrophin throughout pregnancy [32]. Al- though the results have been controversial, most studies have shown increased leptin in GDM [6,7,9,13]. Resistin is an adi- pose-derived hormone similar to a cytokine whose physiologic role has been the subject of much controversy regarding its in- volvement with obesity and T2DM [33]. Data on circulating resistin in patients with GDM have been inconsistent. Resistin levels in pregnant women are elevated, decreased, or unchanged in the reports [28].
The changes of adipokines and insulin resistance during pregnancy depend on the first, second, or third trimester and result from profound changes in a woman’s hormonal status and metabolism [21]. The ability to adjust the nutritional status during this period is very important for the growing fetus in pregnant women. GDM develops when the pancreatic β-cell Table 5. Correlation between adipokines and clinical parameters
Variable Adiponectina Resistin Leptin HOMA-IR
r P value r P value r P value r P value
Age, yr –0.172 0.200 –0.036 0.789 –0.132 0.327 –0.034 0.802
Pre-pregnancy BMI –0.074 0.585 –0.048 0.725 0.422 0.001b 0.309 0.019b
BMI at screening for GDM –0.071 0.599 –0.075 0.581 0.407 0.002b 0.339 0.010b
Weight changec –0.064 0.635 0.023 0.866 –0.111 0.413 –0.012 0.932
Fasting glucose 0.035 0.798 0.039 0.774 –0.041 0.762 0.193 0.150
C-peptide 0.028 0.835 0.010 0.944 0.224 0.093 0.629 <0.001b
Insulin –0.106 0.433 –0.109 0.420 0.170 0.205 0.981 <0.001b
HOMA-IR –0.110 0.416 –0.099 0.465 0.171 0.203 - -
HOMA2-%B 0.030 0.824 –0.059 0.664 0.227 0.089 0.413 0.001b
HOMA2-%S –0.148 0.272 0.103 0.446 –0.211 0.116 –0.581 <0.001b
Leptin –0.007 0.956 –0.125 0.353 - - 0.171 0.203
Resistin –0.208 0.121 - - –0.125 0.353 –0.099 0.465
Adiponectin - - –0.208 0.121 –0.007 0.956 –0.110 0.416
HOMA-IR, homeostasis model assessment of insulin resistance; BMI, body mass index; GDM, gestational diabetes mellitus; HOMA2-%B, ho- meostasis model assessment of insulin resistance 2-%B; HOMA2-%S, homeostasis model assessment of insulin resistance 2-%S.
aSpearman’s correlation, bP<0.05, cDuring pregnancy at screening for GDM.
Table 6. Multiple linear regression analysis
Variable β Coefficient Standard error t P value Model I (Leptin)
Pre-pregnancy BMI 0.599 0.589 1.017 0.314 BMI at screening for
GDM 0.320 0.650 0.492 0.624
Model II (HOMA-IR)
Pre-pregnancy BMI –0.006 0.008 –0.683 0.498 BMI at screening for
GDM 0.013 0.009 1.534 0.131
C-peptide 0.386 0.039 9.886 <0.001a Insulin 0.199 0.003 67.334 <0.001a HOMA2-%B –0.007 0.001 –13.032 <0.001a
HOMA2-%S 0.000 0.000 0.715 0.478
BMI, body mass index; GDM, gestational diabetes mellitus; HOMA- IR, homeostasis model assessment of insulin resistance; HOMA2-%B, homeostasis model assessment of insulin resistance 2-%B; HOMA2-
%S, homeostasis model assessment of insulin resistance 2-%S.
aP<0.05.
reserve is insufficient to compensate for decreased insulin sen- sitivity during pregnancy [28,34]. There are some studies of the comparisons of adipokines and insulin resistance between GDM and pregnancy with normal glucose tolerance or IGT in Korea [15,35,36]. However, studies of adipokines and insulin resistance according to maternal factors among GDM patients are few. Oh et al. [15] reported that adiponectin levels were de- creased and leptin levels were increased in pregnant women with normal glucose tolerance during 24 to 28 weeks of gesta- tion. Pregnant women with IGT and GDM had significantly elevated resistin compared with those of normal glucose toler- ance. In addition, the increased resistin levels were predictors for gestation glucose intolerance.
Risk factors for GDM include advanced gestational age, fam- ily history, excessive body weight before pregnancy, and being a nonwhite race such as Black, Hispanic, or Asian. In our study, HOMA-IR, HOMA2-%B, and leptin were significantly in- creased in GDM patients with obesity (BMI ≥25 kg/m2) before pregnancy (Table 2). HOMA2-%S was decreased. HOMA2-
%B increases to compensate for insulin resistance in patients, although pancreatic β-cell reserve is not sufficient. In compari- sons of maternal factors at pregnancy, a family history of DM was more frequent for the group aged ≥35 years. Late preg- nancy of women with genetic predisposition was high risk for GDM. The IOM and the National Research Council released a report recommending new guidelines for weight gain during pregnancy [19]. It is related with the increase in the number of American women of childbearing age who are overweight and obese, although the relation of weight gain during pregnancy and GDM are controversial. In our study, there were no differ- ences in adiponectin and insulin resistance in the comparisons according to the recommended weight range at GDM screen- ing. At present, the excessive weight gain during pregnancy has been more common. Women who gain excessive weight dur- ing pregnancy find it difficult to return to their pre-pregnancy weight, while obese women who gain weight within the guide- lines often are able to maintain a lower weight after the preg- nancy [37]. The group with excess weight gain showed signifi- cantly increased BMI at GDM screening, although pre-preg- nancy BMI was similar to the other group.
Leptin and HOMA-IR were positively correlated with BMI both before pregnancy and at screening for GDM in this study.
Kautzky-Willer et al. [38] reported a positive correlation be- tween leptin and body weight. Soheilykhah et al. [7] reported that leptin is significantly positively related to insulin and the
HOMA index in women with GDM and IGT. Participants in that study were more obese (BMI 26.7±3.7 kg/m2) and had higher leptin levels than those of our study. Adiponectin is negatively correlated to HOMA-IR and there was no correla- tion found between adiponectin and pre-pregnancy BMI by Vitoratos et al. [8]. In our study, adipokines were not correlated with insulin resistance or insulin sensitivity. Various studies have shown circulating adiponectin levels reduced in patients with GDM compared to normal pregnant women indepen- dent of pre-pregnancy BMI and insulin sensitivity [39,40]. To clarify the correlation between adiponectin and HOMA-IR in patients with GDM, the change of adipokines caused by insu- lin resistance related with GDM should be identified.
Our study has some limitations. First, this retrospective analysis was limited by the small sample size at a single center.
A large-scale prospective study would overcome these limita- tions. Second, our study indirectly used of surrogate measures of insulin resistance and β-cell function. Third, when the sub- jects were classified according to weight change during preg- nancy at screening for GDM, we used the recommended rates of weight gain of the IOM guidelines.
In summary, we evaluated the features of adipokines and in- sulin resistance according to the known maternal risk factors of GDM such as pre-pregnancy BMI, maternal age at pregnan- cy, and weight change during pregnancy at screening in preg- nant women with GDM. HOMA-IR and leptin were increased in GDM patients with obesity at pregnancy. They were posi- tively correlated with BMI before pregnancy and at screening for GDM. The effect of maternal age at pregnancy and weight change during pregnancy at GDM screening on adipokines and insulin resistance might be less pronounced than the effect of maternal obesity.
Although most women diagnosed with GDM return to nor- mal glucose tolerance soon after delivery, some have IGT or T2DM. Leptin and HOMA-IR were increased in GDM pa- tients with obesity before pregnancy and positively correlated with BMI both before pregnancy and at screening for GDM. It might be necessary to stratify GDM patients according to clini- cal characteristics and modify the strategy for management of GDM.
CONFLICTS OF INTEREST
No potential conflict of interest relevant to this article was re- ported.
REFERENCES
1. Proceedings of the 4th International Workshop-Conference on Gestational Diabetes Mellitus. Chicago, Illinois, USA. 14-16 March 1997. Diabetes Care 1998;21 Suppl 2:B1-167.
2. Khatun N, Latif SA, Uddin MM. Pregnancy associated compli- cations of mothers with gestational diabetes mellitus. My- mensingh Med J 2005;14:196-8.
3. Jawerbaum A, Gonzalez E. Diabetic pregnancies: the challenge of developing in a pro-inflammatory environment. Curr Med Chem 2006;13:2127-38.
4. Moore TR, Griffing GT, Khardori R, Talavera F, Warshak C, Zurawin RK: Diabetes mellitus and pregnancy. Available from:
http://emedicine.medscape.com/article/127547-overview (up- dated 2017 Fab 14).
5. Koo BK, Lee JH, Kim J, Jang EJ, Lee CH. Prevalence of gesta- tional diabetes mellitus in Korea: a National Health Insurance Database Study. PLoS One 2016;11:e0153107.
6. Gao XL, Yang HX, Zhao Y. Variations of tumor necrosis factor- alpha, leptin and adiponectin in mid-trimester of gestational diabetes mellitus. Chin Med J (Engl) 2008;121:701-5.
7. Soheilykhah S, Mojibian M, Rahimi-Saghand S, Rashidi M, Hadinedoushan H. Maternal serum leptin concentration in gestational diabetes. Taiwan J Obstet Gynecol 2011;50:149-53.
8. Vitoratos N, Deliveliotou A, Vlahos NF, Mastorakos G, Papa- dias K, Botsis D, Creatsas GK. Serum adiponectin during preg- nancy and postpartum in women with gestational diabetes and normal controls. Gynecol Endocrinol 2008;24:614-9.
9. Mokhtari M, Hashemi M, Yaghmaei M, Naderi M, Shikhzadeh A, Ghavami S. Evaluation of the serum leptin in normal preg- nancy and gestational diabetes mellitus in Zahedan, southeast Iran. Arch Gynecol Obstet 2011;284:539-42.
10. Xiao L, Zhao JP, Nuyt AM, Fraser WD, Luo ZC. Female fetus is associated with greater maternal insulin resistance in pregnan- cy. Diabet Med 2014;31:1696-701.
11. Retnakaran R, Qi Y, Connelly PW, Sermer M, Hanley AJ, Zin- man B. Low adiponectin concentration during pregnancy pre- dicts postpartum insulin resistance, beta cell dysfunction and fasting glycaemia. Diabetologia 2010;53:268-76.
12. Pfau D, Stepan H, Kratzsch J, Verlohren M, Verlohren HJ, Drynda K, Lossner U, Bluher M, Stumvoll M, Fasshauer M.
Circulating levels of the adipokine chemerin in gestational dia- betes mellitus. Horm Res Paediatr 2010;74:56-61.
13. Horosz E, Bomba-Opon DA, Szymanska M, Wielgos M. Third trimester plasma adiponectin and leptin in gestational diabetes
and normal pregnancies. Diabetes Res Clin Pract 2011;93:350- 6.
14. Soheilykhah S, Mohammadi M, Mojibian M, Rahimi-Saghand S, Rashidi M, Hadinedoushan H, Afkhami-Ardekani M. Ma- ternal serum adiponectin concentration in gestational diabetes.
Gynecol Endocrinol 2009;25:593-6.
15. Oh ES, Han JH, Han SM, Im JA, Rhee EJ, Park CY, Oh KW, Lee WY. Adipokine concentrations in pregnant Korean women with normal glucose tolerance and gestational diabetes melli- tus. Korean Diabetes J 2009;33:279-88.
16. Cho AR, Kim YJ, Chun SH, Cho SJ, Park EA, Park MH. Con- centration of cord serum adiponectin in normal and gestation- al diabetic pregnancies. Korean J Obstet Gynecol 2011;54:485- 91.
17. Kim C. Gestational diabetes mellitus in Korean women: simi- larities and differences from other racial/ethnic groups. Diabe- tes Metab J 2014;38:1-12.
18. Carpenter MW, Coustan DR. Criteria for screening tests for gestational diabetes. Am J Obstet Gynecol 1982;144:768-73.
19. Institute of Medicine (US) and National Research Council (US) Committee to Reexamine IOM Pregnancy Weight Guidelines, Rasmussen KM, Yaktine AL. Weight gain during pregnancy:
reexamining the guideline. Washington (DC): National Acad- emies Press (US); 2009.
20. Matthews DR, Hosker JP, Rudenski AS, Naylor BA, Treacher DF, Turner RC. Homeostasis model assessment: insulin resis- tance and beta-cell function from fasting plasma glucose and insulin concentrations in man. Diabetologia 1985;28:412-9.
21. Zavalza-Gomez AB, Anaya-Prado R, Rincon-Sanchez AR, Mora-Martinez JM. Adipokines and insulin resistance during pregnancy. Diabetes Res Clin Pract 2008;80:8-15.
22. Ramos MP, Crespo-Solans MD, del Campo S, Cacho J, Herrera E. Fat accumulation in the rat during early pregnancy is modu- lated by enhanced insulin responsiveness. Am J Physiol Endo- crinol Metab 2003;285:E318-28.
23. Malek A, Sager R, Schneider H. Effect of hypoxia, oxidative stress and lipopolysaccharides on the release of prostaglandins and cytokines from human term placental explants. Placenta 2001;22 Suppl A:S45-50.
24. Arner P. Insulin resistance in type 2 diabetes: role of the adipo- kines. Curr Mol Med 2005;5:333-9.
25. Fernandez-Real JM, Vayreda M, Richart C, Gutierrez C, Broch M, Vendrell J, Ricart W. Circulating interleukin 6 levels, blood pressure, and insulin sensitivity in apparently healthy men and women. J Clin Endocrinol Metab 2001;86:1154-9.
26. Bowen JM, Chamley L, Mitchell MD, Keelan JA. Cytokines of the placenta and extra-placental membranes: biosynthesis, se- cretion and roles in establishment of pregnancy in women.
Placenta 2002;23:239-56.
27. Diez JJ, Iglesias P. The role of the novel adipocyte-derived hor- mone adiponectin in human disease. Eur J Endocrinol 2003;
148:293-300.
28. Miehle K, Stepan H, Fasshauer M. Leptin, adiponectin and other adipokines in gestational diabetes mellitus and pre-ec- lampsia. Clin Endocrinol (Oxf) 2012;76:2-11.
29. Schubring C, Englaro P, Siebler T, Blum WF, Demirakca T, Kratzsch J, Kiess W. Longitudinal analysis of maternal serum leptin levels during pregnancy, at birth and up to six weeks af- ter birth: relation to body mass index, skinfolds, sex steroids and umbilical cord blood leptin levels. Horm Res 1998;50:276- 83.
30. Considine RV, Sinha MK, Heiman ML, Kriauciunas A, Ste- phens TW, Nyce MR, Ohannesian JP, Marco CC, McKee LJ, Bauer TL, Caro JF. Serum immunoreactive-leptin concentra- tions in normal-weight and obese humans. N Engl J Med 1996;334:292-5.
31. Misra VK, Trudeau S. The influence of overweight and obesity on longitudinal trends in maternal serum leptin levels during pregnancy. Obesity (Silver Spring) 2011;19:416-21.
32. Hardie L, Trayhurn P, Abramovich D, Fowler P. Circulating leptin in women: a longitudinal study in the menstrual cycle and during pregnancy. Clin Endocrinol (Oxf) 1997;47:101-6.
33. Lazar MA. Resistin- and obesity-associated metabolic diseases.
Horm Metab Res 2007;39:710-6.
34. Al-Badri MR, Zantout MS, Azar ST. The role of adipokines in gestational diabetes mellitus. Ther Adv Endocrinol Metab 2015;6:103-8.
35. Park S, Kim MY, Baik SH, Woo JT, Kwon YJ, Daily JW, Park YM, Yang JH, Kim SH. Gestational diabetes is associated with high energy and saturated fat intakes and with low plasma vis- fatin and adiponectin levels independent of prepregnancy BMI. Eur J Clin Nutr 2013;67:196-201.
36. Jo YK, Im JA. Adiponectin level in non-pregnant women, pregnant women without diabetes and pregnant women with diabetes. J Exp Biomed Sci 2008;14:233-8.
37. Bloomgarden ZT. Gestational diabetes mellitus and obesity.
Diabetes Care 2010;33:e60-5.
38. Kautzky-Willer A, Pacini G, Tura A, Bieglmayer C, Schneider B, Ludvik B, Prager R, Waldhausl W. Increased plasma leptin in gestational diabetes. Diabetologia 2001;44:164-72.
39. Retnakaran R, Hanley AJ, Raif N, Connelly PW, Sermer M, Zinman B. Reduced adiponectin concentration in women with gestational diabetes: a potential factor in progression to type 2 diabetes. Diabetes Care 2004;27:799-800.
40. Cortelazzi D, Corbetta S, Ronzoni S, Pelle F, Marconi A, Cozzi V, Cetin I, Cortelazzi R, Beck-Peccoz P, Spada A. Maternal and foetal resistin and adiponectin concentrations in normal and complicated pregnancies. Clin Endocrinol (Oxf) 2007;66:447- 53.