https://doi.org/10.5468/ogs.20012 pISSN 2287-8572 · eISSN 2287-8580
Introduction
Osteoporosis is the most common metabolic bone disease caused by reduced bone mineral density (BMD) and is associ- ated with high risk of bone fractures. Fractures due to osteo- porosis are closely related to the mortality rate of the elderly population, and there is an increased prevalence of osteopo- rosis due to increased life expectancy. Therefore, social and medical interest in the risk factors, diagnosis, and treatment methods of osteoporosis is increasing. Several systemic con- ditions and diseases may affect bone mineral density, includ-
Effect of gynecological cancer and its treatment on bone mineral density and the risk of osteoporosis and osteoporotic fracture
Jeong Eun Lee, MM, Che Yon Park, MM, Eunhyun Lee, MD, Yong Il Ji, MD, PhD
Department of Obstetrics and Gynecology, Inje University, Haeundae Paik Hospital, Busan, Korea
Objective
The purpose of this study was to evaluate the risk of osteopenia and osteoporosis by examining the bone mineral density (BMD) of the lumbar spine and femur in patients with gynecological cancer without bone metastasis and to evaluate the impact of treatment for different cancers on BMD.
Methods
This study retrospectively reviewed the medical records of 243 women with gynecological cancer and 240 controls between March 2010 and December 2016. Patients with cervical cancer (n=105), endometrial cancer (n=63), and ovarian cancer (n=75) were treated with total hysterectomy including bilateral salpingo-oophorectomy and/or chemotherapy and/or radiotherapy. For the control group, healthy post-menopausal women without gynecologic cancer were selected.
Results
Before anticancer treatment, the BMD of patients with cervical cancer and ovarian cancer was significantly lower than that of the controls, and the BMD of patients with endometrial cancer was not significantly different from that of the controls. However, the BMD of endometrial cancer significantly decreased after treatment. According to the treatment methods, there were significant differences in the BMD of L3, L4, and the femur neck. Changes in the BMD were lowest in patients who underwent surgical treatment only, and the highest bone loss was found in patients who underwent postoperative concurrent chemoradiotherapy.
Conclusion
Patients with cervical and ovarian cancer had lower BMD than those in the control group before treatment, and patients with endometrial cancer had decreased bone density after treatment. Therefore, during the treatment of gynecological cancer, strategies should be implemented to mitigate these risks.
Keywords: Bone density; Treatment-associated cancer; Osteoporosis
Received: 2020.01.07. Revised: 2020.03.03. Accepted: 2020.03.19.
Corresponding author: Yong Il Ji, MD, PhD
Department of Obstetrics and Gynecology, Inje University, Haeundae Paik Hospital, 875 Haeun-daero, Haeundae-gu, Busan 48108, Korea
E-mail: jyimdog@paik.ac.kr
https://orcid.org/0000-0002-1030-6105
Articles published in Obstet Gynecol Sci are open-access, distributed under the terms of the Creative Commons Attribution Non-Commercial License (http://creativecommons.
org/licenses/by-nc/3.0/) which permits unrestricted non-commercial use, distribution, and reproduction in any medium, provided the original work is properly cited.
Copyright © 2020 Korean Society of Obstetrics and Gynecology
ing insufficient calcium intake, excessive sodium intake, lack of exercise, chronic kidney disease, parathyroid disease, hy- perthyroidism, and gastrointestinal absorption disorder [1].
The mean BMD of women is lower than that of men, and bone mass accumulates between 20 and 30 years of age.
The loss of bone density is most rapid after the age of 50, particularly 5 years after menopause in women [2,3]. A de- crease in estrogen in postmenopausal women affects bone and lipid metabolism [4]. Estrogen plays an important role in the osteoclast–osteoblast balance related to maintenance of the BMD. It is known that BMD decreases when estrogen concentration decreases [5].
Previous studies have reported low BMD and high serum calcium levels in various types of cancer including prostate and breast cancer without bone metastasis [6-11]. The de- crease in the BMD associated with cancer may be linked to the osteoclastic effect of the malignant cell itself as well as the cancer treatment-induced bone loss (CTIBL) caused by surgery, chemotherapy, and radiation therapy [12-14]. Go- nadal dysfunction due to cancer treatment reduces hormone secretion, leading to decreased BMD.
The purpose of this study was to evaluate the risk of osteo- penia and osteoporosis in patients with gynecological cancer according to the type of cancer and to analyze the BMD of the lumbar spine and femoral neck after various cancer treatments including surgery, chemotherapy, and radiation therapy.
Materials and methods
Between March 2010 and December 2016, a retrospec- tive study was conducted by analyzing the medical records of women who were treated at Haeundae Paik Hospital Obstetrics and Gynecology. All subjects underwent physical examination, blood tests, ultrasonography, and bone mineral density measurements.
1. Study participants
A total 243 patients with gynecological cancer were se- lected for this study. Patients with cervical cancer (n=105), endometrial cancer (n=63), and ovarian cancer (n=75) were treated with total hysterectomy including bilateral salpingo- oophorectomy and/or chemotherapy and/or radiotherapy. Six patients with bone metastasis or those who did not undergo
surgery due to an advanced stage of cancer were excluded.
For the control group, 240 healthy post-menopausal women who did not have menstruation for 1 year were selected. The BMD was measured before and 1 year after cancer treat- ment. In the control group, the BMD was measured again 1 year after the initial test.
Patients with thyroid disease, parathyroid disease, kidney stones, hyperprolactinemia, malabsorptive disorder, or previ- ous pathologic fractures that may affect bone metabolism were excluded from the study. Patients who were prescribed medication that may affect the study outcomes, such as hor- mones, bisphosphonates, calcitonin, vitamin D, or calcium, were also excluded.
2. Methods
1) Bone mineral density measurement
The BMD of the 1st–4th lumbar spine and femoral neck was determined by measurement with dual-energy X-ray absorp- tiometry (DXA, Lunar Radiation Corp., Madison, WI, USA).
According to the criteria of the World Health Organization, the diagnosis of osteopenia was made with a T-score in the range of −1.0 and −2.5 and that of osteoporosis with a T-score of −2.5 or below [15,16].
2) Cancer treatment
Gynecological cancer patients were treated with total hys- terectomy including bilateral salpingo-oophorectomy and/or chemotherapy and/or radiotherapy. Eighty-five patients re- ceived only surgical treatment, and 92 patients were treated with surgery and an adjuvant or palliative chemotherapy.
Eight patients received surgery and radiotherapy, and 58 patients received surgical treatment with concurrent chemo- radiation therapy (CCRT). Forty-four cervical cancer patients underwent only total hysterectomy with bilateral salpingo- oophorectomy, and 48 patients underwent postoperative CCRT. Thirty-eight endometrial cancer patients (60.3%) underwent surgical treatment only. Most ovarian cancer pa- tients (90.7%) were treated with chemotherapy after surgery (Table 1).
3) Research variable factors
Age, height, weight, body mass index (BMI), and obstetric
history were included as common demographic character-
istics. In gynecological cancer patients, the cancer stage ac-
cording to the International Federation of Gynecology and Obstetrics (FIGO) classification, histological classification, and cancer treatment methods were included as research vari- ables. Among them, the variables that showed a significant difference were set as covariates.
4) Statistical analysis
Statistical analysis was performed using International Busi- ness Machines (IBM) Statistical Package for the Social Sci- ences (SPSS) ver. 23.0 (IBM Corp., Armonk, NY, USA), and statistical significance was set as P<0.05. The independent
t-test was used to compare continuous variables such as age,weight, and height, and the χ
2test was used to compare the discrete variables such as obstetric history and prevalence of osteopenia and osteoporosis. According to cancer type, con- tinuous variables were compared using analysis of variance.
A multiple linear regression analysis was used to analyze the factors affecting BMD.
Results
1. Demographic characteristics
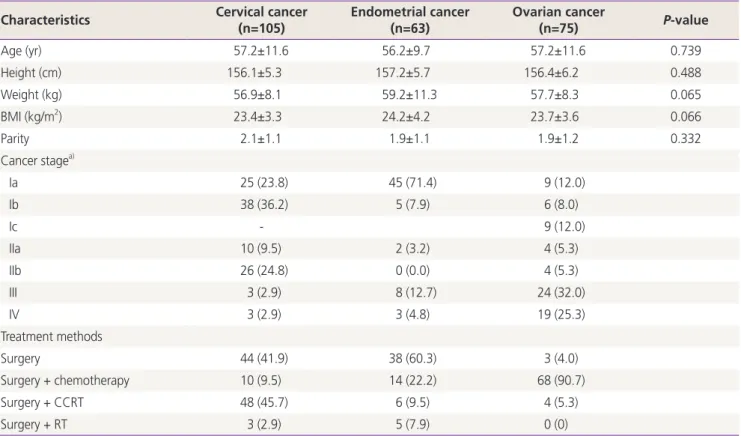
Table 1 shows demographic characteristics, cancer stage according to the FIGO classification, and cancer treatment methods of gynecological cancer patients. The mean age, height, weight, BMI, and obstetric history of patients with cervical cancer, endometrial cancer, and ovarian cancer were not significantly different between the groups. The body weight of the endometrial cancer group was greater than that of the other groups, and the BMI was slightly higher;
however, there was no significant difference between the groups.
According to the FIGO classification, 25 (23.8%), 38 (36.2%), and 26 (24.8%) patients had cervical cancer at stages Ia, Ib, and IIb, respectively. Forty-five (71.4%) patients in the endometrial cancer group had stage Ia, and 24 (32.0%) and 19 (25.3%) patients in the ovarian cancer group had
Table 1. Demographic characteristics, cancer stage and treatment methods of patients with gynecologic cancer Characteristics Cervical cancer
(n=105) Endometrial cancer
(n=63) Ovarian cancer
(n=75) P-value
Age (yr) 57.2±11.6 56.2±9.7 57.2±11.6 0.739
Height (cm) 156.1±5.3 157.2±5.7 156.4±6.2 0.488
Weight (kg) 56.9±8.1 59.2±11.3 57.7±8.3 0.065
BMI (kg/m2) 23.4±3.3 24.2±4.2 23.7±3.6 0.066
Parity 2.1±1.1 1.9±1.1 1.9±1.2 0.332
Cancer stagea)
Ia 25 (23.8) 45 (71.4) 9 (12.0)
Ib 38 (36.2) 5 (7.9) 6 (8.0)
Ic - 9 (12.0)
IIa 10 (9.5) 2 (3.2) 4 (5.3)
IIb 26 (24.8) 0 (0.0) 4 (5.3)
III 3 (2.9) 8 (12.7) 24 (32.0)
IV 3 (2.9) 3 (4.8) 19 (25.3)
Treatment methods
Surgery 44 (41.9) 38 (60.3) 3 (4.0)
Surgery + chemotherapy 10 (9.5) 14 (22.2) 68 (90.7)
Surgery + CCRT 48 (45.7) 6 (9.5) 4 (5.3)
Surgery + RT 3 (2.9) 5 (7.9) 0 (0)
Continuous variables were compared by analysis of variance test and categorical variables by χ2 tests. Values are presented as mean±standard deviation or number (%).
BMI, body mass index; CCRT, concurrent chemoradiation therapy; RT, radiation therapy; FIGO, International Federation of Gynecology and Ob- stetrics.
a)The cancer stage follows the FIGO classification.
stages III and IV advanced stage, respectively.
2. Bone mineral density before and after cancer treatment according to cancer type
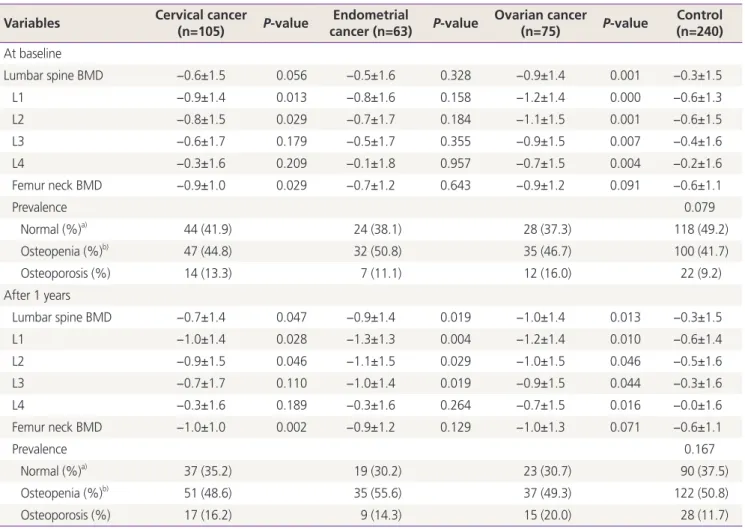
The BMD before and after cancer treatment in patients with cervical cancer, endometrial cancer, and ovarian cancer was compared with those of the control group (Table 2). There was no significant difference between the cancer type; how- ever, the T-scores of ovarian cancer patients were lower than those of cervical cancer and endometrial cancer patients.
Before beginning cancer treatment, the BMD of cervical cancer patients was significantly lower in the 1st and 2nd lumbar spine and femoral neck than in the control group.
Ovarian cancer patients showed significantly lower BMD
from L1 to L4, at each level. The average T-score with stan- dard deviation of the lumbar spine was −0.9±1.4, and the T-scores from the 1st to 4th lumbar spine were −1.2±1.4,
−1.1±1.5, −0.9±1.5, and −0.7±1.5, respectively, which was significantly lower than those of the control group. However, the T-scores of endometrial cancer patients were not signifi- cantly different from those of the control group.
Among 243 women with gynecological cancer, 96 (39.5%) were in the normal range, 114 (46.9%) were diagnosed with osteopenia, and 33 (13.6%) were diagnosed with osteopo- rosis according to the criteria of the World Health Organiza- tion. In 240 control subjects, 118 (49.2%), or approximately half were in the normal range, 100 (41.7%) were diagnosed with osteopenia and 22 (9.2%) were diagnosed with os-
Table 2. The T-scores of the lumbar spine and femur neck according to the type of cancer compared with the controls and the prevalence of osteopenia and osteoporosis before and after cancer treatment
Variables Cervical cancer
(n=105) P-value Endometrial
cancer (n=63) P-value Ovarian cancer
(n=75) P-value Control (n=240) At baseline
Lumbar spine BMD −0.6±1.5 0.056 −0.5±1.6 0.328 −0.9±1.4 0.001 −0.3±1.5
L1 −0.9±1.4 0.013 −0.8±1.6 0.158 −1.2±1.4 0.000 −0.6±1.3
L2 −0.8±1.5 0.029 −0.7±1.7 0.184 −1.1±1.5 0.001 −0.6±1.5
L3 −0.6±1.7 0.179 −0.5±1.7 0.355 −0.9±1.5 0.007 −0.4±1.6
L4 −0.3±1.6 0.209 −0.1±1.8 0.957 −0.7±1.5 0.004 −0.2±1.6
Femur neck BMD −0.9±1.0 0.029 −0.7±1.2 0.643 −0.9±1.2 0.091 −0.6±1.1
Prevalence 0.079
Normal (%)a) 44 (41.9) 24 (38.1) 28 (37.3) 118 (49.2)
Osteopenia (%)b) 47 (44.8) 32 (50.8) 35 (46.7) 100 (41.7)
Osteoporosis (%) 14 (13.3) 7 (11.1) 12 (16.0) 22 (9.2)
After 1 years
Lumbar spine BMD −0.7±1.4 0.047 −0.9±1.4 0.019 −1.0±1.4 0.013 −0.3±1.5
L1 −1.0±1.4 0.028 −1.3±1.3 0.004 −1.2±1.4 0.010 −0.6±1.4
L2 −0.9±1.5 0.046 −1.1±1.5 0.029 −1.0±1.5 0.046 −0.5±1.6
L3 −0.7±1.7 0.110 −1.0±1.4 0.019 −0.9±1.5 0.044 −0.3±1.6
L4 −0.3±1.6 0.189 −0.3±1.6 0.264 −0.7±1.5 0.016 −0.0±1.6
Femur neck BMD −1.0±1.0 0.002 −0.9±1.2 0.129 −1.0±1.3 0.071 −0.6±1.1
Prevalence 0.167
Normal (%)a) 37 (35.2) 19 (30.2) 23 (30.7) 90 (37.5)
Osteopenia (%)b) 51 (48.6) 35 (55.6) 37 (49.3) 122 (50.8)
Osteoporosis (%) 17 (16.2) 9 (14.3) 15 (20.0) 28 (11.7)
The T-scores are presented as mean±standard deviation, P-value by independent t-test.
BMD, bone mineral density; WHO, World Health Organization.
a)Values are presented as number (%), P-value by χ2 test; b)Diagnosed by T-scores of lumbar spine or femur neck according to WHO criteria.
teoporosis. There was no significant difference between the groups (P=0.079); however, the rates of osteopenia and osteoporosis were 5.2% and 4.4% higher in cancer patients than in the control group, respectively.
After 1 year of cancer treatment, the average T-score of the lumbar spine, the T-score of the 1st to 2nd lumbar spine, and femoral neck in cervical cancer patients was significantly lower than those in the control group. In the ovarian cancer group, the average T-scores of L1-L4 and the 1st to 4th level of the lumbar spine were significantly lower than those of the control group. In patients with endometrial cancer, the T-score of the 1st to 3rd level of the lumbar spine and the av- erage T-score of L1-L4 was significantly lower than those of the control group.
Changes in the BMD before and after cancer treatment according to the type of gynecological cancer are shown in Fig. 1. In endometrial cancer patients, the BMD was signifi- cantly lower than that in cervical cancer and ovarian cancer
patients, and there was a significant difference in the lumbar spine (P=0.024).
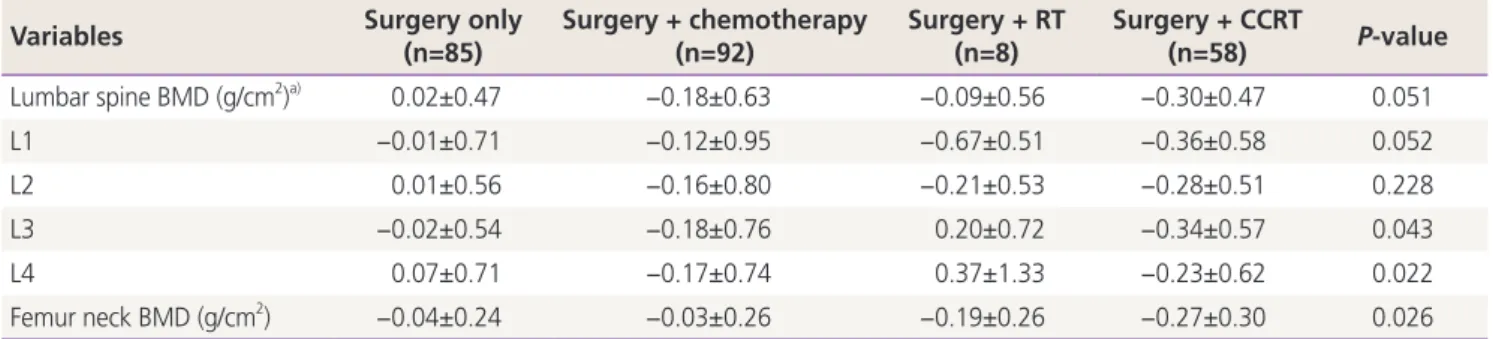
3. Changes in bone mineral density according to treatment method
In 243 patients with gynecological cancer, changes in the BMD before and after cancer treatment were compared in relation to the different treatment methods (Table 3). The T-scores of the 3rd and 4th lumbar spine and the femoral neck were significantly different according to the treatment methods. The smallest change in the BMD was observed in 85 patients who had undergone only surgical treatment, including bilateral salpingo-oophorectomy. Conversely, the T-scores of the 58 patients who received surgical treatment with CCRT significantly decreased after treatment.
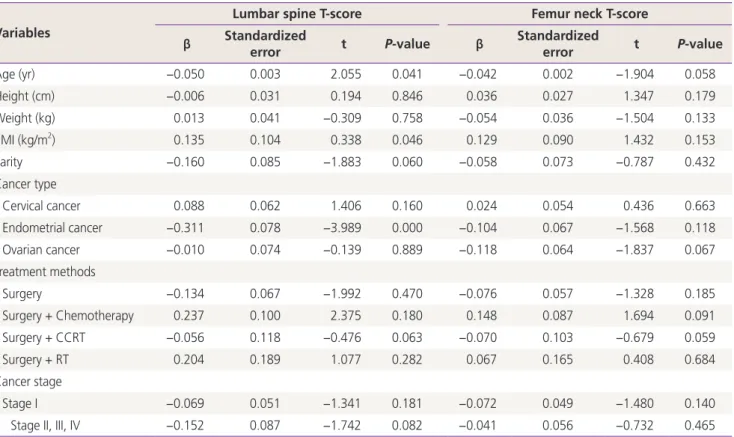
4. Factors associated with bone loss
The factors affecting the BMD in gynecological cancer pa-
Fig. 1. The T-scores of the lumbar spine and femur neck in patients with gynecologic cancer before and after treatment. BMD, bone min- eral density.
-0.4 -0.5 -0.6 -0.7 -0.8 -0.9 -1.0 -1.1
-0.4 -0.5 -0.6 -0.7 -0.8 -0.9 -1.0 -1.1 -1.2 Cervical cancer
Endometrial cancer Ovarian cancer
Cervical cancer Endometrial cancer Ovarian cancer
Baseline After treatment Baseline After treatment
Table 3. The changes of bone mineral density in patients with gynecologic cancer according to treatment methods
Variables Surgery only
(n=85)
Surgery + chemotherapy (n=92)
Surgery + RT (n=8)
Surgery + CCRT
(n=58) P-value
Lumbar spine BMD (g/cm2)a) 0.02±0.47 −0.18±0.63 −0.09±0.56 −0.30±0.47 0.051
L1 −0.01±0.71 −0.12±0.95 −0.67±0.51 −0.36±0.58 0.052
L2 0.01±0.56 −0.16±0.80 −0.21±0.53 −0.28±0.51 0.228
L3 −0.02±0.54 −0.18±0.76 0.20±0.72 −0.34±0.57 0.043
L4 0.07±0.71 −0.17±0.74 0.37±1.33 −0.23±0.62 0.022
Femur neck BMD (g/cm2) −0.04±0.24 −0.03±0.26 −0.19±0.26 −0.27±0.30 0.026
Values are presented as mean±standard deviation, P-value by analysis of variance.
BMD, bone mineral density; CCRT, concurrent chemoradiation therapy; RT, radiation therapy
a)Mean change of T-scores.
tients were analyzed by multiple linear regression analysis (Table 4). Age and BMI were found to affect the BMD in the lumbar spine and femur neck, and there was no significant relationship between height, weight, and obstetric history and the BMD. There was a negative correlation between age and the BMD, whereas there was a positive correlation between BMI and the BMD. According to the type of cancer, endometrial cancer showed a negative correlation with the BMD, but it was not a significant variable in other types of cancer. There was no significant difference when analyzing the influence of treatment methods and the stages of cancer.
Discussion
The life expectancy of gynecological cancer patients has improved due to the advances in medical technology for diagnosing and treating gynecological cancer. Quality of life is also important for patients with longer life expectancy, and osteoporosis can have a significant impact on quality of
life. Previous studies have reported a decrease in bone den- sity and hypercalcemia in patients with other malignancies without bone metastasis [6-11]. Studies have shown that malignant tumor cells secrete serum growth factors that pro- mote bone resorption and bone destruction. Prostaglandins [17,18], tumor growth factor [19], osteoclast activator [11], and parathyroid hormone analogue [20,21] are known be involved in osteoclast activation [15].
The purpose of this study was to evaluate the risk of os- teopenia and osteoporosis in patients diagnosed with gyne- cological cancer and to investigate the differences according to the type of cancer. Furthermore, we tried to identify the changes after cancer treatment. When the BMD before can- cer treatment was compared according to the type of cancer, the BMD of cervical cancer patients was significantly lower in the 1st and 2nd lumbar spine and the femoral neck than that in the control group. Previous studies have reported a lower BMD of the lumbar spine in cervical cancer patients before cancer treatment [22-24]. Hung et al. [24] reported that premenopausal patients with cervical cancer had signifi-
Table 4. The factors associated with bone loss by a multiple linear regression analysis Variables
Lumbar spine T-score Femur neck T-score
β Standardized
error t P-value β Standardized
error t P-value
Age (yr) −0.050 0.003 2.055 0.041 −0.042 0.002 −1.904 0.058
Height (cm) −0.006 0.031 0.194 0.846 0.036 0.027 1.347 0.179
Weight (kg) 0.013 0.041 −0.309 0.758 −0.054 0.036 −1.504 0.133
BMI (kg/m2) 0.135 0.104 0.338 0.046 0.129 0.090 1.432 0.153
Parity −0.160 0.085 −1.883 0.060 −0.058 0.073 −0.787 0.432
Cancer type
Cervical cancer 0.088 0.062 1.406 0.160 0.024 0.054 0.436 0.663
Endometrial cancer −0.311 0.078 −3.989 0.000 −0.104 0.067 −1.568 0.118
Ovarian cancer −0.010 0.074 −0.139 0.889 −0.118 0.064 −1.837 0.067
Treatment methods
Surgery −0.134 0.067 −1.992 0.470 −0.076 0.057 −1.328 0.185
Surgery + Chemotherapy 0.237 0.100 2.375 0.180 0.148 0.087 1.694 0.091
Surgery + CCRT −0.056 0.118 −0.476 0.063 −0.070 0.103 −0.679 0.059
Surgery + RT 0.204 0.189 1.077 0.282 0.067 0.165 0.408 0.684
Cancer stage
Stage I −0.069 0.051 −1.341 0.181 −0.072 0.049 −1.480 0.140
Stage II, III, IV −0.152 0.087 −1.742 0.082 −0.041 0.056 −0.732 0.465
β and standardized error are unstandardized coefficients.
BMI, body mass index; CCRT, concurrent chemoradiation therapy; RT, radiation therapy.