http://e-nrp.org
Student feedback to improve the United States Department of Agriculture Fresh Fruit and Vegetable Program
Yi-Chun Lin and Alyce D. Fly§
School of Public Health, Indiana University Bloomington, 1025 E 7th St., PH 116, Bloomington, IN 47405, USA
BACKGROUND/OBJECTIVES: Fruit and vegetable consumption of children in the United States falls below recommendations.
The U.S. Department of Agriculture Fresh Fruit and Vegetable Program (FFVP) is a national free-fruit and vegetable school distribution program designed to address this problem. This permanent, legislated program provides funding to qualified elementary schools for provision of additional fruit and vegetables outside of school meals. The objective of this study was to understand children’s perceptions of FFVP after the intervention and formulate recommendations that may improve success of the intervention.
SUBJECTS/METHODS: Secondary data were obtained from 5,265 4th-6th graders at 51 randomly-selected FFVP intervention schools in Indiana. Anonymous questionnaires were completed late in the 2011-2012 academic year. Multilevel logistic regressions were used to determine associations between students’ perceptions of program effects (4 close-ended items) and their preference toward the program. Content analysis was applied to a single open-ended item for program comments.
RESULTS: Over 47% of students reported greater intake of fruit and vegetables due to FFVP, and over 66% reported liking the program. Student-reported program effects were positively associated with preference for the program (P < 0.01). Themes that emerged during analysis of 3,811 comments, included, students liked: the opportunity to try different kinds of fruit and vegetables, types and flavors of fruits served, and benefits of eating fruit. Fewer students liked the types of vegetables and their benefits. A small group disliked the program citing poor flavor of vegetables and quality of fruits. Important suggestions for the program include serving more dipping sauces for vegetables, cooking vegetables, and providing a greater variety of produce.
CONCLUSIONS: The degree that students liked FFVP may predict the program’s effects on fruit and vegetable intake. FFVP may become more acceptable to students by incorporating their suggestions. Program planners should consider these options for achieving program goals.
Nutrition Research and Practice 2016;10(3):321-327; doi:10.4162/nrp.2016.10.3.321; pISSN 1976-1457 eISSN 2005-6168 Keywords: Fruit intake, vegetable intake, environmental intervention, program evaluation, school nutrition
INTRODUCTION10)
Research has shown that fruit and vegetable intake of U.S.
children has not met national dietary recommendations [1,2].
Children with inadequate fruit and vegetable intake have a higher risk of becoming overweight or obese [3]. Consequently, free or subsidized fruit- and/or vegetable- distribution programs in school settings have been developed to increase the amount and variety of fruit and vegetable consumption [4-6]. Several of these programs have been found to be effective [7-11]. The largest free fruit and vegetable distribution program in the United States is the U.S. Department of Agriculture Fresh Fruit and Vegetable Program (FFVP), a federally funded program that became a permanent program in 2004, and was expanded to all states in 2008. Eligibility has been limited to elementary schools since 2010 [12]. FFVP was designed with two goals:
expanding the variety of fruit and vegetables students experience,
and increasing their fruit and vegetable consumption [12].
Due to budget constraints, participation in the FFVP is competitive within states [13], where annual grants are awarded with priority to schools with high percentages of students eligible for free- or reduced-price school meals. This policy is intended to maximize benefits to school children with fewer opportunities to consume fresh fruit and vegetables [12]. Each school year, funding is given to selected schools to purchase a variety of fresh fruits and vegetables for school children as snacks outside of their regular meal periods, thus improving the availability of fruits and vegetables at school [14]. The funding is provided for fruit and vegetable purchase, preparation, and service only, but not for related activities, such as nutrition education.
Results from previous evaluations of the program in different states demonstrated that the FFVP has improved elementary students’ fruit-eating behaviors over time [15-18], behaviors
The study was partially funded by Indiana University.
§Corresponding Author: Alyce D. Fly, Tel. 1-812-855-7975, Fax. 1-812-855-3936, Email. afly@indiana.edu Received: August 25, 2015, Revised: January 22, 2016, Accepted: January 23, 2016
This is an Open Access article distributed under the terms of the Creative Commons Attribution Non-Commercial License (http://creativecommons.org/licenses/by-nc/3.0/) which permits unrestricted non-commercial use, distribution, and reproduction in any medium, provided the original work is properly cited.
Demographics 51 Intervention Schools (n = 5,265) School characteristics (N = 51)
School size, n1),2) 447 ± 142
Locale, N1) (%)
City 28 (54.9)
Suburb 11 (21.6)
Town 8 (15.7)
Rural 4 (7.8)
Meal eligibility, (mean % of students per school)2)
Free 76.6 ± 9.9
Reduced priced 7.5 ± 3.6
Paid 15.9 ± 7.6
Student characteristics (n = 5,265) Grade, n1) (%)
4th 2,093 (39.7)
5th 2,193 (41.6)
6th 979 (18.6)
Gender, n1) (%)
Boys 2,639 (50.1)
Girls 2,626 (49.9)
Race, n1) (%)
Asian or Asian American 102 (1.9)
African American 1,234 (23.4)
White 2,143 (40.7)
Native American 129 (2.5)
Others 1,657 (31.5)
Ethnicity, n1) (%)
Non-Hispanic 3,761 (71.4)
Hispanic 1,504 (28.6)
1)N = number of schools; n = number of students.
2)Mean ± SD
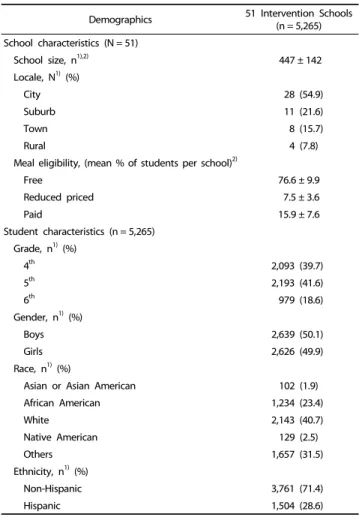
Table 1. Characteristics of intervention schools and students
related to improving vegetable intake (e.g., asking parents to buy vegetables, or eating different kinds of vegetables daily) [15,18], and willingness to try new fresh produce [16,19]. Results from other studies, however, indicated that the repeated exposure to fruits and vegetables in FFVP did not have a significant impact on school children’s vegetable consumption [16,20,21], and suggested that further studies are needed to help confirm the program’s success. However, little research has been con- ducted to examine students’ opinions or comments about the overall program, which might provide valuable feedback that can be used to improve the program. The objective of this study was to understand children’s perceptions of FFVP after the intervention and formulate recommendations that may improve success of the intervention.
Secondary data were used for this study, including students’
responses to several closed-ended items and qualitative data from an open-ended item on the Indiana FFVP Student Survey.
The hypothesis, there is a strong association between students’
preference for the program and their perception of personal or self-reported behavior changes due to the FFVP, was tested using responses to close-ended items with quantitative metho- dology. Responses to open-ended questions were used to answer the research question “what are students’ perceptions of the overall program after the intervention?” Responses derived from open-ended survey questions may provide rich qualitative data [22]. Such data help understand and explain student perceptions of the program in the student’s own words, providing more meaning behind the quantitative results. In addition the student reasoning or thought process regarding their perception may be revealed in freely written responses, and in such ways are useful in the program evaluation process [23]. When responses to open-ended questions are collected from a relatively representative sample of a general population, a broader scope of responses will be obtained compared to those collected through focus groups or interviews, with smaller sample size [24]. It can be more cost-effective to conduct quali- tative analysis using the responses from open-ended survey items. Additionally, open-ended questions in anonymous surveys collect more honest responses from participants compared to interviews and focus groups [25]. Most importantly, the open- ended survey items allow the researchers to collect the opinions about a shared experience (i.e., experience related to an intervention) for the sampled population, and enable key themes to be identified [26].
SUBJECTS AND METHODS Data for the secondary data analysis
The 2011-2012 Indiana FFVP Student Survey data used for this study were obtained from a posttest in spring, 2012, conducted by the Indiana Department of Education (IDOE).
Classroom teachers administered the surveys by reading ques- tions aloud to students in their classrooms. Data were collected from 51 intervention schools (n = 5,265) randomly selected from the 107 elementary schools that received program awards.
Permission to analyze this existing data set was granted by the university institutional review board (IRB #1407577914).
Information regarding school-level characteristics was collected
from the IDOE COMPASS dataset [27]. It included school locale, total student enrollment, and percentage of students eligible for free- or reduced-price meals (Table 1).
Items used for the secondary data analysis
The Indiana FFVP Student Survey (posttest version, 2011- 2012) included 64 items designed for 4th-6th grade elementary students in Indiana. Responses to 10 items were used in this study, including demographic items (four items), students' perceptions of the program effect (four items), a single item measuring how much children liked FFVP, and a single open- ended item for program comments. Demographic items included grade (4th, 5th, 6th), gender (boy, girl), race (Asian, Asian American, African American, White, Native American, or other) and ethnicity (non-Hispanic or Hispanic). Race and ethnicity items reflected categories on the U.S. census.
Items measuring students’ perception of program effective- ness included “FFVP makes me eat more fruit in school,” “FFVP makes me eat more fruit outside of school,” “FFVP makes me eat more vegetables in school,” and “FFVP makes me eat more vegetables outside of school.” Response options to these items were “Yes” or “No”. Another item measured how much the students liked the program, that is, preference for the program
Program influence Preference Predicted probability (%)2)
Change in predicted probability ± SE(%)3)
OR
(95% CI)3) P-value4)
FFVP makes me eat more fruit in school Like very much 87.1 +21.7 ± 4.2 3.57 (2.41, 5.28) < 0.01
Like 83.6 +18.2 ± 4.1 2.69 (1.86, 3.90) < 0.01
Just OK 74.2 +8.8 ± 4.0 1.52 (1.07, 2.15) 0.02
Dislike 64.2 -1.2 ± 5.3 0.95 (0.60, 1.50) 0.82
Dislike very much 65.4 - (Reference) 1.00 (Reference) -
FFVP makes me eat more fruit outside of
school Like very much 78.4 +32.0 ± 4.1 4.19 (3.00, 5.85) < 0.01
Like 72.0 +25.6 ± 3.8 2.97 (2.18, 4.03) < 0.01
Just OK 59.0 +12.6 ± 4.0 1.67 (1.21, 2.28) < 0.01
Dislike 55.5 +9.1 ± 5.6 1.44 (0.93, 2.25) 0.11
Dislike very much 46.4 - (Reference) 1.00 (Reference) -
FFVP makes me eat more vegetables in school
Like very much 75.9 +28.8 ± 4.9 3.54 (2.41, 5.21) < 0.01
Like 63.5 +16.4 ± 4.8 1.96 (1.34, 2.87) < 0.01
Just OK 51.6 +4.5 ± 4.5 1.20 (0.84, 1.71) 0.32
Dislike 39.0 -8.1 ± 5.9 0.72 (0.45, 1.16) 0.18
Dislike very much 47.1 - (Reference) 1.00 (Reference) -
FFVP makes me eat more vegetables
outside of school Like very much 61.9 +34.4 ± 3.5 4.28 (3.03, 6.03) < 0.01
Like 45.3 +17.8 ± 3.5 2.18 (1.56, 3.04) < 0.01
Just OK 30.1 +2.6 ± 3.2 1.13 (0.83, 1.55) 0.43
Dislike 23.8 -3.7 ± 4.3 0.82 (0.52, 1.29) 0.39
Dislike very much 27.5 - (Reference) 1.00 (Reference) -
1)Data collected at FFVP posttest during the 2011-2012 school year were used for the analysis.
2)Predicted probability of students’ eating behaviors being influenced by FFVP at different degrees of liking
3)Changes in predicted probability using “dislike very much” as the reference group; OR based on “dislike very much” as the reference group.
4)P-value obtained after comparison with reference group (“dislike very much”) through multilevel logistic regression analysis.
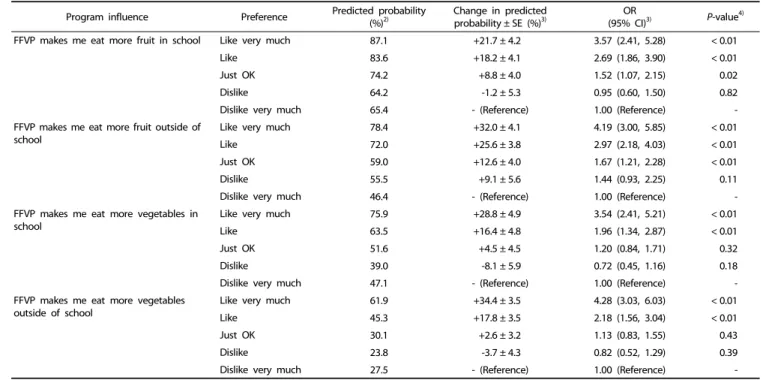
Table 2. Association between the probability of being influenced by FFVP and degree of students’ preference for the program1)
with “How well do you like the Fresh Fruit & Vegetable Program?”
The responses formed a five-point Likert scale and included,
“Like very much,” “Like,” “Just OK,” “Dislike,” and “Dislike very much”. Children between the ages of 9-12 may lose attention during a lengthy questionnaire containing multiple items underlying the same concept. Thus, single items were used to answer simple questions about children’s perception or opinions, which were reviewed by content experts and teachers that work with children in this age group.
At the end of posttest survey, intervention students were asked to provide their responses to the open-ended survey item
“Do you have any comments you want to make about the Fresh Fruit and Vegetable Program?” A large text box was provided in which students could leave several comments.
Data analysis
Students’ responses were not included in the analysis if there were data missing from their demographic profiles (4.3%).
Descriptive statistics were applied to school level characteristics and students’ self-reported demographics. Student perception of program influence was indirectly assessed as the percent of students who responded yes to whether they ate more fruit or ate more vegetables either in school or outside of school due to the FFVP. Percentages of student responses about how much they liked the FFVP (i.e., preference for the program) were also calculated. Multilevel logistic regression models were then conducted to determine the association between the program influences and students’ preference for the program. Two-level models were used in the analyses, using students as level one and schools as level two, to account for correlations among
responses from students within the same school. After the analysis, odds ratios and 95% confidence intervals were computed to determine if differences in program influence varied by students’ preference for the program (with 5-point Likert scale anchored by “like very much” and “dislike very much”), using the response option “Dislike very much” as the reference level.
The predicted probability, or, the probability of having the outcome (i.e., program influences) at different levels (i.e., different preference levels) was calculated based on the obtained odds (probability = odds /[1 + odds]). Herein, the predicted probability of students with different program preferences being influenced by the program was calculated to help facilitate interpretation of the findings. Effects were considered significant when P <
0.05.
Students’ comments about the program were analyzed via content analysis, an interpretational approach for qualitative data [22]. This data-driven analysis was used to directly identify major themes based on respondents’ expressions without identifying expected outcomes before data collection [22,28].
To ensure inter-rater reliability and develop preliminary pilot- coding templates, an initial sample of 100 comments was analyzed independently by two researchers. These sets of codes were compared and discussed by the researchers to generate a final coding scheme. The remaining comments were coded and quantified into key themes using the established codebook.
Analyses were performed using NVivo10 [29] and SPSS 22 [30].
RESULTS
Characteristics of the 51 FFVP intervention schools are shown
Dimensions Key themes and subthemes Selected quotations n (%)1) FFVP Perceptions: Like
Like FFVP but gave no reason I enjoy the fresh fruit and vegetable program. 601 (15.8)
Like the general program I really like it because I have tried new things that I didn't even know that you could even eat.
507 (13.3) Like the positive influences brought by
program
Fruits and vegetables program helps me make healthy choice. 444 (11.6)
Perceptions: Dislike
Dislike but gave no reason I do not like it. 44 (1.2)
Recommendation
Serve more often I would like to get it every day of the week. 74 (1.9)
Ask what kids want I think you should ask us what we want to eat. 14 (0.4)
Fruit Perceptions: Like
Like fruit but gave no reason I like the fruit we get. 238 (6.2)
Like the types of fruit served in FFVP I like banana, apple, grapes, orange, blueberry, and blackberry. 216 (5.7) Like the flavor of fruit I love your fruits because they are juicy, sweet, and delicious. 71 (1.9) Like the positive benefits of eating fruit
served in FFVP When I eat fruit it gives me more energy. 34 (0.9)
Perceptions: Dislike
Dislike the quality of served fruit One time I bit into an apple and it was mushy and it had brown stuff in every bite. 35 (0.9) Dislike the types of fruit served I really don't like the watermelon and grapefruit. 22 (0.6)
Dislike but gave no reason I just plane hate fruit. 10 (0.3)
Recommendation
Serve more fruit or serve more variety I think that we should have new fruits instead of having the same things over and over again.
674 (17.7)
Serve fruit with better quality I would like it if the bananas were more ripe. 40 (1.0) Vegetables Perceptions: Like
Like vegetables but gave no reason I love veggies. 63 (1.7)
Like the types of vegetables served in FFVP I love to eat broccoli, carrots, and squash. 34 (0.9) Like the positive benefits of eating
vegetables served in FFVP
I like the vegetable because they are healthy for your lung and help you get better and active on your reading.
16 (0.4)
Perceptions: Dislike
Dislike but gave no reason I hate vegetables. 103 (2.7)
Dislike the flavor of served vegetables I don't like the fresh vegetables they serve because they are nasty and gross. 76 (2.0) Dislike the types of vegetables served I didn’t really like the cauliflower, broccoli, and peas. 40 (1.0) Recommendation
Serve dipping sauce or cooked vegetables I think we should have ranch with the vegetables. 93 (2.4)
Serve more variety of vegetables I'd like to try more types of veggies. 83 (2.2)
Serve fewer vegetables I think there should be fewer broccoli, cauliflower, and tomatoes. 65 (1.7)
Serve vegetables with better quality Make sure all vegetables are fresh. 19 (0.5)
Miscellaneous Unrelated comments I love these hamburgers and fries. 195 (5.1)
1)n = numbers of comments (total comments = 3,811), % = the percentage of total comments.
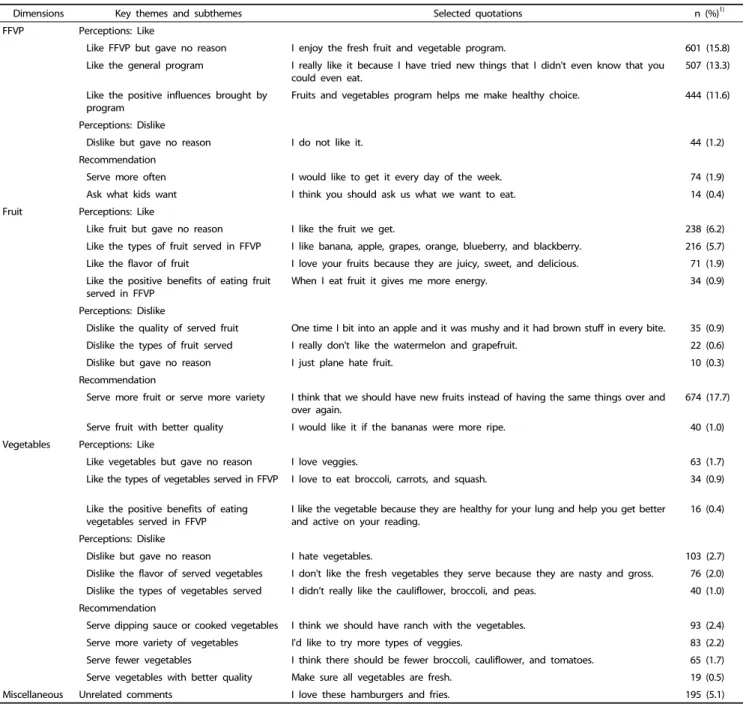
Table 3. Key themes identified to the open-ended survey item to understand students’ comments about FFVP
in Table 1. The FFVP schools were primarily located in city (54.9%) and suburb areas (21.6%). Most schools had high levels of students eligible for free- or reduced-price school meals (84.1% on average). Self-reported demographics of the 5,265 students are also shown in Table 1. There were more student participants in the fourth (39.7%) and fifth (41.6%) grades than in sixth (18.6%) grade. The largest ethnic categories were White (40.7%) and non-Hispanic (71.4%). About 31.5% of students reported other for race.
Many students reported that they ate more fruit in school (81.6%) and outside of schools (70.4%) due to the FFVP. Fewer, though still many students, reported that FFVP influenced them
to eat more vegetables in school (64.1%) and outside of school (47.1%). The percentage of students who reported that they liked the program very much, liked the program, felt just OK about the program, disliked the program, or disliked the program very much after the intervention were 46.5%, 20.1%, 27.6%, 2.4%, and 3.4%, respectively. There were significant positive associations between the program influence and student level of preference for the program (Table 2). There was a higher probability for students to be influenced by the program, that is, to eat more fruit or vegetables in or outside of schools, if they gave the program a higher rating (i.e., liked the program more, Table 2). Students who liked the program very much were
3.57 times more likely (P < 0.01) to eat fruit in school (predicted probability: 87.1%-like very much; 65.4%-dislike very much) than those who disliked the program. Those who liked the program were 2.69 times more likely (P < 0.01) to eat fruit in school (predicted probability: 83.6%-like; 65.4%-dislike very much) due to the program. The same results were observed for other self-reported behavioral changes (i.e., fruit intake outside of school, vegetable intake either inside or outside of school).
Responses to the open-ended item reported by 3,193 of the 5,265 students were subjected to qualitative analysis. Key themes that emerged were organized under four dimensions, including general comments about the program (44.2%), comments specific to fruit served in FFVP (35.2%), comments specific to vegetables served in FFVP (15.5%), and miscellaneous comments that were unrelated to the program (5.1%). The key themes identified within each dimension are presented with each theme sorted in order of decreasing frequency (Table 3).
General comments about the FFVP
Overall perceptions of the FFVP were positive. Some students stated that they liked the program because it allowed them to be exposed to a variety of different kinds of foods that they had never eaten before (13.3% of comments). Some students noted the positive effects of the program (11.7%), indicating that it made them feel good, that they would be healthier, and that it made them think about what they should eat for their own health. Others said that they liked the program but gave no reason (15.8%). A smaller group of comments suggested that FFVP should be offered more often (1.9%). They would like the snacks to be served more frequently in one day, in the morning and afternoon, or to be offered every day or at least more than once a week. A small percentage of students reported that they would like to be asked about what they wanted to eat in the program (0.4%). Based on students’ comments, a small percentage of students appeared to dislike the program (1.2%).
Student comments about the fruit served in FFVP
The most frequent comments about fruit served in the FFVP were related to perception of “liking” the fruit (15.0% of the comments) and students’ recommendations for improvements to fruit offerings in the program (18.7%). Since most of the comments related to fruit were positive, this suggested that overall the students liked the fruit served in FFVP. Students mentioned that the FFVP provided certain types of fruit they liked (5.7%) and specified types, including, strawberry, apple, grape, banana, watermelon, pineapple, mango, and kiwi. Students reported that liked the fruit primarily based on flavor (1.9%).
They used terms like “juicy,” “delicious,” “sweet,” “fresh,” and
“tasted good.” A smaller portion of student comments indicated that they liked fruit because of the benefits of eating them (0.9%). Students said that having fruit served in the program as a snack helped them “feel full,” that fruit made them
“healthier and stronger,” and from fruit they “get more energy.”
Some students reported that they liked the program but gave no reason (6.2%). Students’ recommendations implied that they would like to have more fruit served in the FFVP in both quantity and variety (17.7%), which also reflected how much they liked the fruit.
About 1% of the comments indicated that students wanted to be served fruit that was of better quality. A small percentage of comments revealed that some did not like the fruit served in the program (1.8%). They were concerned with poor quality such as the “mushy” or “moldy” fruit that made them feel
“uncomfortable” and “gross” (0.9%). Comments reported they did not like specific types of fruit served in the program such as “star fruit” or “grapefruit” (0.6%). About 0.3% of the comments expressed dislike of fruit and gave no reason.
Students’ comments about vegetables served in FFVP
Nearly 1.6% of all comments reported by students pertained to why they liked the vegetables in the program. Students liked the specific types of vegetables served in FFVP (0.9% of comments) including carrots, broccoli, corn, potatoes, lettuce, jicama, and cucumbers. Except for broccoli, these can all be considered mild-flavored vegetables. Some students reported that the vegetables were healthy for their bodies (0.7%).
Students also said that they liked the vegetables in the program but gave no reason (1.7%). Other comments (3.0%) explained why students did not like the vegetables in the program. The major reason (2.0%) reported was that they did not like the flavor and thought the vegetables tasted “weird,” “bad,” “gross,”
“nasty,” “yucky,” and even “disgusting.” Students also indicated their dislike for certain types of vegetables (1.0%) such as, Brussels sprouts, green peppers, celery, mushrooms, and peas. Some students who reported that they disliked vegetables in FFVP but gave no reason (2.7%). The most common suggestions (2.4%) to improve acceptance of vegetables were to serve dipping sauces such as “ranch,” “salad dressing,” “peanut butter,” or
“cheese dip” along with the raw vegetables or to serve cooked vegetables. Additionally, students suggested that they be served a greater variety of vegetables (2.2%). Others suggested the program should serve fewer vegetables (1.7%). Serving better quality vegetables was also mentioned (0.5%) by some students.
DISCUSSION
These data indirectly suggest that FFVP may have positive influences because almost 50% of students reported the program increased their fruit and vegetable intake either inside or outside of school. In addition, about two-thirds of the students reported that they liked the program or very much liked the program. Despite changes brought about by FFVP, according to students’ responses, there is still room for improvement.
The influence of the program on students' self-reported fruit and vegetable intake is strongly and positively associated with their degree of “liking” the program. If students’ satisfaction with the program can be increased (i.e., from "just OK", "dislike", and "dislike very much" to "like" or "like very much"), the program may be more influential. Students' satisfaction with the program may be increased by modifying FFVP, guided, when possible, by the perceptions and recommendations provided by students.
Based on these qualitative results, students generally liked the fruit served in the program and have been trying new foods.
These findings are consistent with previous evaluations of other
FFVP programs [9,15-18,31,32]. More importantly, in their responses to the open-ended item, students gave reasons why they did not like the vegetables served in the FFVP, which could explain why they suggested that the program should serve fewer vegetables; these responses also provided useful sugges- tions to help improve acceptance of vegetables via the distribu- tion program. Previous studies of the FFVP found vegetable intake behaviors to be difficult to change and were a barrier to overall program success [16,20,21]. To increase students’
willingness to try them, the appeal of vegetables should be improved by providing healthy dipping sauces, serving cooked vegetables more frequently, or introducing a wider variety of mild-flavored vegetables.
This evaluation makes several contributions. It is the first to examine students’ perceptions of and recommendations for the FFVP using open-ended survey responses from a large represen- tative sample. This makes the findings generalizable to children from lower socio-economic level in all Indiana schools receiving FFVP awards. Also, the sample size and the number of responses to the open-ended survey item were sufficient enough to assume that most of the perceptions that might be important have been measured.
A limitation of this study is the use of the secondary dataset.
The data had been previously collected so the items on the instrument were fixed for measurement, and the data collection procedures could not be controlled. For this evaluation, responses to students’ self-reported behavioral change addressing program effects could only be used to roughly estimate the students’
views of the program’s influence on fruit and vegetable intake at school or outside of school, and could not quantitatively verify actual changes in fruit and vegetable consumption. Our next step is to examine whether the self-reported program effect is related to actual performance of the program. Also, a single open-ended item was used to elicit student comments about the program, which limited understanding of the students’
perceptions of the FFVP. For example, 6.2% of students’
comments indicated that they liked the fruit served but gave no reasons why. If students’ responses were collected via individual or focus group interviews, students could be prompted to elaborate on their responses, though this would be extremely time-consuming and not cost-effective with such a large population.
The degree that students liked the fruit and vegetable distribution program may be an important predictor of the program’s ability to influence fruit and vegetable intake of students, both in and out of school. FFVP may be perceived as more acceptable to students by retaining the components and methods that students liked while modifying parts of the program that students were not satisfied with, and incorpo- rating their suggestions. Program administrators should provide a greater variety of fruit and vegetables and employ strategies that will ensure palatability of the foods (e.g., provide high quality produce, provide healthy dipping sauces, or cook vegetables to improve texture). The information gained from this study should be shared with other health promotion practitioners who work with similar free food distribution program in schools, these practices may improve program efficacy. Limited grant monies force program implementers to plan the program
offerings carefully. However, more flexibility in program regula- tions may be needed so that administrators can incorporate selected student recommendations to create a better environ- ment to improve fruit- and vegetable-eating behaviors in the school setting.
ACKNOWLEDGMENTS
We thank Elizabeth B. Foland, M.S., R.D., from the Indiana Department of Education for collecting and providing the data from the Indiana FFVP Student Survey.
REFERENCES
1. Krebs-Smith SM, Guenther PM, Subar AF, Kirkpatrick SI, Dodd KW.
Americans do not meet federal dietary recommendations. J Nutr 2010;140:1832-8.
2. National Cancer Institute (US). Usual dietary intakes: food intakes, US Population, 2007-10 [Internet]. Rockville (MA): National Cancer Institute; 2014 [cited 2016 January 3]. Available from: http://applie dresearch.cancer.gov/diet/usualintakes/pop/2007-10/.
3. Lorson BA, Melgar-Quinonez HR, Taylor CA. Correlates of fruit and vegetable intakes in US children. J Am Diet Assoc 2009;109:474-8.
4. Evans CE, Christian MS, Cleghorn CL, Greenwood DC, Cade JE.
Systematic review and meta-analysis of school-based interventions to improve daily fruit and vegetable intake in children aged 5 to 12 y. Am J Clin Nutr 2012;96:889-901.
5. French SA, Stables G. Environmental interventions to promote vegetable and fruit consumption among youth in school settings.
Prev Med 2003;37:593-610.
6. Delgado-Noguera M, Tort S, Martínez-Zapata MJ, Bonfill X. Primary school interventions to promote fruit and vegetable consumption:
a systematic review and meta-analysis. Prev Med 2011;53:3-9.
7. Bartlett S, Olsho L, Klerman J, Patlan KL, Blocklin M, Connor P.
Evaluation of the Fresh Fruit and Vegetable Program (FFVP): Final Evaluation Report. Alexandria (VA): U.S. Department of Agriculture, Food and Nutrition Service; 2013.
8. Bere E, Veierød MB, Skare Ø, Klepp KI. Free School Fruit--sustained effect three years later. Int J Behav Nutr Phys Act 2007;4:5.
9. Buzby JC, Guthrie JF, Kantor LS. Evaluation of the USDA fruit and vegetable pilot program: report to congress [Internet]. Washington, D.C.: U.S. Department of Agriculture, Economic Research Service;
2003 [cited 2016 January 3]. Available from: http://www.fns.usda.
gov/sites/default/files/FV030063.pdf.
10. Olsho LE, Klerman JA, Ritchie L, Wakimoto P, Webb KL, Bartlett S.
Increasing child fruit and vegetable intake: findings from the US Department of Agriculture Fresh Fruit and Vegetable Program. J Acad Nutr Diet 2015;115:1283-90.
11. Tak NI, Te Velde SJ, Singh AS, Brug J. The effects of a fruit and vegetable promotion intervention on unhealthy snacks during mid-morning school breaks: results of the Dutch Schoolgruiten Project. J Hum Nutr Diet 2010;23:609-15.
12. U.S. Department of Agriculture, Food and Nutrition Service. Fresh Fruit and Vegetable Program: a handbook for schools [Internet].
Washington, D.C.: U.S. Department of Agriculture, Food and Nutrition Service; 2010 [cited 2016 January 3]. Available from:
http://www.fns.usda.gov/sites/default/files/handbook.pdf.
13. Hayes D, Berdan G. School nutrition programs: challenges and
opportunities. Am J Lifestyle Med 2013;7:330-40.
14. Ohri-Vachaspati P, Turner L, Chaloupka FJ. Fresh Fruit and Vegetable Program participation in elementary schools in the United States and availability of fruits and vegetables in school lunch meals. J Acad Nutr Diet 2012;112:921-6.
15. Lin YC, Foland E, Bai Y, Fly AD. Indiana students in the 2010-11 USDA Fresh Fruit and Vegetable Program (FFVP) increased variety of fruits and vegetables consumed and requests to parents to purchase fruits and vegetables through mediating changes in intention and attitude. FASEB J 2013;27:626.7.
16. Coyle KK, Potter S, Schneider D, May G, Robin LE, Seymour J, Debrot K. Distributing free fresh fruit and vegetables at school: results of a pilot outcome evaluation. Public Health Rep 2009.124:660-9.
17. Jamelske EM, Bica LA. Impact of the USDA Fresh Fruit and Vegetable Program on children's consumption. J Child Nutr Manag 2012;36.
18. Bica LA, Jamelske EM. USDA Fresh Fruit and Vegetable Program creates positive change in children's consumption and other behaviors related to eating fruit and vegetables. J Child Nutr Manag 2012;36.
19. Jamelske E, Bica LA, McCarty DJ, Meinen A. Preliminary findings from an evaluation of the USDA Fresh Fruit and Vegetable Program in Wisconsin schools. WMJ 2008.107:225-30.
20. Shertzer JA. Introducing children to fresh fruits and vegetables in the classroom: Identifying features that may affect outcomes of the USDA Fresh Fruit and Vegetable Program (FFVP). Ann Arbor (MI):
ProQuest LLC; 2008.
21. Huang L, Lin YC, Foland E, Bai Y, Liu Y, Fly AD. 2010-2011 USDA fresh fruit and vegetable program (FFVP) improved Indiana elementary students' consumption of fruit. FASEB J 2013;27:1063.5.
22. Hsieh HF, Shannon SE. Three approaches to qualitative content analysis. Qual Health Res 2005;15:1277-88.
23. Swift JA, Tischler V. Qualitative research in nutrition and dietetics:
getting started. J Hum Nutr Diet 2010;23:559-66.
24. Jenkins KR, Fakhoury N, Marzec ML, Harlow-Rosentraub KS. Percep- tions of a culture of health: implications for communications and programming. Health Promot Pract 2015;16:796-804.
25. Erickson PI, Kaplan CP. Maximizing qualitative responses about smoking in structured interviews. Qual Health Res 2000;10:829-40.
26. Mossholder KW, Settoon RP, Harris SG, Armenakis AA. Measuring emotion in open-ended survey responses: an application of textual data analysis. J Manage 1995;21:335-55.
27. Indiana Department of Education. COMPASS: school and corporation data [Internet]. Indianapolis (IN): Indiana Department of Education;
[cited 2015 June 25]. Available from: http://compass.doe.in.gov/
dashboard/overview.aspx.
28. Kondracki NL, Wellman NS, Amundson DR. Content analysis: review of methods and their applications in nutrition education. J Nutr Educ Behav 2002;34:224-30.
29. QSR International Pty Ltd. Qualitative data analysis software NVivo 10 [Computer software] [Internet]. [place unknown]: QSR Interna- tional Pty Ltd; 2012 [cited 2015 July 19]. Available from: http://
www.qsrinternational.com/products_nvivo.aspx.
30. IBM. SPSS statistics 22.0 [Computer software] [Internet]. [place unknown]: IBM; 2013 [cited 2015 July 19]. Available from: http://
www-01.ibm.com/support/docview.wss?uid=swg21646821.
31. Potter SC, Schneider D, Coyle KK, May G, Robin L, Seymour J. What works? Process evaluation of a school-based fruit and vegetable distribution program in Mississippi. J Sch Health 2011;81:202-11.
32. Bai Y, Feldman C, Wunderlich SM, Aletras SC. Process evaluation of the Fresh Fruit and Vegetable Program implementation in a New Jersey elementary school. J Child Nutr Manag 2011;35.