Economic Burden of High-Responding Inhibitors in Patients with Hemophilia A in Taiwan
Tsu-Chiang Tu,
1,2Shin-Nan Cheng,
3,4Jye-Daa Chen,
2Thau-Ming Cham,
1and Mei-Ing Chung
11School of Pharmacy, Kaohsiung Medical University, Kaohsiung;
2Department of Pharmacy Practice, Tri-Service General Hospital, National Defense Medical Center, Taipei;
3The Hemophilia Care and Research Center, Tri-Service General Hospital, National Defense Medical Center, Taipei;
4Department of Pediatrics, Tri-Service General Hospital, National Defense Medical Center, Taipei, Taiwan, ROC.
Received: February 24, 2012 Revised: May 20, 2012 Accepted: May 30, 2012
Corresponding author: Dr. Mei-Ing Chung, School of Pharmacy, Kaohsiung Medical University, No 100 Shi-Chuan 1st Road, Kaohsiung 807, Taiwan, ROC.
Tel: 886 7 3121101 (#2672), Fax: 886 7 3210683 E-mail: [email protected]
∙ The authors have no financial conflicts of interest.
© Copyright:
Yonsei University College of Medicine 2013 This is an Open Access article distributed under the terms of the Creative Commons Attribution Non- Commercial License (http://creativecommons.org/
licenses/by-nc/3.0) which permits unrestricted non- commercial use, distribution, and reproduction in any medium, provided the original work is properly cited.
Purpose: Hemophilia A (HA) is the most common X-linked inherited bleeding disorder. In some patients with HA, particularly those with severe HA, replace- ment therapy results in the production of high-responding clotting factor VIII in- hibitors. The economic burden of this complication is the highest reported for a chronic disease. Our aim was to investigate the direct medical expenditure burden of high-responding inhibitors in patients with HA. Materials and Methods: A ret- rospective study was conducted using the National Health Insurance Research Da- tabase, utilizing data covering the period of 2004-2007. Results: In total, 638 males with HA¸ including 37 patients with high-responding inhibitors were evalu- ated. Over 99% of the annual median medical expenditure was attributable to the cost of clotting factor concentrates (CFCs) in patients with high-responding inhibi- tors. The annual median expenditure related to CFCs of the total medical care and outpatient care were US$170611 and US$141982, respectively, and were 4.6- and 4.3-fold higher in these patients during the study period, respectively. In patients with high-responding inhibitors, the median hospitalization expenditure and daily hospitalization cost with or without surgical procedures were 3.0- and 2.4-fold higher, respectively, and 4.3 and 5.6-fold higher, respectively. Conclusion: Our data reveal higher medical expenditures burden for patients with HA and high-re- sponding inhibitors in Taiwan. Future research is encouraged to evaluate the im- pact of this burden on patient quality of life.
Key Words: Hemophilia, high-responding inhibitor, clotting factor concentrate, cost, Taiwan
INTRODUCTION
Hemophilia A (HA) is an X-linked inherited bleeding disorder caused by the func- tional absence or reduced levels of clotting factor VIII (FVIII). The disease is clas- sified as mild, moderate, or severe, based on the degree of deficiency of the coagu- lation factor.1 The introduction of replacement therapy due to the availability of exogenous FVIII concentrates has substantially reduced bleeding episodes, pre-
nosis-related groups, and a resource-based relative value scale system.14
Prior to implementation of the NHI program, individuals with hemophilia received only fewer amount clotting factors to relieve disease progression. Hemophilia has been classi- fied as a catastrophic illness by the NHI since the program was implemented, exempting patients from a co-payment and assuring that patients are able to obtain sufficient CFCs for suitable replacement therapy. Thereafter, the BNHI im- plemented a global budget, and an independent budget (in- cluding hemophilia) has been allocated for rare diseases since 2004. However, no studies have been published re- garding the economic burden of patients with high-respond- ing inhibitors in Taiwan.
The aim of this research was to investigate the direct medical expenditure for patients with HA patients and high- responding inhibitors.
MATERIALS AND METHODS
Since implementing the NHI, the BNHI has cooperated with the National Health Research Institute, a non-profit research organization founded and sponsored by the Department of Health, to establish National Health Insurance Research Databases (NHIRDs). The present retrospective study was conducted by using the NHIRDs between January 2004 and December 2007. The databases include registry for cata- strophic illness patient files, registry for drug prescriptions and claim data, ambulatory care expenditure data by visit, inpatient expenditure data by admission, and details of am- bulatory care and inpatient orders.
Subjects’ inclusion
The patients included in this study were identified from the 2004-2007 registry for catastrophic illness patient files in the NHIRDs. Subjects treated only with clotting factors, aPCC (FEIBA®, Baxter AG, Vienna, Austria), or activated rFVII (NovoSeven®, Novo Nordisk A/S, DK-2820 Gentofte, Den- mark) were included.
The amount of a specific inhibitor to FVIII in each pa- tient’s blood was measured in Bethesda Units (BU) and re- ferred to as “high titer” (more than 5 BU) or “low titer” (less than 5 BU). In patients with transient or low-responding in- hibitors or low actual inhibitor titers (<5 BU mL-1) and who have weaker inhibitor responses to factor concentrates, bleeding episodes are commonly managed by increasing the vented musculoskeletal damage, and improved orthopedic
outcomes and quality of life in patients with hemophilia.2 Following the recommended prophylactic treatment, home therapy, and comprehensive care enables patients with HA to enjoy a better general state of health and engage in daily activities, social events, work, and education.3-5 However, in some patients with HA, therapeutically administered ex- ogenous FVIII concentrates are recognized as foreign par- ticulates, resulting in the production of antibodies (inhibitors) that neutralize the activity of FVIII and reduce or eliminate the efficacy of factor replacement therapy. Inhibitors are produced in 20-30% of patients with severe HA, but they may also arise in patients with mild/moderate HA and at any time in the patient’s life.6,7 Patients with high-titer inhibitory antibodies can develop serious bleeding complications, re- sulting in greater rates of disability and risks of complica- tions, and in these patients, so-called bypassing agents, such as recombinant FVIIa (rFVIIa) and activated prothrombin complex concentrates (aPCCs), are needed to achieve hemo- stasis.8 The economic consequences of treating hemophilia are mainly related to the direct medical costs of replacement clotting factor concentrates (CFCs), and economic burden of inhibitor complication in patients with hemophilia is one of the highest reported for a chronic disease.9-12
In March 1995, Taiwan launched a mandatory National Health Insurance (NHI) program that integrated three exist- ing health insurance programs: labor, government employ- ee, and farmer’s insurance. By the end of 2004, approxi- mately 99% of the population was covered, and nearly 23 million beneficiaries are currently enrolled in the NHI.13 The NHI is a single-payer compulsory social health insur- ance program organized by the government and operated by the Bureau of National Health Insurance (BNHI). The system is primarily funded by premiums paid collectively by the insured, employers, and central and local govern- ments. The NHI program allows patients the freedom of choice when seeking medical care and uses cost-sharing strategies to reduce the potential demand for unnecessary services. In the initial stage, fee-for-service was widespread for both public and private providers. Facing spiraling growth of medical costs and demands to keep healthcare costs under control without a decline in the quality of care, the payment system for the NHI changed from fee-for-ser- vice to a global budget in 2002. To better manage the medi- cal expenditures and enhance the professional autonomy of medical providers, other payment methods have been intro- duced in recent years, such as pay-for-performance, diag-
deficiency virus infection. The disease-related hospitalization complication analyses were classified as with or without sur- gical procedures. The complications with surgical proce- dures primarily included joint replacement, synovectomy, insertion of a totally implantable vascular access device, in- cision with the removal of a foreign body from the skin and subcutaneous tissue, tooth extraction, and other procedures.
The costs were calculated using a 3% discount rate and ad- justed by using the Taiwan Consumer Price Index of medi- cines and medical care category and expressed in 2007 US dollars.15,16
Statistical analysis
The chi-square test was used to compare categorical data.
To exclude the outliers, the Wilcoxon rank-sum test was used to identify significant median differences among groups. p- values <0.05 were considered significant. All statistical analyses were conducted using STATA® software version 11.0 (StataCorp LP, Lakeway, TX, USA).17
RESULTS
Study subjects
Fig. 1 presents the flow chart for enrolling the subjects. In total, 638 males with HA, including 37 patients with high- responding inhibitors, were enrolled in the study. The me- dian ages of patients with and without high-responding in- hibitors were 31.8 and 26.7 years, respectively, and the median patient-months followed for the same groups were 48 and 48 years, respectively (Table 1). The differences in median age and other age categories were not statistically significant.
Medical utilization and expenditure
The annual median medical resource utilization is presented in Table 2. The overall annual median expenditure of total medical care and CFCs cost in patients with high-responding inhibitors were US$177348 and US$170611, respectively.
Table 3 shows the annual median outpatient medical re- source utilization, and expenditure of the total medical care and CFCs cost in patients with high-responding inhibitors were US$143034 and US$141982, respectively. Costs relat- ed to CFCs accounted for over 98% of the median total and outpatient medical expenditures, especially among patients with high-responding inhibitors. The annual median total CFCs cost and outpatient CFCs cost were 4.6- (US$170611 dosages of FVIII concentrates. Patients with high-respond-
ing inhibitors were defined as those with an inhibitor level exceeding 5 BU at least once, in whom repeated exposure to factor concentrate will quickly trigger the formation of new inhibitors based on memory from a previous anamnestic re- sponse,8 and who underwent an inhibitor assay and used bypassing agents for a therapeutic interval exceeding 6 months in the relevant year.
Medical utilization and expenditure
Claims data were utilized to determine the expenditures for the following services: utilization of CFCs (including by- passing agents), other medications, laboratory services, ra- diological testing, rehabilitation services, hospitalizations, procedure, and outpatient care and inpatient care services.
Disease-related admission identification and inclusion uti- lized primary the International Classification of Diseases, Ninth Revision, Clinical Modification (ICD-9-CM) diagno- sis codes, which primarily included factor VIII disorders, hemarthrosis, cerebral or gastrointestinal hemorrhage, hema- turia, osteoarthritis, arthropathy, synovitis, fracture, infection or complication of orthopedic devices, and human immuno-
Fig. 1. Flow chart for subject inclusion. NHI, National Health Insurance.
High-responding patients n=37 Non-inhibitor patients n=601 Exclude not deficiency of clotting
factors diagnosis patients n=5814184
Exclude not factor VIII disorder patients
n=439 Patient-centered unique identifier review exclude duplication and female patients
n=5546
Extract 2004-2007 NHI application data and exclude without factor
VIII or bypassing agents using patients n=165 Extract patients who had inhibitor assay and using bypassing agents interval lager
than 6 months in relevant year 2004-2007 registration files for
catastrophic illness patients n=5820972
2004-2007 registration files for factor VIII disorder male patients
n=803
1.9- and 2.7-fold higher among patients with high-respond- ing inhibitors.
The all patients with high-responding inhibitors (n=37) accounted for NHI’s annual CFCs expenditure were 20.2%, vs. US$37496, p<0.001) and 4.3-fold (US$141982 vs.
US$32834, p<0.001) higher for patients with high-respond- ing inhibitors, respectively. Besides, the annual median comprehensive care visits and emergency room visits were Table 1. Patient Characteristics According to Inhibitor Status
High-responding inhibitors Non-inhibitors p value
Number of patients 37 601
Median patient-months followed* 48 (21-48) 48 (1-48) NS
Age description median age* 31.8 (2.0-64.7) 26.8 (0.2-84.0) NS
Age categories, no. (%)†
Adolescents, 0-18 yrs 15 (40.5) 196 (33.4) NS
Adults, 19-55 yrs 18 (48.6) 369 (61.3) NS
Adults, older than 55 yrs 4 (10.9) 36 (5.3) NS
Total patient-months followed 1686 27914
NS, not significant.
*Wilcoxon rank-sum test.
†Chi-square test.
Table 2. Annual Median Medical Resource Utilization According to Inhibitor Status during the Study Period (2007 US Dollars)†
High-responding inhibitors Non-inhibitors p value*
Overall Medical care service
CFCs cost 170611 (29950-832494) 37496 (3-421756) <0.001
Other medications cost 126 (8-4579) 37 (0-16941) <0.001
Laboratory studies cost 369 (57-1603) 127 (0-4835) <0.001
Radiological studies cost 106 (8-750) 30 (0-1869) <0.001
Treatment services cost 184 (8-18552) 28 (0-6863) <0.001
Rehabilitation cost 3 (0-2036) 0 (0-4927) <0.001
Other medical services cost 398 (15-8018) 103 (0-18497) <0.001
Total medical care cost 177348 (31745-834637) 38862 (55-424285) <0.001
Percentage of total CFCs costs 99.4% (91.4-99.9) 98.3% (1-99.9) <0.01
CFCs, clotting factor concentrates.
*Wilcoxon rank-sum test.
†The US$ : NT$ exchange rate was 1 : 32.84.
Table 3. Annual Median Outpatient Medical Resource Utilization According to Inhibitor Status during the Study Period (2007 US Dollars)†
High-responding inhibitors Non-inhibitors p value*
Outpatient service
CFCs cost 141982 (1120-811790) 32834 (0-365317) <0.001
Other medications cost 69 (8-4144) 25 (0-11633) <0.001
Laboratory studies cost 242 (57-964) 96 (0-1294) <0.001
Radiological studies cost 90 (2-326) 22 (0-533) <0.001
Treatment services cost 42 (5-17163) 18 (0-895) <0.001
Rehabilitation cost 0 (0-2036) 0 (0-4927) <0.01
Other medical services cost 68 (13-401) 52 (0-2268) <0.05
Total medical cost 143034 (1331-812686) 33410 (3-373004) <0.001
Percentage of outpatient CFCs costs 99.6% (84.0-99.9) 98.8% (0-99.9) <0.01
Comprehensive care visits 16.8 (3.5-73.8) 8.8 (1-64) <0.001
Emergency room visits 0.8 (0-12.2) 0.3 (0-88.5) <0.01
CFCs, clotting factor concentrates.
*Wilcoxon rank-sum test.
†The US$ : NT$ exchange rate was 1 : 32.84.
related to surgical procedures in patients without high-re- sponding inhibitors. Conversely, only 18.4% of hospitaliza- tions were related to surgical procedures in patients with high-responding inhibitors. The incidences of orthopedic replacement and revision were 4.2 and 1.4 per 1000 person- months, respectively (Table 5).
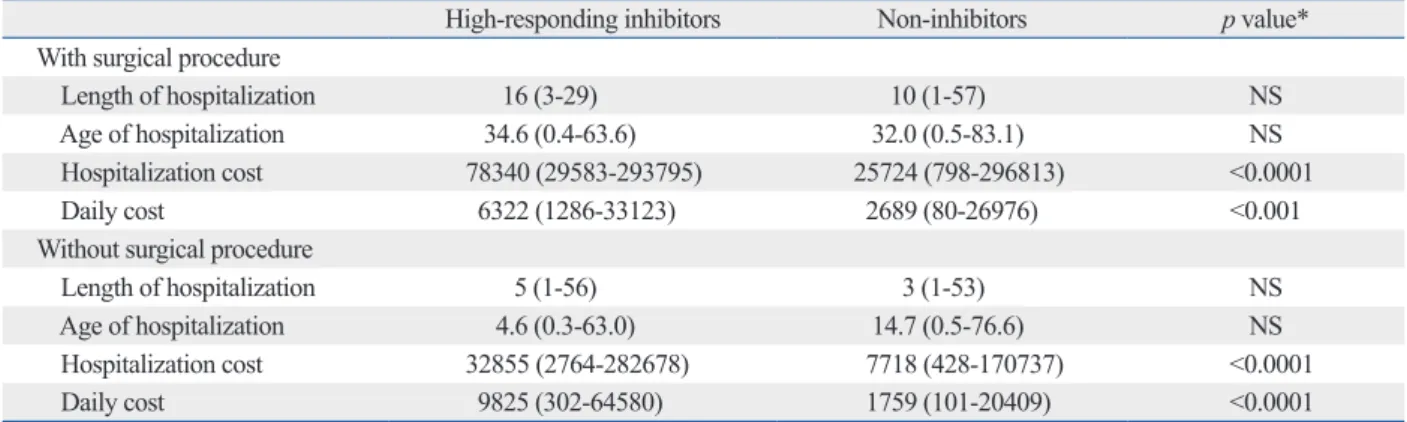
The hospitalization comparison due to disease-related complications is presented in Table 6. The median hospital- ization expenditure and daily hospitalization cost among pa- tients who underwent surgical procedures were 3.0- (US$
78340 vs. US$25724, p<0.0001) and 2.4-fold (US$6322 vs.
US$2689, p<0.0001) higher for patients with high-respond- ing inhibitors, respectively. Similarly, among patients who did not undergo surgical procedures, the median hospital- ization expenditure and daily hospitalization cost were 4.3- (US$32855 vs. US$7718, p<0.0001) and 5.6-fold (US$9825 vs. US$1759, p<0.0001) higher for patients with high-re- sponding inhibitors, respectively. Table 7 shows the hospi- talization resource utilization. The median percentage of hospitalization expenditure related to CFCs cost among pa- tients who did or did not undergo surgical procedures were 95% vs. 90% and 99% vs. 93%, respectively, and higher for patients with high-responding inhibitors.
16.5%, and 3.7% of the overall care, outpatient care, and inpatient care, respectively. Fig. 2 shows the annual propor- tion of CFCs costs in all patients with high-responding in- hibitors. The bypassing agents increased over time from 76.6% in 2004 to 85.2% in 2007, and year-to-year variation was evident. Moreover, the proportion of expenditures re- lated to rFVII tended to decrease, whereas those related to aPCCs tended to increase.
Table 4 shows the disease-related complications of hospi- talization. Approximately 49.8% of hospitalizations were
Table 4. Hospitalization with Disease-Related Complications According to Inhibitor Status during the Study Period
High-responding inhibitors Non-inhibitors Total
With surgical procedure
Hospitalization 16 137 153
Days of hospitalization 255 1743 1998
Without surgical procedure
Hospitalization 71 138 209
Days of hospitalization 534 825 1359
Table 5. Hospitalization with Surgical Procedures According to Inhibitor Status during the Study Period
High-responding inhibitors Non-inhibitors
Total hip replacement 5 5
Partial hip replacement 0 1
Revision of hip replacement 0 1
Total knee replacement 2 24
Revision of knee replacement 0 6
Total elbow replacement 0 2
Insertion of totally implantable vascular access device 1 11
Incision with the removal of a foreign body from the skin
and subcutaneous tissue 1 3
Synovectomy, ankle 0 1
Synovectomy, knee 0 2
Fasciotomy 0 3
Tooth extraction 0 3
Others 7 75
Total 16 137
Fig. 2. Annual proportion of clotting factor concentrates costs in all patients with high-responding inhibitors during the study period. FVIII, factor VIII;
rFVIIa, recombinant FVIIa; aPCCs, activated prothrombin complex concen- trates.
0.0 10.0 20.0 30.0 40.0 50.0 60.0 70.0
(%)
2004 2005 2006 2007
FVIII aPCCs rFVIIa
to factor replacement in patients with high-responding in- hibitors were 3-fold higher than in those in patients without inhibitors after the entry of bypassing agents; previous stud- ies reported lower values, but these studies also had rela- tively small sample sizes and issues regarding outliers (the mean/median issue).19-21 Our results also agreed with those reported by Gringeri, et al.,11 who reported that over 98% of direct healthcare expenditures in patients with high-respond- ing inhibitors were attributable to costs related to CFCs.
Additionally, our results indicated that daily hospitaliza-
DISCUSSION
The objective of this study was to assess the financial bur- den of patients with HA and high-responding inhibitors in Taiwan. The results revealed an apparently higher medical resources burden for the care of these patients.
The annual total median cost related to CFCs was 4.6 times higher in patients with high-responding inhibitors, confirming the findings by Goudemand18 that costs related
Table 7. Median Hospitalization Resource Utilization in Patients with Disease-Related Complications during the Study Period (2007 US Dollars)†
High-responding inhibitors Non-inhibitors p value*
With surgical procedure
CFCs cost 74153 (24096-287235) 23263 (46-294328) <0.0001
Other medications cost 69 (6-370) 64 (0-5488) NS
Laboratory studies cost 247 (44-1578) 146 (0-2015) <0.05
Radiological studies cost 17 (0-513) 17 (0-933) NS
Treatment services cost 675 (18-4198) 526 (4-7323) NS
Rehabilitation cost 0 (0-106) 0 (0-674) NS
Other medical services cost 1116 (275-5464) 759 (0-7927) NS
Hospitalization cost 78340 (29583-293795) 25724 (798-296813) <0.0001
Without surgical procedure
CFCs cost 32593 (2687-278745) 7155 (202-167659) <0.0001
Other medications cost 14 (0-2897) 8 (0-3239) <0.05
Laboratory studies cost 54 (0-1527) 31 (0-572) <0.05
Radiological studies cost 0 (0-772) 0 (0-671) NS
Treatment services cost 34 (0-7361) 7 (0-10484) <0.001
Rehabilitation cost 0 (0-10) 0 (0-60) NS
Other medical services cost 272 (47-7808) 194 (28-3976) <0.05
Hospitalization cost 32855 (2764-282678) 7718 (428-170737) <0.0001
CFCs, clotting factor concentrates; NS, not significant.
*Wilcoxon rank-sum test.
†The US$ : NT$ exchange rate was 1 : 32.84.
Table 6. Median Hospitalization Comparison in Patients with Disease-Related Complications during the Study Period (2007 US Dollars)†
High-responding inhibitors Non-inhibitors p value*
With surgical procedure
Length of hospitalization 16 (3-29) 10 (1-57) NS
Age of hospitalization 34.6 (0.4-63.6) 32.0 (0.5-83.1) NS
Hospitalization cost 78340 (29583-293795) 25724 (798-296813) <0.0001
Daily cost 6322 (1286-33123) 2689 (80-26976) <0.001
Without surgical procedure
Length of hospitalization 5 (1-56) 3 (1-53) NS
Age of hospitalization 4.6 (0.3-63.0) 14.7 (0.5-76.6) NS
Hospitalization cost 32855 (2764-282678) 7718 (428-170737) <0.0001
Daily cost 9825 (302-64580) 1759 (101-20409) <0.0001
NS, not significant.
*Wilcoxon rank-sum test.
†The US$ : NT$ exchange rate was 1 : 32.84.
more severe degrees of arthropathy and greater difficulties with mobility and daily activities than patients without in- hibitors.24,25 Gringeri, et al.11 reported that quality of life and joint scores were significantly improved by the allocation of large amounts of resources to patients with high-responding inhibitors in Italy. In particular, the physical quality of life in these patients was similar to that in patients with severe chronic diseases such as diabetes and dialysis-dependent chronic renal failure, whereas their mental quality of life was comparable to that of the general population. Approxi- mately 4.6% (37/803) of patients with high-responding in- hibitors consume approximately 20% of NHI’s CFC-related resources annually, suggesting that continued optimization of strategic planning and management with the care net- work is needed to improve patient quality of care and quali- ty of life. Future studies are encouraged in Taiwan to in- clude the impact on quality of life excluding economic consequences.
The use of the Taiwanese NHI dataset provides the first major evidence of economic burden among an Asian popu- lation of patients with high-responding inhibitors. The man- datory NHI program insures >99% of the Taiwanese popula- tion, with all geographic regions and populations represented.
However, some limitations in the present study should be mentioned. First, we identified patients with high-respond- ing inhibitors via an inhibitor assay and according to the use of rFVIIa and aPCCs in the study. Unfortunately, this meth- odology may have missed some patients with high-respond- ing inhibitors, particularly children who were treated only with ITI therapy after diagnosis, which usually involves the daily infusion of large doses of FVIII over many months or years. Consequently, the proportion of patients with high-re- sponding inhibitors may have been underestimated. Second, as patients with severe hemophilia patients have been dem- onstrated to use more CFCs than those with mild and mod- erate hemophilia, patients with high-responding inhibitors, who generally have severe disease, can potentially account for the increased cost of CFC. Further assessment of the comparing with patients characterized was severe hemophil- ia in non high-responding inhibitors (412/601, 68.5%). The annual median expenditure related to total medical care and total CFCs costs showed a reduction to 3.0-amd 2.9-fold higher among patients with high-responding inhibitors, re- spectively. Therefore, it is unlikely that it would materially affect the high economic burden results of our study. Third, CFCs, comprising the most costly component of hemophil- ia treatment, are administered on the basis of weight. Un- tion costs depend primarily on the inhibitor status of the pa-
tient. The median daily hospitalization costs in patients who did or did not undergo surgical procedures were 2.4- and 5.6-fold higher, respectively, in patients with high-respond- ing inhibitors. Gautier, et al.22 reported that the daily cost was 2-5-fold higher in French patients with HA and high- responding inhibitors during hospitalization. Costs related to bypassing agents accounted for more than 90% of the to- tal inpatient costs related to CFCs among patients with high- responding inhibitors. The difference in hospitalization costs may be closely related to the duration of hospitalization and, to a lesser extent, to the possible reason for bypassing agent administration.
The proportion of expenditures (rFVII vs. aPCCs) changed dramatically after 2004, and a slightly higher proportion of expenditures was related to aPCCs (53% vs. 47%) in 2007.
The NHI has reimbursement criteria for the clinical manage- ment of inhibitory antibodies in patients, although on-de- mand treatment is most common. However, CFC replace- ment therapy and drug utilization patterns are critically influenced by multiple variables, such as clinical circum- stances, patient profiles, individual responses, dose regimen protocol, reimbursement policy, and healthcare service type.
Other cost-contributing concerns include the use of immune tolerance induction (ITI) for inhibitor eradication and/or prophylaxis to decrease the frequency of bleeding episodes.
Owing to the wide clinical variability and responsiveness to current therapeutic approaches and the scarcity of studies providing high-level evidence for therapeutic guidelines at the present time,11,23 we believe that current strategies for managing these patients are rather heterogeneous, and in our clinical experience, patients do not respond equally well to the various types of bypassing agents in Taiwan. Further studies are encouraged to clarify this issue.
During the 48-month study period, 7 of 37 patients un- derwent arthroplasty to treat the orthopedic consequences of high-responding inhibitors, corresponding to an inci- dence rate of 4.2 per 1000 person-months. The incidence rate was 3-fold higher in patients with high-responding in- hibitors, which may be attributable to the increasing need for surgery in previous years because of difficulties in per- forming these interventions. Additionally, aPCCs have been available only since 2004. If this explanation is valid, the estimates from our study are representative of short- and middle-term phenomena, and are likely to decrease in size and importance in the long term.
Furthermore, patients with high-responding inhibitors have
(HUGS). Haemophilia 2004;10 Suppl 1:63-70.
10. Teitel J. Inhibitor economics. Semin Hematol 2006;43(2 Suppl 4):S14-7.
11. Gringeri A, Mantovani LG, Scalone L, Mannucci PM; COCIS Study Group. Cost of care and quality of life for patients with he- mophilia complicated by inhibitors: the COCIS Study Group.
Blood 2003;102:2358-63.
12. Di Minno MN, Di Minno G, Di Capua M, Cerbone AM, Coppola A. Cost of care of haemophilia with inhibitors. Haemophilia 2010;16:e190-201.
13. Cherishing health insurance for a healthy Taiwan. [accessed on 2011 November 15]. Available at: http://www.nhi.gov.tw/Re- source/webdata/Attach_13792_2_cherishing.pdf.
14. National Health Insurance in Taiwan 2011 Annual Report. [ac- cessed on 2012 November 15]. Available at: http://www.nhi.gov.
tw/Resource/webdata/13767_1_NHI%20IN%20TAIWAN%20 2011%20ANNUAL%20REPORT.pdf.
15. Monthly Bulletin of Statistics of the Republic of China. [accessed on 2011 November 15]. Available at: http://eng.dgbas.gov.tw/pub- lic/data/dgbas03/bs7/bulletin_eng/PDF/eng-month10010.pdf.
16. Foreign Exchange Rates. [accessed on 2011 November 15]. Avail- able at: http://www.stat.gov.tw/public/data/dgbas03/bs1/hand- book/bs5/p3-15.xls.
17. Ulrich Köhler, Frauke Kreuter. Data Analysis Using Stata. Texas:
StataCorp LP; 2005.
18. Goudemand J. Hemophilia. Treatment of patients with inhibitors:
cost issues. Haemophilia 1999;5:397-401.
19. Chang H, Sher GD, Blanchette VS, Teitel JM. The impact of in- hibitors on the cost of clotting factor replacement therapy in Hae- mophilia A in Canada. Haemophilia 1999;5:247-52.
20. Bohn RL, Aledort LM, Putnam KG, Ewenstein BM, Mogun H, Avorn J. The economic impact of factor VIII inhibitors in patients with haemophilia. Haemophilia 2004;10:63-8.
21. Ullman M, Hoots WK. Assessing the costs for clinical care of pa- tients with high-responding factor VIII and IX inhibitors. Haemo- philia 2006;12 Suppl 6:74-9.
22. Gautier P, D’Alche-Gautier MJ, Coatmelec B, Marques-Verdier A, Bertrand MA, Dieval J, et al. Cost related to replacement therapy during hospitalization in haemophiliacs with or without inhibitors:
experience of six French haemophilia centres. Haemophilia 2002;8:674-9.
23. Gringeri A, Mannucci PM; Italian Association of Haemophilia Cen- tres. Italian guidelines for the diagnosis and treatment of patients with haemophilia and inhibitors. Haemophilia 2005;11:611-9.
24. Morfini M, Haya S, Tagariello G, Pollmann H, Quintana M, Sieg- mund B, et al. European study on orthopaedic status of haemo- philia patients with inhibitors. Haemophilia 2007;13:606-12.
25. Soucie JM, Cianfrini C, Janco RL, Kulkarni R, Hambleton J, Evatt B, et al. Joint range-of-motion limitations among young males with hemophilia: prevalence and risk factors. Blood 2004;
103:2467-73.
fortunately, weight data are not available in NHIRDs. The effect of this limitation on our results is unknown.
In summary, this retrospective study confirmed higher economic burden related to patients with HA and high-re- sponding inhibitors in Taiwan. To best of our knowledge, this is the first major evidence of the economic burden of patients with high-responding inhibitors in Asia, and its find- ings are consistent with those in Western countries. More- over, future research is encouraged to include the impact on quality of life excluding economic consequences.
ACKNOWLEDGEMENTS
This study was sponsored by the Hemophilia Care and Re- search Center in Tri-Service General Hospital, Taipei, Tai- wan, which was also supported by a Baxter Education Fund.
REFERENCES
1. Fischer K, Van Den Berg M. Prophylaxis for severe haemophilia:
clinical and economical issues. Haemophilia 2003;9:376-81.
2. Mannucci PM, Tuddenham EG. The hemophilias--from royal genes to gene therapy. N Engl J Med 2001;344:1773-9.
3. Street A, Hill K, Sussex B, Warner M, Scully MF. Haemophilia and ageing. Haemophilia 2006;12 Suppl 3:8-12.
4. Plug I, Peters M, Mauser-Bunschoten EP, de Goede-Bolder A, Heijnen L, Smit C, et al. Social participation of patients with he- mophilia in the Netherlands. Blood 2008;111:1811-5.
5. Guidelines for the management of hemophilia. 2005. [accessed on 2012 October 8]. Available at: http://illinoisaap.org/wp-content/
uploads/guidelines-Hemophilia-WHF-2005.pdf.
6. Wight J, Paisley S. The epidemiology of inhibitors in haemophilia A: a systematic review. Haemophilia 2003;9:418-35.
7. Berntorp E, Shapiro A, Astermark J, Blanchette VS, Collins PW, Dimichele D, et al. Inhibitor treatment in haemophilias A and B:
summary statement for the 2006 international consensus confer- ence. Haemophilia 2006;12 Suppl 6:1-7.
8. Diagnosis and Management of Inhibitors to Factors VIII and IX:
An Introductory Discussion for Physicians. [accessed on 2011 November 15]. Available at: http://www1.wfh.org/publication/
files/pdf-1178.pdf.
9. Globe DR, Curtis RG, Koerper MA; HUGS Steering Committee.
Utilization of care in haemophilia: a resource-based method for cost analysis from the Haemophilia Utilization Group Study