Factors influencing fast food consumption behaviors of middle-school students in Seoul: an application of theory of planned behaviors
Hyun-sun Seo 1 , Soo-Kyung Lee 2§ and Soyoung Nam 2
1
Nutrition education, Graduate School of Education, Inha University, Incheon 402-751, Korea
2
Department of Food and Nutrition, College of Human Ecology, Inha University, Yonghyeon 4-dong, Nam-gu, Incheon 402-751, Korea
Abstract
Fast food is popular among children and adolescents; however, its consumption has often been associated with negative impacts on nutrition and health. This study examined current fast food consumption status among middle school students and explored factors influencing fast food consumption by applying Theory of Planned Behavior. A total of 354 (52.5% boys) students were recruited from a middle school. The subjects completed a pre-tested questionnaire. The average monthly frequency of fast food consumption was 4.05 (4.25 for boys, 3.83 for girls). As expected, fast food consumption was considered to be a special event rather than part of an everyday diet, closely associated with meeting friends or celebrating, most likely with friends, special days. The Theory of Planned Behavior effectively explained fast food consumption behaviors with relatively high R
2around 0.6. Multiple regression analyses showed that fast food consumption behavior was significantly related to behavioral intention (b = 0.61, P < 0.001) and perceived behavioral control (b = 0.19, P < 0.001). Further analysis showed that behavioral intention was significantly related to subjective norm (b = 0.15, P < 0.01) and perceived behavioral control (b = 0.56, P < 0.001). Attitude toward fast food consumption was not significantly associated with behavioral intention. Therefore, effective nutrition education programs on fast food consumption should include components to change the subjective norms of fast food consumption, especially among peers, and perceived behavioral control. Further studies should examine effective ways of changing subjective norms and possible alternatives to fast food consumption for students to alter perceived behavioral control.
Key Words: Fast food consumption, middle school students, theory of planned behavior
Introduction 12)
Food service industry in Korea blossomed in the 1990s largely due to the needs created by the 1986 Asian Games and the 1988 Olympic Games [1]. In addition, westernization pursuing diver- sity, speed, and convenience was widely spread in daily life, which further promoted the development of the fast food industry.
Labensky et al. [2] define fast food as “Food dispensed quickly at an inexpensive restaurant generally offering a limited menu of inexpensive items, many of which may not be particularly nutritious; the food can be eaten on premises, taken out or sometimes delivered.” Typical fast foods include hamburgers, French fries, pizza, fried chicken, and doughnuts. The Korean fast food industry posted a rapid and significant average annual growth of 39.7%, illustrated by a sales increase from 55.2 million Korean won in the 1990s to current 1.38 billion Korean won [3]. The impressive growth rate of the fast food industry seemed to plateau shortly after the year 2000, but the total sales remain high. The total sales of fast food restaurants specializing in pizza, hamburgers, and fried chicken in 2006 were 3.3 billion Korean won, 6.48% of total sales from all restaurants [3,4].
The most frequent consumers of fast foods are people in their teens and twenties, probably because these foods are fast, convenient, and relatively inexpensive [5-7]. According to a study conducted by Lee in Pusan [7], fast foods were consumed once or twice monthly by 38.5% of elementary school students and 40.5% of high school students, rates higher than those observed in people in their forties or fifties. A similar trend was seen for those individuals consuming fast foods more than once per week. Both elementary and high school students indicated taste and low cost as reasons for patronizing fast food stores.
Another study in a small city also found more frequent fast food consumption by people in their teens and twenties. When asked for reasons why they frequented fast food stores, teen’s listed fast service, convenience, taste, and price, in that order [6].
Frequent consumption of fast foods by adolescents may be detrimental to their growth and development [8]. The adolescent period is when physical and mental growth and development are rapid, resulting in high energy and nutritional needs. Therefore, people in this age group should try to adhere to adequate and appropriate diets [9]. The Korea Youth Risk Behavior Web-based Survey (KYRBWS) [10] found poor dietary behaviors and
The authors would like to thank the students who participated and the teachers who assisted with data collection for this study.
§
Corresponding Author: Soo-Kyung Lee, Tel. 82-32-860-8121, Fax. 82-32-862-8120, Email. [email protected] Received: October 25, 2010, Revised: February 22, 2011, Accepted: March 14, 2011
ⓒ 2011 The Korean Nutrition Society and the Korean Society of Community Nutrition
This is an Open Access article distributed under the terms of the Creative Commons Attribution Non-Commercial License (http://creativecommons.org/licenses/by-nc/3.0/)
which permits unrestricted non-commercial use, distribution, and reproduction in any medium, provided the original work is properly cited.
nutritional imbalance to be two of the main health behavior problems in Korean youth. Some adolescents consumed fast and processed foods, while many adolescents did not consume recommended foods such as fruits, vegetables, milk, etc. The survey found that 32.3% of adolescents consumed one or more servings of fruit per day, 16.5% consumed three or more servings of vegetables per day, 15.2% consumed more than 2 cups of milk per day, 68.4% ate fast food more than once per week, and 72.5% ate instant noodles more than once per week. There is concern over these high rates of fast food consumption because of the high energy, fat, and sodium content found in them.
Research has shown that frequently eating fast food leads to high consumption rates of energy, total fat, saturated fat, and sodium and low consumption rates of vitamin A, vitamin C, milk, fruits, and vegetables [11-13]. High rates of fast food consumption can lead to chronic disease, including obesity, diabetes, and hypertension [14,15]. For example, fast food consumption was positively related to weight gain and insulin resistance, leading to an increased risk of obesity and type 2 diabetes [16,17].
Regularly consuming fast food negatively influences overall dietary behaviors. Frequent fast food consumption was associated with lower scores of dietary behaviors, dietary attitude, and nutrition knowledge as well as irregular and picky eating among children and adolescents [13,18,19]. Previous studies [5, 20]
reported that adolescents themselves also felt that frequent fast food consumption caused “westernization of taste,” “favoring eating-out,” and “liking salty food.”
There is increasing needs for nutrition education on the appropriate use of fast food. Designing useful nutrition education requires a good understanding of factors affecting fast food use.
Most research related to fast food has focused on it as a part of snack consumption [21-24] or has consisted of simple analyses of consumption rates and patterns [6,7,25-28].
There have been several studies focused on fast food use, related dietary behaviors, and nutrition knowledge level [5,13, 18-20,29-31] and only one study [32] systematically examined the factors influencing fast food use among college students.
Therefore, this study attempted the systemic examination among adolescents to promote the healthier use of fast foods.
This study applied the Theory of Planned Behavior (TPB) to understand factors influencing fast food use. The TPB is an extension of the Theory of Reasoned Action (TRA) by Ajzen [33]. The TRA explains human behaviors as they relate to attitude and subjective norm, while the TPB also includes perceived behavioral control. That is, the TPB proposes that human behaviors are determined by behavioral intention affected by attitude, subjective norm, and perceived behavioral control. In relation to fast food use, “attitude” would be personal positive or negative feelings toward fast food use, while “subjective norm” would be how much a person desires to respect and follow the opinions of individuals who are important to him or her.
“Perceived behavioral control” would be a person’s perceived capabilities and his or her belief in use or disuse of fast food
in their environments. The TPB has been used to examine various topics in public health, such as healthy food choice [34-37], dairy consumption [38], and fast food consumption [32].
The goals of this study were to examine current fast food consumption rates among middle school students and to explore the factors influencing fast food use with the TPB. The information and knowledge gained in this study will be useful in designing nutrition education programs promoting better eating habits.
Subjects and Methods
Subjects
Subjects of this study were recruited from four middle schools (one boy’s, one girl’s, and two co-ed) in Seoul. Students were asked to complete a pre-tested questionnaire under the supervision of a teacher. All of the 405 distributed questionnaires were returned; however, 51 partially completed questionnaires were excluded. This left a total of 354 questionnaires, a response rate of 87.4%.
Questionnaire
The questionnaire used in this study was developed through a two-step process. First, we asked 20 middle school students to freely write the pros and cons of fast food use and those factors enabling and disabling its consumption. Based on the information acquired and previous studies [33-37,39,40], a questionnaire was developed for this study. The questionnaire was then pre-tested with 40 middle school students. Based on the results from the pre-test, some changes in wording were made for the final version of the questionnaire.
The study gathered information about the students’ general characteristics, fast food consumption, attitude toward fast food use, subjective norm toward fast food use, perceived behavioral control of fast food use, and intention of fast food use.
General characteristics
General characteristics included sex, height, weight, parents’
education, parents’ working status, interest in health, interest in body weight management, and whether the students ate alone.
Body mass index (BMI) was calculated from reported weight and height. BMI was used to determine each student’s weight status according to the 2007 Korean Growth Standard.
Underweight was defined as having a BMI lower than the 5
thpercentile, overweight was defined as having a BMI between
the 85
thand 95
thpercentile, and obesity was defined as having
a BMI in the 95
thpercentile or higher. If a student had a BMI
greater than 25, he or she was considered obese regardless of
his or her BMI percentile [41].
Fast food use
Fast food use was examined by frequency of consumption, days when it was used often, people with whom the students used fast foods, the purpose of its use, and the places where it was often used. “Fast food” was defined as pizza, fried chicken, hamburgers, French fries, or doughnuts. The frequency of fast food use was analyzed for each food category.
Behavioral intention
Behavioral intention to use fast food was determined with the question, “How often do you think you will consume a hamburger in the next month?” The same question was asked about French fries, pizza, fried chicken, and doughnuts for a total of five questions in this category. A 4-point Likert scale (1: not at all, 2: a little, 3: somewhat, 4: very much) was used to respond to these questions.
Attitude toward fast food use
Attitude toward fast food use was explored with questions about the pros and cons of fast food consumption. A total of 12 questions were developed with possible answers given on a 4-point Likert scale (1: not at all, 2: a little, 3: somewhat, 4:
very much). Questions pertained to the topics of familiarity, health, nutrition, taste, store atmosphere, sanitation, fullness after eating, energy content of fast food, salt content of fast food, fat content of fast food, and beliefs about the relationship between fast food and body weight. Cronbach’s alpha among the 12 questions was 0.886, showing a reasonable level of internal reliability.
Subjective norm
Subjective norm is determined with normative belief and motivation to comply [33]. Normative belief was examined by asking the students three questions about how they perceived the opinions of people important to them (parents, teachers, and friends) regarding fast food use. Motivation to comply was examined by asking the students how much they respected and followed the opinions of people important to them. The responses to all questions were given on a 4-point Likert scale (1: not at all, 2: a little, 3: somewhat, 4: very much). Cronbach’s alpha for normative belief and for motivation to comply was 0.592 and 0.738, respectively. The Internal reliability for normative belief was relatively low because the opinions of students’ friends tended to be different from those of their parents and teachers.
Perceived behavioral control
Perceived behavioral control was explored with thirteen questions concerning the enabling and disabling factors for fast food use, which were also answered with a 4-point Likert scale
(1: not at all, 2: a little, 3: somewhat, 4: very much). The internal reliability of these questions was good, with a Cronbach’s alpha of 0.886.
Statistical analyses
All statistical analyses were conducted with SPSS 12.0. Simple statistics, such as frequencies, means, and standard deviations were used along with t-tests and χ
2-tests. A Pearson correlation test was conducted to examine the relationships between factors of the TPB and fast food use, and multiple regressions were used to further the analysis.
Results
General characteristics
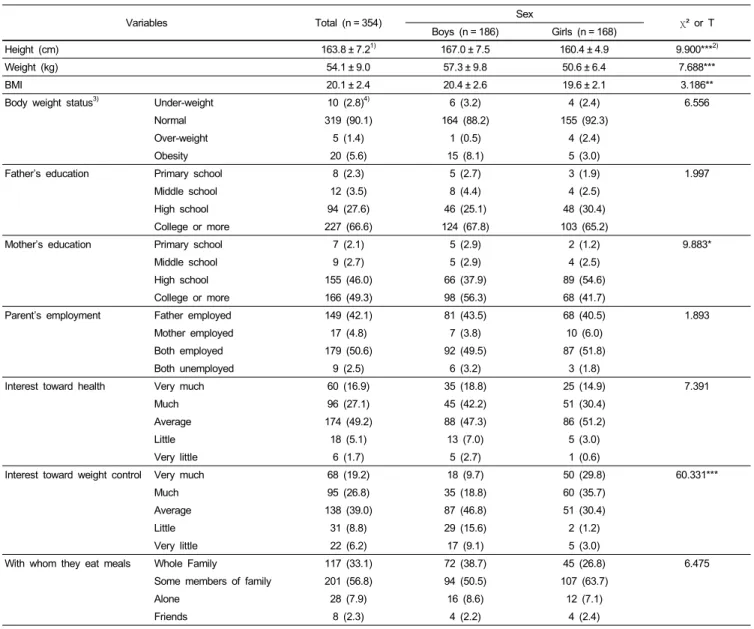
The general characteristics of the subjects are presented in Table 1. A total of 354 middle school students (52.5% boys) participated in this study. The average height and weight for boys were 167.0 cm and 57.3 kg, respectively and 160.4 cm and 50.6 kg, respectively, for girls. The majority of the subjects had a normal body weight, while 1.4% were overweight and 5.6% were obese. A total of 44% of the subjects reported a high level of interest in health. The subjects were also interested in weight control, with girls showing a higher interest level than boys.
Approximately 8% of the subjects ate meals alone.
Fast food consumption patterns
Fast food consumption patterns of the subjects are shown in Table 2. Subjects consumed fast foods (any type) an average of 4.05 times per month. Hamburgers and fried chicken were consumed more frequently than French fries, pizza, or doughnuts.
Hamburgers were more frequently consumed by boys (1.27 times per month) than girls (0.81 times per month), and the opposite was true for doughnuts (both differences significant).
Fast foods were consumed on special days (33.9%) or when meeting friends (25.7%). This was supported by the subjects choosing fast food outlets downtown (59.9%) as opposed to those near home or school. That the subjects ate fast foods while they were with friends (61.6%) also supported that fast food consumption was associated with special days or friends. Boys answered that they also chose to eat fast food when they were hungry (23.1%). More girls (63.7%) ate fast food as a meal, while more boys (54.8%) ate fast food as snack.
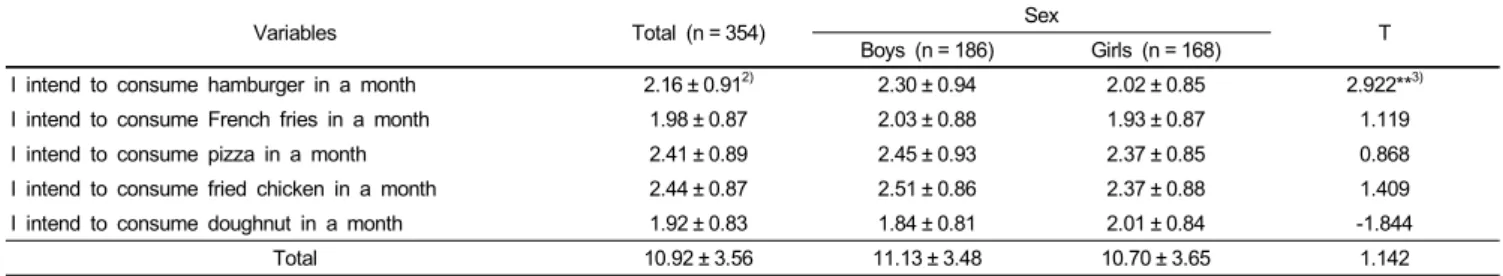
Behavioral intention
The behavioral intention to consume fast food averaged 10.92
out of a possible maximum score of 20, the sum of the five
scores on the intention to consume hamburgers, French fries,
Variables Total (n = 354) Sex
χ² or T Boys (n = 186) Girls (n = 168)
Height (cm) 163.8 ± 7.2
1)167.0 ± 7.5 160.4 ± 4.9 9.900***
2)Weight (kg) 54.1 ± 9.0 57.3 ± 9.8 50.6 ± 6.4 7.688***
BMI 20.1 ± 2.4 20.4 ± 2.6 19.6 ± 2.1 3.186**
Body weight status
3)Under-weight 10 (2.8)
4)6 (3.2) 4 (2.4) 6.556
Normal 319 (90.1) 164 (88.2) 155 (92.3)
Over-weight 5 (1.4) 1 (0.5) 4 (2.4)
Obesity 20 (5.6) 15 (8.1) 5 (3.0)
Father’s education Primary school 8 (2.3) 5 (2.7) 3 (1.9) 1.997
Middle school 12 (3.5) 8 (4.4) 4 (2.5)
High school 94 (27.6) 46 (25.1) 48 (30.4)
College or more 227 (66.6) 124 (67.8) 103 (65.2)
Mother’s education Primary school 7 (2.1) 5 (2.9) 2 (1.2) 9.883*
Middle school 9 (2.7) 5 (2.9) 4 (2.5)
High school 155 (46.0) 66 (37.9) 89 (54.6)
College or more 166 (49.3) 98 (56.3) 68 (41.7)
Parent’s employment Father employed 149 (42.1) 81 (43.5) 68 (40.5) 1.893
Mother employed 17 (4.8) 7 (3.8) 10 (6.0)
Both employed 179 (50.6) 92 (49.5) 87 (51.8)
Both unemployed 9 (2.5) 6 (3.2) 3 (1.8)
Interest toward health Very much 60 (16.9) 35 (18.8) 25 (14.9) 7.391
Much 96 (27.1) 45 (42.2) 51 (30.4)
Average 174 (49.2) 88 (47.3) 86 (51.2)
Little 18 (5.1) 13 (7.0) 5 (3.0)
Very little 6 (1.7) 5 (2.7) 1 (0.6)
Interest toward weight control Very much 68 (19.2) 18 (9.7) 50 (29.8) 60.331***
Much 95 (26.8) 35 (18.8) 60 (35.7)
Average 138 (39.0) 87 (46.8) 51 (30.4)
Little 31 (8.8) 29 (15.6) 2 (1.2)
Very little 22 (6.2) 17 (9.1) 5 (3.0)
With whom they eat meals Whole Family 117 (33.1) 72 (38.7) 45 (26.8) 6.475
Some members of family 201 (56.8) 94 (50.5) 107 (63.7)
Alone 28 (7.9) 16 (8.6) 12 (7.1)
Friends 8 (2.3) 4 (2.2) 4 (2.4)
1)
Mean ± SD
2)
By t-test, ** P < 0.01, *** P < 0.001
3)
Body weight status by BMI percentiles for age, Underweight: < 5
thpercentile, normal: 5
th≤ ~ < 85
thpercentile, overweight: 85
th≤ ~ < 95
thpercentile, obesity: 95
th≤ percentile
4)
N (%), by χ²-test, * P < 0.05, *** P < 0.001
Table 1. Participants’ characteristicspizza, fried chicken, or doughnuts. Therefore, the averaged score of 10.92 appeared to be somewhere between ‘a little’ and
‘somewhat’. No gender differences were found in the summed score; however, boys appeared to have a higher intention to consume hamburgers than girls (Table 3).
Attitudes toward fast food consumption
Table 4 shows students’ attitudes toward fast food consumption.
The average score of overall attitude was 24.55 out of 48. The subjects showed strong positive attitudes toward taste, fast food store environments, and familiarity and strong negative attitudes toward saltiness of fast food. Boys had a significantly stronger
attitude toward taste and saltiness of fast food than did girls (P
< 0.01).
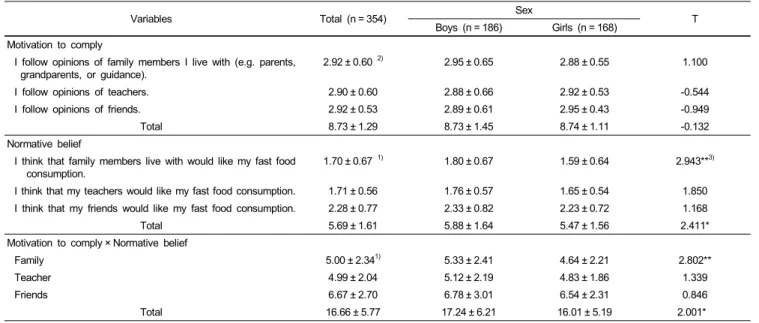
Subjective norm
Subjective norm was examined for family, teachers and friends
(Table 5). Motivation to comply and normative belief were
questioned separately, and the subjective norm was obtained by
multiplying the motivation to comply score by the normative
belief score. While motivation to comply showed very similar
scores for family, teachers and friends, normative belief was
stronger with friends. Therefore, the subjective norm about fast
food consumption for friends was higher than for family or
Variables Total (n = 354) Sex
χ² or T Boys (n = 186) Girls (n = 168)
Consumption frequency (/mo) Hamburger 1.05 ± 1.42
1)1.27 ± 1.69 0.81 ± 0.99 3.172**
2)French fries 0.50 ± 0.95 0.52 ± 0.94 0.47 ± 0.95 0.508
Fried chicken 1.02 ± 1.09 1.09 ± 1.02 0.94 ± 1.16 1.329
Pizza 0.97 ± 0.91 0.98 ± 0.91 0.96 ± 0.91 0.264
Doughnuts 0.51 ± 1.25 0.38 ± 1.08 0.65 ± 1.41 -2.028*
All
3)4.05 ± 3.56 4.25 ± 3.55 3.83 ± 3.58 1.108
Occasions for fast food consumption
When parents not at home 45 (12.7)
4)27 (14.5) 18 (10.7) 19.263**
Special days 120 (33.9) 55 (29.6) 65 (38.7)
Meeting friends 91 (25.7) 37 (19.9) 54 (32.1)
When hungry 60 (16.9) 43 (23.1) 17 (10.1)
Out of habit 19 (5.4) 13 (7.0) 6 (3.6)
Others 19 (5.4) 11 (5.9) 8 (4.8)
With whom they ate Parents 45 (12.7) 24 (12.9) 21 (12.5) 8.977*
Brothers/sisters 67 (18.9) 38 (20.4) 29 (17.3)
Friends 218 (61.6) 105 (56.6) 113 (67.3)
Alone 24 (6.8) 19 (10.2) 5 (3.0)
They ate fast food as A meal 191 (54.0) 84 (45.2) 107 (63.7) 12.199***
Snack 163 (46.0) 102 (54.8) 61 (36.3)
Place Near home 61 (17.2) 40 (21.5) 21 (12.5) 44.083***
Near school 33 (9.3) 27 (14.5) 6 (3.6)
Near “hackwon”
5)43 (12.1) 34 (18.3) 9 (5.4)
Downtown 212 (59.9) 82 (44.1) 130 (77.4)
Others 5 (1.4) 3 (1.6) 2 (1.2)
1)
Mean ± SD
2)
By t-test, * P < 0.05, ** P < 0.01
3)
This total score was used as a dependent variable of fast food consumption in further analyses.
4)
N (%), by χ²-test, * P < 0.05, ** P < 0.01, *** P < 0.001
5)
Private learning institute
Table 2. Fast food consumption patterns
Variables Total (n = 354) Sex
Boys (n = 186) Girls (n = 168) T
I intend to consume hamburger in a month 2.16 ± 0.91
2)2.30 ± 0.94 2.02 ± 0.85 2.922**
3)I intend to consume French fries in a month 1.98 ± 0.87 2.03 ± 0.88 1.93 ± 0.87 1.119
I intend to consume pizza in a month 2.41 ± 0.89 2.45 ± 0.93 2.37 ± 0.85 0.868
I intend to consume fried chicken in a month 2.44 ± 0.87 2.51 ± 0.86 2.37 ± 0.88 1.409
I intend to consume doughnut in a month 1.92 ± 0.83 1.84 ± 0.81 2.01 ± 0.84 -1.844
Total 10.92 ± 3.56 11.13 ± 3.48 10.70 ± 3.65 1.142
1)
Response categories used a 4-point Likert scale (1 = not at all, 2 = a little, 3 = somewhat, 4 = very much).
2)
Mean ± SD
3)
By t-test, ** P < 0.01
Table 3. Intention to consume fast food1)
teachers. In addition, boys tended to think that family would like their fast food consumption more than girls (P < 0.01). Because of this difference, boys had a higher total subjective norm score than girls (P < 0.05).
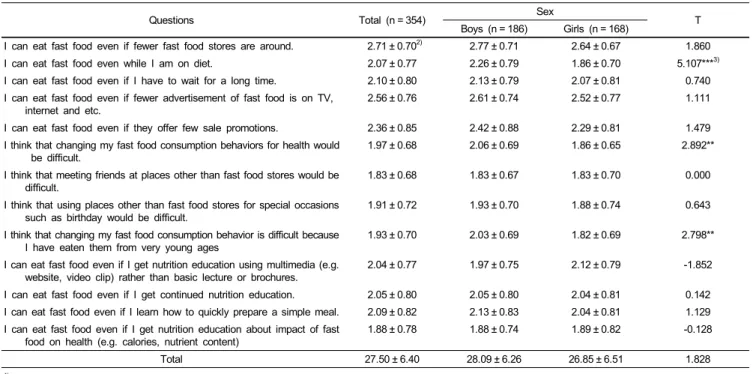
Perceived behavioral control
The average total score of perceived behavioral control was 27.5 out of 52 (Table 6). Boys showed higher scores than girls, although this difference was not significant. Questions resulting in higher scores were those concerning fewer fast food stores,
fewer advertisements, and fewer sales promotions. The question resulting in the lowest score concerned finding other places to meet friends. Three questions showed differences in gender. Girls reported more difficulty than boys in eating fast food while on a diet (P < 0.001) and in changing their current fast food consumption behaviors (P < 0.01).
The variables of the Theory of Planned Behaviors were significantly and positively correlated (P < 0.01, Table 7). In particular, fast food consumption behavior was highly (r = 0.736) correlated with behavioral intention.
Multiple regression analyses were conducted to determine the
Questions Total (n = 354) Sex
Boys (n = 186) Girls (n = 168) T
Fast food is familiar to me. 2.36 ± 0.78
2)2.38 ± 0.82 2.33 ± 0.73 0.657
I think that fast food is not good for health. 1.53 ± 0.60 1.50 ± 0.56 1.57 ± 0.64 -1.114
I think that fast food can provide all necessary nutrients of a meal. 1.81 ± 0.70 1.84 ± 0.74 1.78 ± 0.65 0.866
I think that fast food is delicious. 3.28 ± 0.63 3.39 ± 0.62 3.16 ± 0.63 3.407**
3)I think that fast food stores provide fun environments. 2.66 ± 0.78 2.66 ± 0.83 2.66 ± 0.73 0.007
I think that fast food stores are clean. 2.05 ± 0.76 2.01 ± 0.78 2.09 ± 0.74 -0.970
I think that fast food is clean and safe. 1.86 ± 0.71 1.87 ± 0.71 1.84 ± 0.72 0.417
I think that fast food portions are large enough to feel full. 1.71 ± 0.64 1.71 ± 0.65 1.71 ± 0.62 2.020
I think that fast food has a lot of salt. 2.49 ± 0.86 2.60 ± 0.94 2.36 ± 0.75 2.667**
I think that fast food has a lot of fat. 1.91 ± 0.74 1.87 ± 0.75 1.96 ± 0.72 -1.185
I think that eating fast food will make me fat. 1.44 ± 0.59 1.50 ± 0.63 1.38 ± 0.52 1.933
I think that fast food has a lot of calories. 1.45 ± 0.54 1.45 ± 0.54 1.44 ± 0.53 0.195
Total 24.55 ± 3.87 24.78 ± 3.88 24.28 ± 3.85 1.228
1)
Response categories used a 4-point Likert scale (1 = not at all, 2 = a little, 3 = somewhat, 4 = very much).
2)
Mean ± SD,
3)
By t-test, ** P < 0.01
Table 4. Attitude toward fast food consumption 1)
Variables Total (n = 354) Sex
Boys (n = 186) Girls (n = 168) T Motivation to comply
I follow opinions of family members I live with (e.g. parents,
grandparents, or guidance). 2.92 ± 0.60
2)2.95 ± 0.65 2.88 ± 0.55 1.100
I follow opinions of teachers. 2.90 ± 0.60 2.88 ± 0.66 2.92 ± 0.53 -0.544
I follow opinions of friends. 2.92 ± 0.53 2.89 ± 0.61 2.95 ± 0.43 -0.949
Total 8.73 ± 1.29 8.73 ± 1.45 8.74 ± 1.11 -0.132
Normative belief
I think that family members live with would like my fast food consumption.
1.70 ± 0.67
1)1.80 ± 0.67 1.59 ± 0.64 2.943**
3)I think that my teachers would like my fast food consumption. 1.71 ± 0.56 1.76 ± 0.57 1.65 ± 0.54 1.850 I think that my friends would like my fast food consumption. 2.28 ± 0.77 2.33 ± 0.82 2.23 ± 0.72 1.168
Total 5.69 ± 1.61 5.88 ± 1.64 5.47 ± 1.56 2.411*
Motivation to comply × Normative belief
Family 5.00 ± 2.34
1)5.33 ± 2.41 4.64 ± 2.21 2.802**
Teacher 4.99 ± 2.04 5.12 ± 2.19 4.83 ± 1.86 1.339
Friends 6.67 ± 2.70 6.78 ± 3.01 6.54 ± 2.31 0.846
Total 16.66 ± 5.77 17.24 ± 6.21 16.01 ± 5.19 2.001*
ㅁ1)
Response categories used a 4-point Likert scale (1 = not at all, 2 = a little, 3 = somewhat, 4 = very much).
2)
Mean ± SD,
3)
By t-test, * P < 0.05, ** P < 0.01
Table 5. Subjective norm about fast food consumption1)
relative importance of the variables of the Theory of Planned Behaviors to fast food consumption behaviors (Table 8). When attitude toward behavior, subjective norms, and perceived control were regressed against behavioral intention, the model was highly significant (P = 0.000) and explained a good proportion of the variance (R
2= 0.675). Behavioral intention, the dependent variable in this model, indicated the a total score of intention to consume fast food shown in Table 3. While attitude was not significant, subjective norms and perceived controls were significantly associated with the intention to consume fast food.
Perceived behavioral control seemed to be the most important
of the three variables.
The second model, using fast food consumption as a dependent
variable, was also highly significant (P = 0.000) and explained
more than half of the variance. In this model, the dependent
variable, fast food consumption, meant the total monthly
consumption frequency of all kinds of fast food shown in Table
2. Both behavioral intention and perceived behavioral control
were significantly associated with fast food consumption, of
which behavioral intention appeared to be more important. No
significant gender differences were found in these relationships.
Questions Total (n = 354) Sex
Boys (n = 186) Girls (n = 168) T
I can eat fast food even if fewer fast food stores are around. 2.71 ± 0.70
2)2.77 ± 0.71 2.64 ± 0.67 1.860
I can eat fast food even while I am on diet. 2.07 ± 0.77 2.26 ± 0.79 1.86 ± 0.70 5.107***
3)I can eat fast food even if I have to wait for a long time. 2.10 ± 0.80 2.13 ± 0.79 2.07 ± 0.81 0.740
I can eat fast food even if fewer advertisement of fast food is on TV, internet and etc.
2.56 ± 0.76 2.61 ± 0.74 2.52 ± 0.77 1.111
I can eat fast food even if they offer few sale promotions. 2.36 ± 0.85 2.42 ± 0.88 2.29 ± 0.81 1.479
I think that changing my fast food consumption behaviors for health would be difficult.
1.97 ± 0.68 2.06 ± 0.69 1.86 ± 0.65 2.892**
I think that meeting friends at places other than fast food stores would be difficult.
1.83 ± 0.68 1.83 ± 0.67 1.83 ± 0.70 0.000
I think that using places other than fast food stores for special occasions such as birthday would be difficult.
1.91 ± 0.72 1.93 ± 0.70 1.88 ± 0.74 0.643
I think that changing my fast food consumption behavior is difficult because I have eaten them from very young ages
1.93 ± 0.70 2.03 ± 0.69 1.82 ± 0.69 2.798**
I can eat fast food even if I get nutrition education using multimedia (e.g.
website, video clip) rather than basic lecture or brochures.
2.04 ± 0.77 1.97 ± 0.75 2.12 ± 0.79 -1.852
I can eat fast food even if I get continued nutrition education. 2.05 ± 0.80 2.05 ± 0.80 2.04 ± 0.81 0.142 I can eat fast food even if I learn how to quickly prepare a simple meal. 2.09 ± 0.82 2.13 ± 0.83 2.04 ± 0.81 1.129 I can eat fast food even if I get nutrition education about impact of fast
food on health (e.g. calories, nutrient content)
1.88 ± 0.78 1.88 ± 0.74 1.89 ± 0.82 -0.128
Total 27.50 ± 6.40 28.09 ± 6.26 26.85 ± 6.51 1.828
1)
Response categories used a 4-point Likert scale (1 = not at all, 2 = a little, 3 = somewhat, 4 = very much).
2)
Mean ± SD
3)
By t-test, ** P < 0.01, *** P < 0.001
Table 6. Perceived behavioral control about fast food consumption1)
Variables Fast food consumption frequency Intentions Attitudes Subjective norm Perceived control
Fast food consumption frequency 1.00
Intentions 0.736**
1)1.00
Attitudes 0.380** 0.462** 1.00
Subjective norm 0.351** 0.423** 0.467** 1.00
Perceived control 0.593** 0.660** 0.614** 0.454** 1.00
1)
** P < 0.01
Table 7. Correlation coefficients between variables
Variables β
1)F R²
Dependent variable = Behavioral intention2)
Attitudes 0.05 0.92 0.675
Subjective norms 0.15 3.15**
4)Perceived behavioral control 0.56 10.96***
Dependent variable = Fast food consumption frequency3)
Behavioral intentions 0.61 12.99*** 0.562
Perceived behavioral control 0.19 4.04***
1)
Standardized parameter estimate
2)
Behavioral Intention in this model was intention to use fast food in a month, shown in table 3.
Model df = 353 model F = 97.64, P = 0.000
3)
Fast food consumption frequency in this model was total frequency of fast food consumption in a month, as shown in table 2. Model df = 353 model F = 224.88, P = 0.000
4)
** P < 0.01, *** P < 0.001
Table 8. Multiple regressions on consumption of fast food