Vol. 23, No. 3, pp. 217-223, May 31, 2017, ISSN 1229-3431(Print) / ISSN 2287-3341(Online) https://doi.org/10.7837/kosomes.2017.23.3.217
†
1. Introduction
There are well-known maritime risk assessment models in high repute such as ‘Port and Waterway Safety Assessment tool’
(PAWSA), ‘IALA Waterway Risk Assessment Program’ (IWRAP).
These models are officially approved and recommended as ‘Risk Management Tool’ by the International Association of Marine Aids to Navigation and Lighthouse Authorities (IALA) in July 2006 (IALA, 2009a). On the other hand, there are noteworthy local models.
Firstly, Environmental Stress model (ES model) was developed by Japanese researchers in order to express mariners’ stress degree caused by ship-handling difficulties in restricted waters like harbours and narrow channels (Inoue, 2000). In 2009, the government of the Republic of Korea adopted a new safety system named marine traffic safety examination which is a mandatory maritime audit scheme for securing safe navigation in navigable waters, and the ES model has been widely used in the audit process for quantifying the risks involved in vessel traffic in specific waters. Japan also adopted a similar maritime audit scheme that was known to use ES model but it was not mandatory.
Secondly, Potential Assessment of Risk Model (PARK model) and Numerical Risk Assessment model (NURI model) were recently devised by Korean researchers (Park, 2007; Lee, 2013).
The above mentioned models are classified into two large groups. IWRAP, ES model and PARK model are quantitative risk assessment tools. PAWSA and NURI model are qualitative risk
safe@korea.kr, 044-200-5825
assessment tools. The two groups have the complementary nature (IALA, 2009b).
The tools are all proved its practical use at port zones and restricted channels, but marine casualty and incident occur along coastal waters in most cases as shown in Table 1 (MOF, 2017).
Therefore, this paper intends to contribute to introducing a new risk tool that can be used at coastal waters.
Area Year 2012 2013 2014 2015 2016 Total
Territorial Waters
South 508 293 425 783 807 2,816
West 454 366 405 546 579 2,350
East 172 110 112 206 250 850
Ports &
Approaches 171 126 145 308 335 1,085
International Waters
South 79 61 93 75 96 404
West 32 30 25 42 36 165
East 79 60 66 101 132 438
Others 22 11 10 4 4 51
Foreign Waters
Southeast
Asia 35 27 31 29 38 160
Japan 21 9 18 7 30 85
Total 1,573 1,093 1,330 2,101 2,307 8,404
Table 1. Marine Casualty and Incidence (2012-2016)
2. Risk Assessment Tools
In accordance with the study of comparison assessment applying ES model with PARK model in the Busan adjacent waterways, the
A Study on Incidence of Risk Factor for Assessing Maritime Traffic Risk
Inchul Kim
** International Maritime Team, Maritime Safety Bureau, Ministry of Oceans and Fisheries, Sejong 30110, Korea
Abstract : In order to assess risk as a basic step for securing safety, it requires to select risk factors and determine the frequency and the severity of the consequence of each risk factor. This research adopted common risk factors among well-known maritime risk assessment models, and proposed objective criteria to gauge the risk level of each risk factor. The starting points of risk evolution were chosen for criteria according to related studies and seafarers’ experience. The rate of risk appearance over the criteria is named as the incidence of risk factor. Therefore, the total risk level is expressed as the combination of incidence of each risk factor and severity. This quantitative method would be applied to measuring and comparing the risk level of target maritime zones, and it would also be useful to survey which risk factor be focused for reducing the total risk of a certain maritime zone.
Key Words : Risk, Risk factor, Risk frequency and severity, Risk assessment model, Incidence of risk factor
result showed similarity in the waterways within the harbor and approaches. Moreover, the PARK model gave more consistent results than the ES model in 2 10 nautical miles’ coastal area near ports (Nguyen, 2013). Kim et al. (2011) and Kim and Lee (2012) found that ES model of Japan showed a difference of result in Korean coast by comparison with PARK model. The difference of result was minor and believed to come from subjective evaluation part of the model making process.
The quantitative tool is a form of ready made formula which just needs application, but the qualitative tool requires human’s intervention during application. So, human’s intervention should be carefully reviewed not to weaken objectivity of the result. In this context, NURI model is quite useful because it determines the risk level of each risk factor on a logarithmic scale which is based on statistics of risk factors.
NURI model’s structure is quite similar to that of PAWSA because NURI model takes 20 risk factors whose origin is basically 24 factors of PAWSA, though the risk factors were chosen after analysis and comparison with other tools’ risk factors.
The utilization of NURI model was evaluated in ports of Mokpo, Wando and approaching channels. The results showed high consistency with marine casualty statistics in the considered area and proceeding studies on the risk of the areas (Lee, 2013).
Kim (2016) compared and analyzed representative tools of Korea, Japan and the United States in order to sort out common risk factors that can be used in coastal waters while minimizing subjective evaluation of participants. The selected tools were maritime audit schemes of Korea and Japan, and PAWSA of US.
Then, several factors of PAWSA like vessels’ quality are excluded owing to the difficulties of obtaining correct value of the factors at coastal waters. Maritime casualty records were also excluded because casualty is a kind of phenomenon that is caused by unsafe environment.
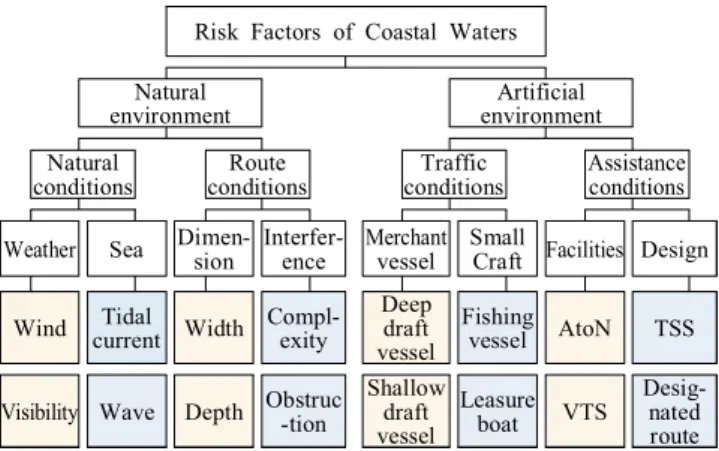
Kim and An (2016) reorganized the common risk categories into 16 factors. In order to use AHP tool for producing weights of risk factors, Related 2 risk factors were grouped into 1 category. For example, tidal current factor and wave factor compose sea category. Sea and weather also compose natural conditions. Natural environment consists of natural conditions and route conditions. So, the 3-step structure is composed as shown in Fig. 1.
The grouping structure is the same as NURI model and PAWSA, but risk measurement of each factor is different. The PAWSA risk assessment process is handled by participants because the process requires the participation of professional waterway
users of the designated water, port operators or stakeholders if needed. Participants identify major hazards, estimate risk levels and consequences, evaluate potential mitigation measures, and set the stage for implementation of selected measures to reduce risk (IALA, 2009b).
Risk Factors of Coastal Waters Natural
environment Artificial
environment Natural
conditions Route
conditions Traffic
conditions Assistance conditions Weather Sea Dimen-
sion Interfer-
ence Merchant vessel Small
Craft Facilities Design
Wind Tidal
current Width Compl- exity
Deep draft vessel
Fishing
vessel AtoN TSS
Visibility Wave Depth Obstruc-tion
Shallow draft vessel
Leasure
boat VTS Desig-
nated route
Fig. 1. Marine Traffic Risk Factors of Coastal Waters.
Conclusively, risk level of PAWSA factor is checked by participants based on their expertise. The concept of risk evaluation in PAWSA is shown in Eq. (1).
(1)
where H: Harm
TC
RR: Tangible Consequences of Risks Realized
IC
All: Intangible Consequences of All Risks, Real and Perceived $
P,P,RP: Costs of Prevention, Protection, Response Preparedness
PAWSA participants vary case by case but NURI model does not require human participation in each case. NURI model takes pre-determined 1 to 5 scale index system shown as Table 2 instead of participants’ expertise.
Index Frequency Consequence
1 Extremely Remote Extremely Minor
2 Remote Minor
3 Normal Normal
4 Frequent Major
5 Extremely Frequent Extremely Major
Table 2. Frequency & Consequence Index
Thus, NURI model is believed to be more objective than PAWSA because it minimizes human intervention in the risk assessment process.
The risk concept of NURI model is shown in Eq. (2). Applied form is Eq. (3).
×
(2)
where R: Risk
C
f: Frequency of Casualty C
c: Consequence of Casualty
(3)
where RI: Risk Index FI: Frequency Index CI: Consequence Index
However, the index system of NURI model involves fundamental errors. Wind factor would be an example. If wind speed is under 13.9 m/s, the consequence index (CI) is 3 according to Table 3. When wind speed is 13.9 m/s, the CI is allocated to 4.
The one step of CI means 20 % difference because there are only 5 steps. It would not be understandable to give 20 % difference for the gap of ‘under 13.9 m/s’ and ‘13.9 m/s.’ Moreover, frequency index (FI) also shows the same difference of 20 %.
When wind blows 90 days, FI is 3, and it is called as ‘normal.’ 91 days’ wind is FI 4 and it is ‘frequent.’
CI Consequence Application FI Frequency Application 1 Extremely
Minor under 3.4m/s 1 Very
Remote 7 days or less per 1 year 2 Minor under 8.0m/s 2 Remote 30 days or less
per 1 year 3 Normal under 13.9m/s 3 Normal 90 days or less
per 1 year 4 Major 13.9m/s or more 4 Frequent 180 days or less
per 1 year 5 Extremely
Major Typhoon 5 Very
Frequent 181 days or more per 1 year
Table 3. Wind Indexes of NURI model
It is caused by the 5 integer of CI and FI that cannot express decimal fraction between whole number. So, there exists digital
cliff between index numbers. In addition, the titles of indexes include pre-judged value although it is not fixed yet. For instance, index 3 is ‘normal’, index 4 is ‘major’ or ‘frequent.’
In order to reduce the malfunction of index system and increase reliability, this study suggests incidence. In case that incidence criterion of wind is 13.9 m/s, and wind over 13.9 m/s blows 100 days in a year, the incidence calculation of wind is 100/365.
Accordingly, incidence of wind is 0.274, and incidence rate is 27.4 %.
If wind over 13.9 m/s did not blow, incidence is ‘0.’ It means no risk in terms of wind. So, it is better to express risk level by analog incidence rate instead of digital index number in this case.
Therefore, this study aims at proposing incidence criteria of the 16 risk factors as substitute for the index system, and proposes a new risk equation.
3. Risk Assessment Formula
Safety and risk by definition of IMO were applied to most risk assessment models with necessary modification. Typical quantitative tools are IWRAP, ES model and PARK model, and qualitative tools are PAWSA and NURI model. The two types of tools have the complementary nature.
In order to secure objectivity of the qualitative tools up to quantitative tools, human’s intervention should be carefully reviewed. In this regard, NURI model adopts a logarithmic scale that consists of 1 5 scales of CI and FI. However, the index system of NURI model would lack accuracy and contain errors caused by the 5 integer of CI and FI that cannot express decimal fraction between whole number.
3.1 General Formula of Risk Assessment Models
Safety is the absence of unacceptable levels of risk to life, limb and health from unwilful acts, and Risk is the combination of the frequency and the severity of the consequence (IMO, 2015). So most of maritime risk assessment models are based on the Eq. (4), and there are several modified equations according to evaluation methods.
× (4)
where R = Risk
P = Probability that undesired incident occurs
C = Consequences of undesired incident
IWRAP as a qualitative tool adopts the Eq. (5). It is a modified form of Eq. (4).
λ
Col(or λ
Gnd) = NG x PC (5)
where
λ = Annual casualty frequency ( λ
Col: annual collision frequency, λ
Gnd: annual grounding frequency) NG = Geometric Number of Collision or Grounding
Candidates PC = Causation Factor
Formal Safety Assessment (FSA) of the International Maritime Organization (IMO) recommended to define probability index and consequence index on a logarithmic scale for facilitating the ranking of hazards and validation of ranking. The equation is Eq.
(6) (IMO, 2002). NURI model adopted the Eq (6) in order to use risk matrix.
Log (Risk) = log (Probability) + log (Consequence) (6)
3.2 New Formula for Risk Assessment
As we studied, the index system could sometimes include avoidable errors. NURI model showed the example of index error.
The concept of risk needs to be reviewed to avoid errors by the use of indices. ‘Probability that undesired incident occurs’ can be expressed as ‘Incidence of risk factor’, and ‘Consequences of undesired incident’ can be as ‘Weight of risk factor.’ Therefore, a new formula is shown in Eq. (7).
×
×
․ ․ ․
×
(7)
where R: Risk
R
f: Risk Factor Incidence
: Risk Factor Weight ( ≦ ≦ )
4. Incidence
Incidence could be calculated by criteria of each risk factor. So criteria should be reasonable for general acceptance and tangible for data collection. This study suggests that the followings be criteria of risk factors, but the weight as a component of the formula remains for further study.
4.1 Incidence of natural conditions
Referring to Fig. 1, natural conditions are composed of weather and sea. Weather consists of wind factor and visibility factor, and sea has tidal current factor and wave factor.
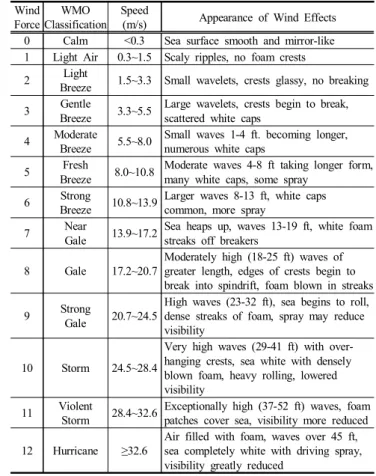
4.1.1 Wind
Beaufort Scale is the most widely used wind scale indicator at sea. Beaufort Scale 4 means that wind speed is 5.5~8.0 m/s, sea shows numerous white caps as shown in Table 4. Wind speed of Beaufort Scale 5 is 8.0~10.8 m/s. It is believed that normal navigation could be possible in Beaufort Scale 4 condition. So, incidence criterion of wind could be 8.0 m/s which is between Beaufort Scale 4 and 5.
If wind over 8.0 m/s blows 365 days, the incidence equation is 365/365. It is ‘1’ and 100 % risky. It mean unsafe condition. The wind data can be collected by consulting a climate year book published by the meterological administrations. Therefore, the criterion 8.0 m/s is practicable in terms of data aquisition and utility. The denominator of natural conditions is 365 days.
Wind Force
WMO Classification
Speed
(m/s) Appearance of Wind Effects 0 Calm <0.3 Sea surface smooth and mirror-like 1 Light Air 0.3~1.5 Scaly ripples, no foam crests
2 Light
Breeze 1.5~3.3 Small wavelets, crests glassy, no breaking
3 Gentle
Breeze 3.3~5.5 Large wavelets, crests begin to break, scattered white caps
4 Moderate
Breeze 5.5~8.0 Small waves 1-4 ft. becoming longer, numerous white caps
5 Fresh
Breeze 8.0~10.8 Moderate waves 4-8 ft taking longer form, many white caps, some spray
6 Strong
Breeze 10.8~13.9 Larger waves 8-13 ft, white caps common, more spray
7 Near
Gale 13.9~17.2 Sea heaps up, waves 13-19 ft, white foam streaks off breakers
8 Gale 17.2~20.7
Moderately high (18-25 ft) waves of greater length, edges of crests begin to break into spindrift, foam blown in streaks
9 Strong
Gale 20.7~24.5
High waves (23-32 ft), sea begins to roll, dense streaks of foam, spray may reduce visibility
10 Storm 24.5~28.4
Very high waves (29-41 ft) with over- hanging crests, sea white with densely blown foam, heavy rolling, lowered visibility
11 Violent
Storm 28.4~32.6 Exceptionally high (37-52 ft) waves, foam patches cover sea, visibility more reduced 12 Hurricane ≥32.6
Air filled with foam, waves over 45 ft, sea completely white with driving spray, visibility greatly reduced