1. Introduction
These days, local medical institutions made effort to get competitiveness by better customer service. Mobile environment was made by developed information technology and supply of smart devices to give customer service at general hospitals. In 2019, general hospitals, such as Seoul National University Hospital, Gangbuk Samsung Hospital, and Hanlim University Medical Center were opened to introduce PC based medical institution by using mobile app, and to give health information, and to do biometric login and
* First Author, Professor, Dept. of Healthcare Management, Catholic Kwandong University, Korea. TEL: +82-33-649-7592,
E-mail: [email protected]
** Corresponding Author, Professor, Dept. of Healthcare Management, Catholic-Kwandong University, Korea. TEL: +82-33-649-7508, E-mail: [email protected]
© Copyright: Korean Distribution Science Association (KODISA)
This is an Open Access article distributed under the terms of the Creative Commons Attribution Non-Commercial License (https://creativecommons.org/licenses/by-nc/4.0/) which permits unrestricted non-commercial use, distribution, and reproduction in any medium, provided the original work is properly cited.
to do mobile payment and reservation and to inquire of medical check up and to apply to certificate and to notify doctor's round visit and to release GPS based smart phone standby ticket and to do medical check up by using virtual experience and in-house navigation system.
Local big hospitals opened customer service in accordance with mobile environment and upgraded existing functions and did marketing of mobile app services. And, most of medical institutions gave simple information such as introduction, guide of medical check up and heath information.
Medical consumers could get service quality of medical institutions from Internet to select medical institutions (Ok, Oh, & Kim, 2009). Better quality of online service made successful online service to produce customer reliability, satisfaction and loyalty (Fassnacht & Koese, 2006; Cristobal, Flavián, & Guinaliu, 2007). Medical institutions's app service quality shall be checked to improve quality. Mobile app service quality was examined, for instance, shopping mall, delivery, online banking, travel agent, hotel and airlines.
Medical service with specialty had unbalance between Print ISSN: 2233-4165 / Online ISSN: 2233-5382
doi:http://dx.doi.org/10.13106/ijidb.2019.vol10.no6.19
A Study on the Quality Improvement of Mobile App Services of Medical Institutions: Focus on the Kano Model and PCSI Index
Ae-Jun PARK
*, Yeon-Sook LEE*
Received: May 17, 2019. Revised: May 22, 2019. Accepted: June 05, 2019.
Abstract
Purpose - The purpose of this study was to examine quality improvement priorities by examining not only quality classifications but also PCSI (Kano, 1984) of mobile app service qualities of general hospitals in the Metropolitan Area and offer potential improvements.
Research design, data, and methodology – The study examined five of service qualities, including app design, reaction, convenience, safety and supply of information by precedent studies. 20 test items were selected. A total of 60 positive and negative questions to estimate customer satisfaction and PCSI was investigated. The author collected 300 copies from interviewees who made use of the app services of 13 general hospitals within one year, and classified quality factors by using table of quality assessment and also estimated the customer satisfaction index (Timko, 1993). The study made quality improvement priority by the PCSI index.
Results - Reaction of the mobile app service quality ranked the highest PCSI, and payment safety ranked the highest, and customer support and supply of the information ranked high as well. It was observed that design ranked comparatively lower in these categories.
Conclusion - Safety, reaction and supply of information should be prioritized to reorganize and improve the mobile app services.
Keywords: Mobile App Service Quality, Kano Model, Cs-Coefficient, Pcsi Index.
JEL Classifications: I11, M11, M15, M31.
knowledge and information of consumers and suppliers and to be difficult to standardize and to test quality. These days, large scaled medical centers expanded mobile service to be difficult to find quality factors and customer satisfaction.
Service quality factors of mobile app service of medical institutions shall be classified and customer satisfaction of precedent factor of customer behavior intention shall be examined. Service quality perceived by customers may have different satisfaction depending upon physical condition and emotional condition (Kano, Seraku, Takahashi, & Tsuji, 1984). Kano model investigated service quality dually to give not only service quality level but also cognition perceived by consumers (Kim, Youn, & Lee, 2018). This study investigated satisfaction of mobile app service quality by quality factor. The study investigated app service quality of customers of general hospitals, for instance, app design, reaction, convenience, safety and supply of information to classify six service quality, for instance, attractive quality, one unknown quality, natural quality, uninterested quality, adverse quality and speculative quality. The study gave PCSI(Potential Customer Satisfaction Improvement) index to determine not only CSC(Customer Satisfaction Coefficient) but also service improvement (Timko, 1993) and to give app service quality perception and to lessen time and cost and to suggest practical approach of mobile app service improvement.
2. Precedent studies 2.1. Mobile app service quality
Mobile app service is said to help consumers buy information, product and service by mobile devices immediately. (Kalakota & Robinson, 2002). Mobile app information can be supplied regardless of user's access time and place to distinguish mobile service from Internet service(Figge, 2000; Lee & Dai Jing, 2014). Mobile website quality says quality that customers perceive (Poddar, Donthu,
& Wei, 2008). Quality based on precedent studies was:
Counteraction, reliability, function/design, process and enjoyment (Bauer, Falk, & Hammerschmidt, 2006), and easiness in the use, counteraction, personality, guarantee and use Bressolles, Durrieu, and Senecal (2014). e-SERVQUAL model includes efficiency, fulfillment, security and use of the system to apply to low cost airline. (Lee, 2014). The study selected five kinds of mobile app service quality, reaction, convenience, safety and supply of information.
2.1.1. App Design
Either design of website (Wolfinbarger & Gilly, 2002;
Zeithaml, Parasuraman, & Malhotra, 2000) or e-escape (Van Riel, Liljander, & Jurriens, 2001) had influence upon website quality. Information and service of the website were thought to be important and display, design and handwriting style
were also important to decide website (Wen, Prybutok, Blankson, & Fang, 2014). Website shall be easy to make use and to understand contents of the web (Choi, Park, &
Jung, 2015). Design factor shall help to increase web access. Web service quality can be tested in accordance with precedent studies.
2.1.2. Reactivity
Reactivity of app service is said to be time that service provider replies to customer's question and complaint (Minocha, Millard, & Dawson, 2003) and to be promptness of response and service provider's ability and to reflect customer's cognition (Zeithaml et al., 2000; Liao & Cheung, 2002; Gummerus, Liljander, Pura, & van Riel, 2004; Hwang
& Lee, 2011). Reactivity was selected to test service quality.
2.1.3. Convenience
Convenience of the use of online service is said to make use of mobile app without limitation on place and time (Gu
& Lee, 2016), Even good quality service that user is not allowed to make use may be of no value; Convenience of the use may have direct influence upon website quality.
(Webster & Williams, 2005; Tarafdar & Zhang, 2005). The study selected convenience to test service quality.
2.1.4. Safety
Users can protect personal information when making use of online payment application. (Parasuraman, Zeithaml, &
Malhotra, 2005). And, safety indicates uneasiness of disclosure of personal information and private life (Noh &
Kim, 2007). Safety of online bank has affirmative influence upon customer satisfaction (Yoon, 2010). Safety is to test service quality.
2.1.5. Supply of information
Various kinds of information can be supplied to give customers information and to solve problems and to inform enterprise, product and service. (Shim & Kim, 2005). Supply of information as well as system function can have influence upon Internet user's activity. (Zhou, 2013; Zheng, 2013).
Supply of information is to test service quality.
2.2. Kano model
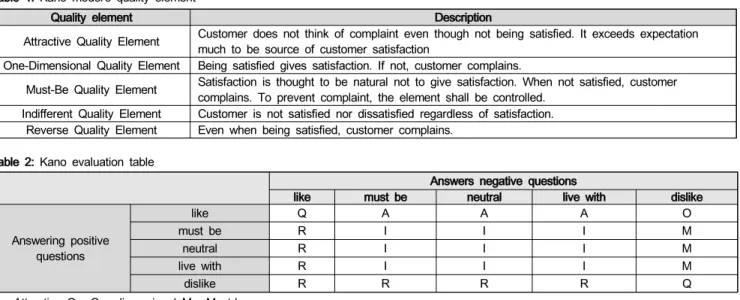
1984, professor Kano Noriaki at Tokyo University said Kano model being commodity planning theory to indicate dual quality and to produce Kano model replacing single quality. (Kano et al., 1984). Kano model includes five of quality elements, for instance, attractive quality element, one dimensional quality element, must-be quality element, indifferent quality element and reverse quality element. <Table 1>.
Questionnaire survey was done. Five questionnaires include positive questions and negative questions: <Table 2>.
Table 1: Kano model's quality element
Quality element Description
Attractive Quality Element Customer does not think of complaint even though not being satisfied. It exceeds expectation much to be source of customer satisfaction
One-Dimensional Quality Element Being satisfied gives satisfaction. If not, customer complains.
Must-Be Quality Element Satisfaction is thought to be natural not to give satisfaction. When not satisfied, customer complains. To prevent complaint, the element shall be controlled.
Indifferent Quality Element Customer is not satisfied nor dissatisfied regardless of satisfaction.
Reverse Quality Element Even when being satisfied, customer complains.
Answers negative questions
like must be neutral live with dislike
Answering positive questions
like Q A A A O
must be R I I I M
neutral R I I I M
live with R I I I M
dislike R R R R Q
A : Attractive O : One-dimensional M : Must-be I : Indifferent Q : Questionable result R : Reverse Table 2: Kano evaluation table
Kano model has two of limitations: The element with the largest interviewees shall determine quality not to reflect detailed difference(Kim, 2010; Lee, Seo, & Song, 2017).
Customer is unable to find out quality element not to get customer satisfaction(Timko, 1993; Kim, 2010). Being different from one dimensional quality thought, Kano model has dual testing.
2.3. CSC and PCSI Index
CSC: CSC(Customer Satisfaction Coefficient) supplemented Kano model to have strong quality characteristic and weak quality characteristic(Timko, 1993). CSC includes SI (Satisfaction Index) and DI(Dissatisfaction Index) to estimate:
SI(Satisfaction Index)
= (A frequency + O frequency) / (A frequency + O frequency + M frequency + I frequency) DI(Dissatisfaction Index)
= (O frequency + M frequency / A frequency + O frequency + M frequency + I frequency)(-1) Make diagram of 2 dimensional plane coordinate by customer satisfaction and dissatisfaction to include attractive element, one dimensional element, must-be element, and indifferent element.
PCSI Index (Potential Customer Satisfaction Improvement Index) finds out current customer satisfaction when customer is partially satisfied, and examines how much improved. (Lim
& Park, 2010). PCSI index indicates distance between P and S. P of current satisfaction shows customer's satisfaction at PCSI between satisfaction index and dissatisfaction index. PCSI includes 0 to 2. ʻ0ʼ says no room of improvement that all of customers are satisfied, and '2'
does all of customers' perception of dissatisfaction ranging from ‘-1’ to ‘+1’ of P(Kim & Park, 2015). Estimate PCSI Index as follow:
P= {(S-D) x (Max-L) / Max – Min} + D PCSI index=S-P P : Current satisfaction.
S : Satisfaction index.
D : Dissatisfaction.
L : Current satisfaction level Max : Maximum satisfaction.
Min : Minimum satisfaction.
Kano model was used to classify mobile app service quality element having influence upon customer satisfaction, and customer satisfaction coefficient was used (Timko, 1993) to supplement Kano model. The study estimated potential customer satisfaction to find out mobile app service quality improvement priority.
3. Methodology
3.1. Methodology and Design
Based on precedent studies on mobile app service quality, this study tested five of service quality such as app design, reactivity, convenience, safety and giving of information by Kano model. Sixty of affirmative questions and negative questions were used to get Kano model, customer satisfaction and PCSI index and to estimate customer satisfaction coefficient (Timko, 1993) and to find out priority of medical service quality.
3.2. Data Collection
The investigation was done in accordance with approval of IRB NO. CKU-19-01-0103 of Institutional Review Board to research by M's panel 7 days from March 30, 2019. The interviewees were the ones who were 20 years old or more to be patients and/or protectors at general hospitals (13) in Metropolitan Area. Number of effective questionnaires was 300 copies.
4. Finding 4.1. Interviewees
The interviewees were 174 women (58.0%) and 126 men (42.0%), and 77 persons (25.7%) in the 30s and 119 persons (39.7%) in the 40s, 68 persons (22.7%) in the 20s and 36 persons (12.0%) in the 50s or older and to be 37.6 years old on average. Office worker occupied the largest number, that is to say, 185 persons (61.7%), and housewives of 31 persons (10.3%), professional of 28 persons (9.3%), students of 25 persons (8.3%), and self employed of 11 persons (3.7%) and government official of 11 persons (3.7%) and miscellaneous of 9 persons (3.0%).
General hospitals made use of mobile app service: Seoul National University of 66 persons (22.0%), the largest followed by Seoul Asan Hospital of 52 persons (17.3%), Severance Hospital of 35 persons (11.7%), and Gangnam Severance Hospital of 23 persons (7.7%) and other hospitals of less than 5%, for instance, Seoul Saint Mary''s Hospital of 13 persons (4.3%), Gangbuk Samsung, Konkuk University and
Hanyang University of 10 persons (3.3%), Korea University Guro Hospital of 9 persons (3.0%), and Chung-Ang University of 7 persons (2.3%), and Korea University Anam of 4 persons (1.3%). 214 persons (71.3%) of 300 persons made use of check up reservation service and 170 persons (56.7%) did check up schedule guide, and 116 persons (38.7%) did inquiry into contents of inquiry, and 88 persons (29.3%) did guide to hospital, and 64 persons (21.3%) did order of standby, and 63 persons (21.0%) did in-house place and 62 persons (20.7%) did smart receiving at front desk, and 58 persons (19.3%) did smart phone payment, and 55 persons (18.3%) did health information, and 43 persons (14.3%) did parking registration service, and 26 persons (8.7%) did medicine taking notice service, and 20 persons (6.7%) did health note, and 16 persons (5.3%) did inquiry into delivery of prescription note.
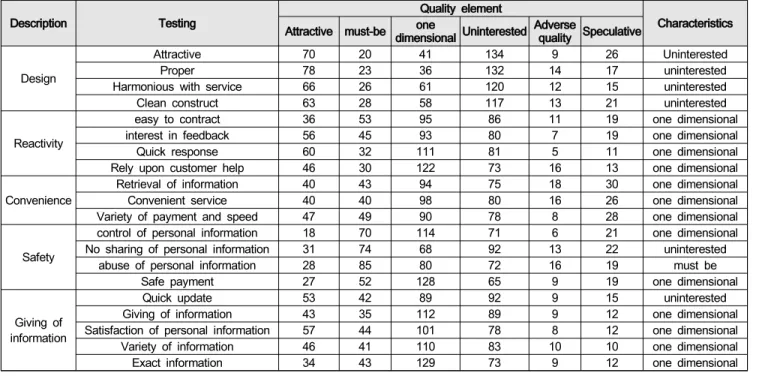
4.2. Kano model analysis result of medical institution app service quality
Analysis on medical institution app service quality of Kano model was: Reactivity had four of One dimensional quality element and convenience did three, and safety did two and giving of information did one. Reactivity, convenience and giving of information were said to be one dimensional quality element, and design was done to be disinterest quality element, and safety was done to be disinterest and must be quality element. App service users who were satisfied with reactivity, convenience and giving of information increased satisfaction, and the ones who were not satisfied increased dissatisfaction. The users were not interested in design quality element <Table 3>.
Table 3: Kano model analysis on mobile app service quality (N=300)
Description Testing Quality element
Characteristics Attractive must-be one
dimensional Uninterested Adverse
quality Speculative Design
Attractive 70 20 41 134 9 26 Uninterested
Proper 78 23 36 132 14 17 uninterested
Harmonious with service 66 26 61 120 12 15 uninterested
Clean construct 63 28 58 117 13 21 uninterested
Reactivity
easy to contract 36 53 95 86 11 19 one dimensional
interest in feedback 56 45 93 80 7 19 one dimensional
Quick response 60 32 111 81 5 11 one dimensional
Rely upon customer help 46 30 122 73 16 13 one dimensional
Convenience Retrieval of information 40 43 94 75 18 30 one dimensional
Convenient service 40 40 98 80 16 26 one dimensional
Variety of payment and speed 47 49 90 78 8 28 one dimensional
Safety
control of personal information 18 70 114 71 6 21 one dimensional
No sharing of personal information 31 74 68 92 13 22 uninterested
abuse of personal information 28 85 80 72 16 19 must be
Safe payment 27 52 128 65 9 19 one dimensional
Giving of information
Quick update 53 42 89 92 9 15 uninterested
Giving of information 43 35 112 89 9 12 one dimensional
Satisfaction of personal information 57 44 101 78 8 12 one dimensional
Variety of information 46 41 110 83 10 10 one dimensional
Exact information 34 43 129 73 9 12 one dimensional
4.3. Customer satisfaction on mobile app service quality
Kano model classifies service quality element. Users are difficult to understand service quality elements. The study examined customer satisfaction element (Timko, 1993) to make use of customer satisfaction coefficient (satisfaction coefficient and dissatisfaction coefficient) to find out sensitivity of service quality element.
Reactivity_relying upon customer's help was the highest (0.62) followed by reactivity_quick response (0.60), giving of information_exact information (0.58), safety_safe payment (0.57) and giving of information and satisfied with personal
desire (0.56). Safety_personal information control (-0.67) was the highest followed by ‘safety_misuse of personal information (-0.62), giving of information_exact information (-0.62), and reactivity_relying upon customer help (-0.56).
Reactivity and giving of information had close relation with satisfaction, and safety had done with uneasiness.
Design had disinterest design factor. Reactivity, convenience and giving of information were one dimensional quality. 'Safe payment' only was one dimensional quality element, and other personal information was must be quality.
When being satisfied with reactivity, convenience and giving of information, app service users were satisfied. Users should be satisfied with safety of must be quality element.
Table 4: Customer satisfaction of mobile app service quality
Description Testing SI DI Content Description Testing SI DI content
Design
attractive 0.42 -0.23 disinterested
safety
personal information control 0.48 -0.67 must be proper 0.42 -0.22 disinterested no sharing of personal
information 0.37 -0.54 must be good service 0.47 -0.32 disinterested misuse of personal
information 0.41 -0.62 must be good construction 0.45 -0.32 disinterested safe payment 0.57 -0.66 one dimensional Reactivity
Easy contact 0.49 -0.55 must be
giving of information
quick update 0.51 -0.47 attractive Feedback 0.54 -0.50 one dimensional giving of information 0.56 -0.53 one dimensional quick response 0.60 -0.50 one dimensional personal desire satisfied 0.56 -0.52 one dimensional
relying upon
customer help 0.62 -0.56 one dimensional various information 0.56 -0.54 one dimensional Convenience
Retrieval 0.53 -0.54 one dimensional exact information 0.58 -0.62 one dimensional convenient service 0.53 -0.53 one dimensional
various payment and
speed 0.52 -0.53 one dimensional
Figure 1: Classification of mobile app service quality using CS-coefficient
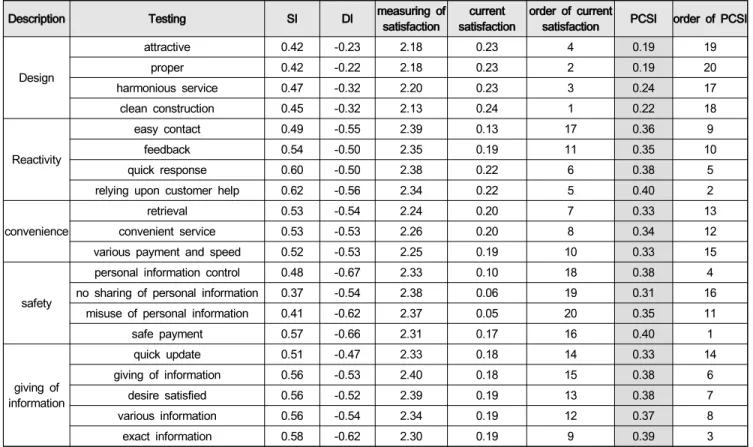
4.4. PCSI Index
PCSI index can verify sensitivity of quality not to find out improvement. This study estimated PCSI index <table 5>.
PCSI Index can find out customer satisfaction to examine improvement.
Design_clean construction ranked the highest (0.24) followed by design-proper (0.23), design_harmonious service (0.23), design_attractive (0.23), misuse of personal information (0.05), safety_no sharing of personal information (0.06) and safety_personal information control (0.10).
Design was disinterest because it was given at satisfaction. Safety had low satisfaction to lower complaint.
PCSI Index was: Safety_safe payment (0.40) was the highest, followed by reactivity_relying upon customer's help (0.40), giving of information_exact information (0.39), safety_personal information control (0.38), reactivity_quick response (0.38). However, design-proper (0.19), design_attractive (0.19), design_clean construction (0.22) and design_harmonious service (0.24) were low.
Customers were satisfied with adaptability and giving of information at mid level to be much satisfied. They were satisfied with safety at low level. They were much satisfied with design.
5. Conclusion 5.1. Findings
This study investigated app design, reactivity, convenience, safety and giving of information of mobile app service: 20 questions were used. Kano model was used to give user's cognition and improvement of mobile app service. PCSI index was used to give priority of service quality.
The users were not interested in app design <Table 3>
to have low satisfaction <Table 4> and low dissatisfaction.
They did not think much of app design and were much satisfied currently to maintain.
Reactivity was thought to be one dimensional element according to kano model <Table 3>, and easy contact was must be quality element <Table 4>. Not only will of being help for customer but also quick response ranked high at PCSI index. The users thought much of will and ability of being help to difficulty. Medical institution shall improve response system to let app users contact manager easily and train to help customers.
Table 5: PCSI index on mobile app service quality
Description Testing SI DI measuring of
satisfaction current
satisfaction order of current
satisfaction PCSI order of PCSI Design
attractive 0.42 -0.23 2.18 0.23 4 0.19 19
proper 0.42 -0.22 2.18 0.23 2 0.19 20
harmonious service 0.47 -0.32 2.20 0.23 3 0.24 17
clean construction 0.45 -0.32 2.13 0.24 1 0.22 18
Reactivity
easy contact 0.49 -0.55 2.39 0.13 17 0.36 9
feedback 0.54 -0.50 2.35 0.19 11 0.35 10
quick response 0.60 -0.50 2.38 0.22 6 0.38 5
relying upon customer help 0.62 -0.56 2.34 0.22 5 0.40 2
convenience
retrieval 0.53 -0.54 2.24 0.20 7 0.33 13
convenient service 0.53 -0.53 2.26 0.20 8 0.34 12
various payment and speed 0.52 -0.53 2.25 0.19 10 0.33 15
safety
personal information control 0.48 -0.67 2.33 0.10 18 0.38 4
no sharing of personal information 0.37 -0.54 2.38 0.06 19 0.31 16
misuse of personal information 0.41 -0.62 2.37 0.05 20 0.35 11
safe payment 0.57 -0.66 2.31 0.17 16 0.40 1
giving of information
quick update 0.51 -0.47 2.33 0.18 14 0.33 14
giving of information 0.56 -0.53 2.40 0.18 15 0.38 6
desire satisfied 0.56 -0.52 2.39 0.19 13 0.38 7
various information 0.56 -0.54 2.34 0.19 12 0.37 8
exact information 0.58 -0.62 2.30 0.19 9 0.39 3
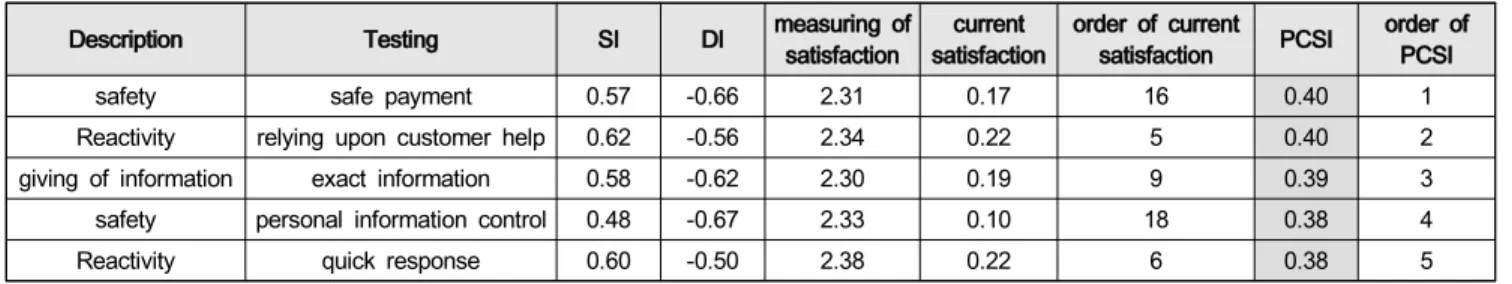
Table 6: Top PCSI Index of Mobile App Quality of Service
Description Testing SI DI measuring of
satisfaction current
satisfaction order of current
satisfaction PCSI order of PCSI
safety safe payment 0.57 -0.66 2.31 0.17 16 0.40 1
Reactivity relying upon customer help 0.62 -0.56 2.34 0.22 5 0.40 2
giving of information exact information 0.58 -0.62 2.30 0.19 9 0.39 3
safety personal information control 0.48 -0.67 2.33 0.10 18 0.38 4
Reactivity quick response 0.60 -0.50 2.38 0.22 6 0.38 5
The users cognize convenience of Kano model and customer satisfaction to be dissatisfied and satisfied. Current satisfaction of the convenience was placed at the middle, and PCSI order was done at mid low place. Supply of mobile app service could help retrieve information quickly to have variety of payment ways and to improve convenience.
Safety had one dimensional, disinterest and must be quality factor <Table 3>. Safe payment was classified to be one dimensional, and no sharing of personal information was done to be disinterest, and misuse of personal information was done to be must-be to improve depending upon level.
Users were satisfied with safety the least, and PCSI of payment safety ranked high. Medical institutions shall manage personal information safety and safe payment to build up security system preventing the information.
Giving of information mostly belonged to one dimensional quality element to be disinterest quality element and to be attractive quality element at analysis on satisfaction. Mobile app service users were satisfied with giving of information at low level, and with PCSI order at high ranking.
The users thought much of exactness and benefit of medical information despite mid level of satisfaction. They need to investigate information regularly to give it regularly and to update.
The study investigated mobile app service by five quality element and 20 items by Kano model to be one dimensional quality element of reactivity and convenience and to be app design of disinterest quality. Safety was thought to be personal information control, and safe payment was one dimensional and no sharing of personal information was to be disinterest, and misuse of personal information was to be must be quality. Giving of information was thought to be one dimensional quality, and quick update was done to be disinterest. Safe payment, will of customer support and exact information were thought to be important.
Safe payment, personal information control, will of customer support, and exact information were thought to be important.
Medical institutions shall take action accordingly.
5.2. Discussion
The study was valuable. First, five kinds of quality and services were used to estimate app service quality. Previous
studies did not classify mobile app service by quality and service. This study gave quality from point of view of app service user and to give direction of app service development and improvement. Second, the study investigated high class general hospitals having mobile app service, and examined customer satisfaction index of Timko (1993) to give direction of improvement. The study verified priority of improvement to give service quality and to differ from precedent studies examining relation with consumer behavior only. The study gave priority of the service at same level of quality from point of view of practice <Tabel 6> and to avoid unnecessary service.
Testing of five quality items of the app service was difficult to classify into app service quality element. Further study shall investigate reuse and perceived value.
References
Bauer, H. H., Falk, T., & Hammerschmidt, M. (2006).
eTransQual: A transaction process-based approach for capturing service quality in online shopping. Journal of
Business Research, 59(7), 866-875.
doi:10.1016/j.jbusres.2006.01.021
Bressolles, G., Durrieu, F., & Senecal, S. (2014). A consumer typology based on e-service quality and e-satisfaction. Journal of Retailing and Consumer
Services, 21(6), 889-896.
doi:10.1016/j.jretconser.2014.07.004
Choi, C. J., Park, J. S., & Jung, W. S. (2015).
Improvement of Web Contents Accessibility in Geriatric Hospitals. The Journal of the Korea Institute of Electronic Communication Sciences, 10(8), 959-964.
doi:10.13067/JKIECS.2015.10.8.959
Cristobal, E., Flavián, C., & Guinaliu, M. (2007).
Perceived e-service quality(PeSQ) Measurement validation and effects on consumer satisfaction and web site loyalty. Managing service quality: An international journal, 17(3), 317-340.
doi:10.1108/09604520710744326
Fassnacht, M., & Koese, I. (2006). Quality of electronic services: Conceptualizing and testing a hierarchical model. Journal of service research, 9(1), 19-37.
doi:10.1177/1094670506289531
Figge, S. (2002). Stefan Situation-dependent service-a challenge for mobile network operators. Journal of Marketing, 51(April), 11-27. doi:10.1016/S0148-2963(02)00431-9
Gummerus, J., Liljander, V., Pura, M., & van Riel, A.C.R.
(2004). Customer loyalty to M.aent-based Web sites:
The case of an online health-care service. Journal of
Services Marketing, 18(3), 175-186.
doi:10.1108/08876040410536486
Gu, W., & Lee, J.H. (2016). A Study on The Use Intention of Mobile Payment Application Based on e-SERVQUAL in China. Korean Journal of Hotel
Administration, 25(7), 195-210.
uci:G704-001024.2016.25.7.015
Hwang, H. J., & Lee, S. M. (2011). A Study on Transferring the Effects of Brand Reputation and Level of Service Satisfaction of an Offline Channel Company When It is Expanding to an Online Distribution Channel.
Journal of Distribution Science, 9(2), 31-36.
Kassim, N., & Asiah Abdullah, N. (2010). The effect of perceived service quality dimensions on customer satisfaction, trust, and loyalty in e-commerce settings: A cross cultural analysis. Asia Pacific Journal of Marketing and Logistics, 22(3), 351-371.
doi:10.1108/13555851011062269
Kalakota, R., Robinson, M., & Kalakota, D. R. (2002).
M-business: The race to mobility. New York, NY:
McGraw-Hill.
Kano, N., Seraku, N., Takahashi, F., & Tsuji, S. (1984).
Attractive quality and must-be quality. Journal of The Japanese Society for Quality Control, 14(2), 147-156.
Kim, J. H., & Park, C. M. (2015). Improvement Prioritization of Health and Medical Service Quality Attributes using PCSI Index-Focused on One Upper Level General Hospital. Korea Journal of Hospital Management, 20(2), 39-56.
Kim, S. C. (2010). A Study on the Service Quality Improvement by Kano Model & Weighted Potential Customer Satisfaction Index. Journal of Distribution Science, 8(4), 19-25.
Kim, S. O., Youn, S. H., & Lee, M. J. (2018). The Study on the e-Service Quality Factors in m-Shopping Mall App based on the Kano Model. International Journal of Industrial Distribution & Business, 9(12), 63-72.
doi:10.13106/ijidb.2018.vol9.no12.63.
Lee, M. K. (2014). Effects of Smartphone Application e-Service Quality on Customer Satisfaction and Repurchase Intention. Journal of the Korea Entertainment Industry Association, 8(1), 47-59.
doi:10.21184/jkeia.2014.03.8.1.47
Lee, S. J., & Dai, J. (2014). The Effect of Mobile Tourism Information Service Features on Perceived Value, Satisfaction, and Using Intentions. Journal of Distribution Science, 12(12), 75-82.
Lee, Y. C., Seo, D. H., & Song, S. H. (2017).
Classification and Evaluation of Service Quality Factor’s of O2O Delivery Applications Using Kano Model.
Journal of Industrial Convergence, 15(2), 27-36.
Liao, Z., & Cheung, M. T. (2002). Internet-based e-banking and consumer attitudes:an empirical study.
Information & Management, 39(4), 283-295.
doi:10.1016/S0378-7206(01)00097-0
Lim, S. U., & Park, Y. T. (2010). Development and Application of a Potential Customer Satisfaction Improvement Index based on Kano Model. The Korean Society for Quality Management, 2010(1), 291-309.
uci:G704-000306.2010.38.2.005
Minocha, S., Millard, N., & Dawson, L. H. (2003).
Integrating customer relationship management strategies in (B2C) e-commerce environments. Human-er puter Interaction, 19(4), 335-342. Retrieved from http://www.idemployee.id.tue.nl/g.w.m.rauterberg/conferen ces/INTERACT2003/INTERACT2003-p335.pdf
Noh, M. J., & Kim, H. Y. (2007). An Study on the Influence of Mobile Characteristics on the Mobile Service Adoption. Management education review, 48, 125-150.
Ok, S., Oh, J. Y., & Kim, S. M. (2009). The Impact of Online Health Information Service Quality on Expectation and Purchase Intention of Offline Health Service. The e-business studies, 10(3), 173-201.
Parasuraman, A., Zeithaml, V. A., & Malhotra, A. (2005).
ES-QUAL: A multiple-item scale for assessing electronic service quality. Journal of service research, 7(3), 213-233. doi:10.1177/1094670504271156
Poddar, A., Donthu, N., & Wei, Y. (2008). Website customer orientation, website quality, and purchase intention: The role of website personality. Journal of
Business Reserch, 62(4), 441-450.
doi:10.1016/j.jbusres.2008.01.036
Shim, G. Y., & Kim, Y. M. (2005). A Study on the effect of Internet Shopping Mall's Initial Web Page Image on Consumer's Purchase Intention. Management education review, 38, 191-217.
Tarafdar, M., & Zhang, J. (2005). Analyzing the Influence of Website Design Parameters on Website Usability.
Information Resources Management Journal, 18(4), 62-80. doi:10.4018/irmj.2005100104
Timko, M. (1993). An experiment in continuous analysis.
Center for Quality of Management Journal, 2(4), 17-20.
Van Riel, A. C., Liljander, V., & Jurriens, P. (2001).
Exploring consumer evaluations of e-services: A portal site. International Journal of Service Industry
Management, 12(4), 359-377.
doi:10.1108/09564230110405280
Webster, R., & Williams, P. (2005). An evaluation ofthe NHS Direct online health information e-mail enquiry service. Aslib Proceedings: New Information Perspectives, 57(1), 48-62. doi:10.1108/00012530510579066
Wen, C., Prybutok, V., Blankson, C., & Fang, J. (2014).
The role of E-quality within the consumer decision making process. International Journal of Operations &
Production Management, 34(12), 1506-1536.
doi:10.1108/IJOPM-07-2013-0352
Wolfinbarger, M., & Gilly, M. C. (2003). eTailQ:
dimensionalizing, measuring and predicting etail quality.
Journal of Retailing, 79(3), 183-198.
doi:10.1016/S0022-4359(03)00034-4
Yoon, C. (2010). Antecedents of customer satisfaction with online banking in China: The effects of experience. Computers in Human Behavior, 26(6), 1296-1304. doi:10.1016/j.chb.2010.04.001
Zeithaml, V.A., Parasuraman, A., & Malhotra, A. (2000). A
conceptual framework con understanding e-service quality: implications con future research and managerial practistand MSI Working Paper Series, No. 00-115.
MA: Cambridge.
Zheng, Y., Zhao, K., & Stylianou, A. (2013). The impacts of information quality and system quality on users' continuance intention in information-exchange virtual communities: An empirical investigation. Decision
Support Systems, 56, 513-524.
doi:10.1016/j.dss.2012.11.008
Zhou, T. (2013). Understanding continuance usage of mobile sites. Industrial Management & Data Systems, 113(9), 1286-1299. doi:10.1108/IMDS-01-2013-0001