www.earticle.net
두록 품종에서의 부계 선발지수 개발을 위한 형질별 가중치에 따른 유전적 개량량의 변화
고대영․최태정․최연호․김시동․박병호․조충일․조광현․이승수․최재관* 농촌진흥청 국립축산과학원
Changes in Genetic Potentials According to the Weights for Terminal Sire Index in Duroc Breed
Daeyoung Koh, Taejeong Choi, Yunho Choy, Sidong Kim, Byoungho Park, Chungil Cho, Kwanghyun Cho, Seungsoo Lee and Jaegwan Choi*
Animal Breeding and Genetics Division, National Instituete of Animal Science, R.D.A.
ABSTRACT1)
The objective of this study was to estimate genetic parameters on days to 90 kg body weight and ultrasound measured traits (back fat thickness, eye muscle area, retail cut percentage) and predict genetic progress when the weights for selection on the paternal traits of Duroc, which can be incorporated into sire line selection indexes. A simulation program, ZPLAN+, was used for the simulation. Genetic parameters of days to 90 kg body weight (D90KG), back fat thickness (BFT), eye muscle area (EMA) and retail cut percentage (RCP) used in the simulation were estimated from 27,972 heads of farm tested Duroc pigs from 2005 to July, 2012. Parameters of simulation used genetic parameters with parturition rates, ratios of test pigs and replacement rates that were dependent on selection protocols of simulated farms. Different weights of selection for traits of days to 90 kg and backfat thickness were compared. Estimates of heritability were 0.406, 0.355, 0.159 and 0.379 for D90KG, BFT, EMA and RCP, respectively. Genetic correlation of D90KG with BFT, EMA and RCP were –0.043, 0.049 and 0.021, respectively. Genetic correlation of BFT with EMA and RCP were –0.394 and –0.937. And genetic correlation between EMA with RCP were 0.524. Simulation result showed that index weight of 3:1 on D90KG and BFT was effective to shorten days to 90 kg without any significant changes in backfat thickness. Generally the genetic changes were greater as parturition rate and ratios of test pigs increased. Increase in replacement rate had a small effect on genetic changes in negative way. Thus, we recommend that index weight of 3:1 on days to 90 kg and backfat thickness could be utilized for sire line selection.
(Key words: Duroc, Paternal selection index, Genetic progress, ZPLAN+)
* Corresponding author: Jaegwan Choi, National Institute of Animal Science, Animal Breeding and Genetics Division, National Institute of Animal Science, R.D.A., Chonan 330-801, Korea. Tel: +82-41-580-3361, E-mail: [email protected]
This is an Open Access journal distributed under the teams of the Creative Commons Attribution Non-Commercial License (http://creativecommons.org/licenses(by-nc/3.0) which permits unrestricted non-commercial use, and reproduction in any medium, provided the original work is properly cited.
[Provider:earticle] Download by IP 118.70.52.165 at Monday, December 20, 2021 7:59 PM
www.earticle.net
Ⅰ. 서론
양돈 산업은 GGP(Great Grand Parent), GP(Grand Parent), PS(Parent Stock)단계의 피라미드 구조로서 GGP 종돈장에서 순종을 GP 종돈장으로 공급하고 GP 종돈장 요크셔와 랜드레이스의 F1을 PS농장으로 공급하면 PS농장 에서 두록의 정액으로 3원교잡의 비육돈을 생산하는 구조 이다. 우리나라의 종돈산업도 이와 같이 GGP 단계에서 선 발과 교배에 의해 개량이 이루어지며 개량된 우수한 유전 자는 GP 단계를 거쳐 PS농가로 전달되어 경제적으로 우수 한 비육돈을 생산하는 육종피라미드 구조를 갖고 있지만 그동안 GGP 종돈장간의 유전적 연결이 없어 개량의 효과 가 미미하게 나타났다. 따라서 최근에는 돼지개량의 효과 를 높이기 위하여 우리나라 종돈장간의 유전적 연결을 추 진하였고 부계 계통 두록 품종에 대하여 종돈장간 유전능 력평가가 가능하게 되었다. 부계계통의 두록품종은 산육형 질인 일당증체량, 90 ㎏ 도달일령, 등지방 두께 등을 개량 하고 있다. 본 연구에서는 두록품종에서 부계 종돈 선발 시 중요시 되는 90 ㎏ 도달일령, 등지방두께 형질의 유전 모수를 추정하고 경제형질별 표준화 육종가에 가중치를 설정하여 ZPLAN+를 이용한 모의시험을 통하여 경제형질 별 유전적 개량량 변화를 확인하여 부계선발지수식을 개 발하고자 실시하였다.
Ⅱ. 재료 및 방법
본 연구에서는 두록종의 부계선발지수를 설정하기 위하 여 돼지개량네트워크 사업에 참여한 두록 품종에 대하여 90 ㎏ 도달일령(D90KG), 등지방두께(BFT), 등심단면적 (EMA)과 정육율(RCP)의 유전모수를 추정하고 사업에 참 여한 각 종돈장별 종돈의 분만율과 검정비율 및 갱신율 등 을 종합하여 ZPLAN+ 프로그램의 모의시험에 필요한 모 수를 설정하였다.
1. 공시재료
본 연구는 돼지개량네트워크 사업에 참여한 종돈장에서 2005년부터 2012년 7월까지 농장검정한 두록 품종 25,972 두에 대한 90 ㎏ 도달일령(D90KG)과 등지방두께(BFT), 등 심단면적(EMA) 및 정육율(RCP)의 자료와 27,734두의 혈 통자료를 이용하여 유전모수를 추정하였고, 종돈장별, 출 생년도별 및 검정종료년별 검정빈도수를 Table 1에 표시하 였다.
2. 통계 분석 방법
본 연구에서 조사한 90 kg 도달일령(D90KG)과 등지방 두께(BFT), 등심단면적(EMA) 및 정육율(RCP)의 유전 모수 를 추정하기 위하여 다음과 같은 다형질 혼합 모형을 사용 하였고, 분석에는 WOMBAT(Meyer, 2007)을 이용하여 유 전모수를 추정하였다.
Yijklm=b0+Fi+Sj+Yk+Wl+b1Xm+am+eijklm
Table 1. Number of animals by sex, farm, birth year and end year in on-farm test
SEX No. of pigs Farm name No. of pigs Birth year No. of pigs End year No. of pigs
Female 11,959 A 7,003 2005 2,136 2005 1,097
Male 14,013 B 11,110 2006 1,822 2006 2,395
C 3,295 2007 3,668 2007 2,863
D 4,564 2008 3,092 2008 2,830
2009 4,124 2009 3,862
2010 3,977 2010 4,421
2011 3,840 2011 3,440
2012 3,313 2012 4,768
2013 296
Total 25,972 25,972 25,972 25,972
[Provider:earticle] Download by IP 118.70.52.165 at Monday, December 20, 2021 7:59 PM
www.earticle.net
여기서 b0는 전체평균, Fi는 i 번째 농장의 고정효과, Sj
는 j 번째 성의 고정효과, Yk는 k 번째 검정종료 년도의 고 정효과, Wl은 검정종료 주에 고정효과, b1은 검정종료체중 에 대한 1차 회귀계수, Xm은 검정종료체중의 공변이, am은 개체의 육종가로 임의효과이며 eijklmn는 임의 오차이다.
여기서, =유전력, =상가적 유전분산, =환경 효과 및 비상가적 유전효과에 의한 분산 그리고, 측정된 형질간의 유전상관 및 표현형 상관은 다음과 같이 구하였 다.
여기서, =유전상관, =표현형상관,=두 형 질간 표현형 공분산,=두 형질간 유전 공분산
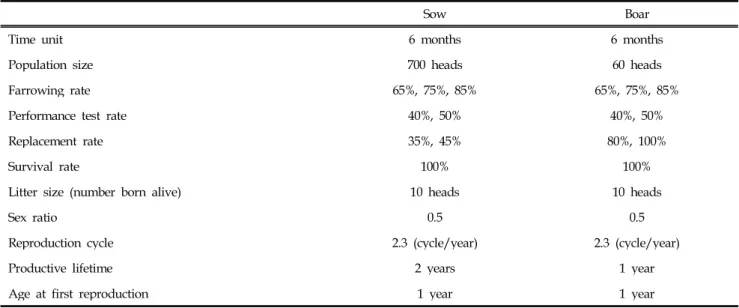
Table 2는 ZPLAN+ 프로그램을 활용하여 두록 품종의 모의시험에 사용한 모수이다. 집단의 크기는 각 종돈장의 두록 품종 사육규모를 고려하여 모돈 700두와 웅돈 60두로
설정하였으며 분만율은 수태율과 분만율을 함께 고려하여 65%, 75%, 85% 나타내었다. 번식간격은 첫 종부일로부터 다음 종부일까지 걸리는 시간으로 5.2개월 연 2.3회전 하는 것으로 설정하였고, 산자수는 두당 10두, 생산연한은 모돈 의 경우 2년으로, 웅돈의 경우 1년으로 하였으며 첫 번식 일령은 1년으로 설정하여 분만율과 검정비율, 갱신율의 변 화에 따른 유전적 개량량을 알아보았다.
본 연구는 두록 품종 부계 선발에 있어서 선발지수 개 발을 위한 모의시험으로써 형질별 가중치에 대한 유전적 개량량은 가축 육종체계에 대한 평가와 최적화를 위한 모 의시험 프로그램인 ZPLAN+(Täaubert 등, 2010)을 이용하 여 추정하였다. ZPLAN+는 VIT(Vereinigte Informations system Tierhaltung)에서 만들어진 것으로, 주어진 모수간 관계에 의해 새로운 모수값이 결정되는 확정적 모의시험 (deterministic simulation) 방법을 이용한다(Karras 등, 1994). 계획된 육종 프로그램과 이미 예측된 경제적 상황 구조하에서 개량효과가 얼마나 나타날 것인지를 판단할 수 있게 하며, 생물학적, 통계적, 경제적 모수를 이용하여 육종 목표에 대한 연간 유전적 개량량을 계산할 수 있으 며, 유전자 흐름 방법과(Hill, 1974) 선발지수 이론(Hazel 등, 1943)를 이용하여 투자대비 수익을 계산할 수 있다. 또 한, 모형을 계산할 때 수학 계산식을 일일이 나열하는 것 대신 육종 구조에 대한 값을 입력하게 하여 접근을 용이하 게 하였다.
Table 2. Parameters considered in the simulation
Sow Boar
Time unit 6 months 6 months
Population size 700 heads 60 heads
Farrowing rate 65%, 75%, 85% 65%, 75%, 85%
Performance test rate 40%, 50% 40%, 50%
Replacement rate 35%, 45% 80%, 100%
Survival rate 100% 100%
Litter size (number born alive) 10 heads 10 heads
Sex ratio 0.5 0.5
Reproduction cycle 2.3 (cycle/year) 2.3 (cycle/year)
Productive lifetime 2 years 1 year
Age at first reproduction 1 year 1 year
[Provider:earticle] Download by IP 118.70.52.165 at Monday, December 20, 2021 7:59 PM
www.earticle.net
Ⅲ. 결과 및 고찰
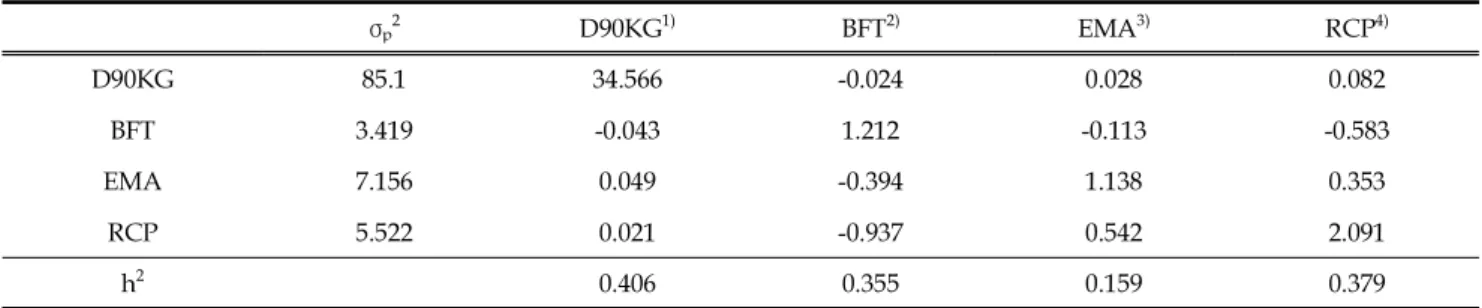
본 연구에서는 부계 선발 시 두록 품종에서의 가중치에 따른 세대당 유전적 개량량을 알아보기 위하여 주요 경제 형질인 90 kg 도달일령, 등지방두께, 등심단면적 및 정육 율에 대한 유전모수를 추정하여 ZPLAN+ 모의시험 프로 그램의 모수 입력에 사용하였다. 두록 품종에서 추정된 경 제 형질들에 대한 유전력과 유전분산, 각 형질들 간의 유 전상관과 표현형상관 및 표현형 표준편차의 추정치를 살 펴보면(Table 2), 90 kg 도달일령에서 추정된 유전력은 0.406이었고, 등지방두께 0.355, 등심단면적 0.159 및 정육
율에서 0.379로 나타났다. Fredeen과 Hitoshi(1986)가 90 kg 도달일령 유전력을 0.25, Li와 Kennedy(1994)가 100 kg 도달일령의 유전력이 0.26, Chen 등(2003)은 113.5 kg 도달 일령의 유전력이 0.35로 본 연구에서의 추정치와 비슷한 결과를 보였다. 90 kg 도달일령과 등지방두께, 등심단면적 및 정육율에서의 유전상관 추정치는 각각 -0.043, 0.049 및 0.021로 유전적 상관관계가 거의 없었으며, 등지방두께와 등심단면적, 정육율에서의 유전상관 추정치는 각각 -0.394 및 -0.937로 높은 부의 유전상관관계를 나타냈고, 등심단면 적과 정육율에서는 0.524로 중도의 유전적 상관관계를 갖 는 것으로 추정되었다.
Table 3. Genetic parameters used in the simulation for Duroc population
σp2 D90KG1) BFT2) EMA3) RCP4)
D90KG 85.1 34.566 -0.024 0.028 0.082
BFT 3.419 -0.043 1.212 -0.113 -0.583
EMA 7.156 0.049 -0.394 1.138 0.353
RCP 5.522 0.021 -0.937 0.542 2.091
h2 0.406 0.355 0.159 0.379
Genetic variance (diagonal), Penotypic correlation (upper diagonal), Genetic correlation (lower diagonal), σp2: Phenotypic variance
1) D90KG: Days to 90 kg,2) BFT: Backfat thickness, 3) EMA: Eye muscle area, 4) RCP: Retail cut percent Table 4. Estimates of genetic gain according to weights for selection on D90KG and BFT1)
Farrowing
rate Performance test rate
Replacement rate Index weight Selection
intensity
1 1 2 1 3 1
Sow Boar D90KG BFT D90KG BFT D90KG BFT Sow Boar
65
40 22.5 50 -2.204 -0.075 -2.235 -0.034 -2.240 -0.020 1.33 2.07
17.5 40 -2.354 -0.080 -2.386 -0.036 -2.393 -0.022 1.47 2.16
50 22.5 50 -2.344 -0.080 -2.376 -0.036 -2.382 -0.022 1.46 2.16
17.5 40 -2.486 -0.085 -2.521 -0.038 -2.527 -0.023 1.59 2.25
75
40 22.5 50 -2.294 -0.078 -2.326 -0.035 -2.332 -0.021 1.41 2.13
17.5 40 -2.439 -0.083 -2.473 -0.038 -2.479 -0.022 1.55 2.22
50 22.5 50 -2.429 -0.083 -2.462 -0.038 -2.469 -0.022 1.53 2.22
17.5 40 -2.567 -0.087 -2.603 -0.040 -2.610 -0.024 1.66 2.30
85
40 22.5 50 -2.371 -0.081 -2.403 -0.037 -2.410 -0.022 1.48 2.17
17.5 40 -2.512 -0.085 -2.547 -0.039 -2.553 -0.023 1.61 2.27
50 22.5 50 -2.502 -0.085 -2.537 -0.039 -2.544 -0.023 1.59 2.27
17.5 40 -2.638 -0.090 -2.674 -0.041 -2.681 -0.024 1.72 2.35
Accuracy 0.64 0.64 0.64
1) D90kg and BFT represent days to 90 kg and backfat thickness, respectively.
[Provider:earticle] Download by IP 118.70.52.165 at Monday, December 20, 2021 7:59 PM
www.earticle.net
Table 4에는 ZPLAN+ 프로그램으로 모의시험 결과 형질 별 경제 가중치에 따른 유전적 개량량을 나타낸 것이다. 90 kg 도달일령과 등지방두께의 가중치 비율이 1:1 그룹에 서는 분만율, 검정율, 갱신율에 따라 90 kg 도달일령의 유 전적 개량량이 -2.204일 부터 -2.638일까지 나타났고, 2:1 그룹에서는 -2.235일부터 -2.674일까지 나타났으며, 3:1 그 룹에서 등지방두께는 거의 변하지 않으면서 90 kg 도달일 령이 -2.240일 부터 -2.681일로 가장 크게 단축되는 것을 보 였다. Edwards 등(1971)은 90 kg 도달일령에서의 세대당 유전적 개량량이 -0.385일로, Hudson과 Kennedy(1985)는 Duroc 종에 대하여 -0.15일로 보고하였는데 본 연구에서는 보다 높은 정도의 개량량을 보이고 있다. Chen 등(2003)은 BLUP 선발을 통한 모의실험에서 113.5 kg 도달일령과 등 지방두께에서의 세대당 유전적 개량량이 –6.4일과 -1.26 mm로 보고하였으며, Cho 등(2001)은 시뮬레이션 방법에 따라 90 kg 도달일령에서의 세대당 유전적 개량량이 -6.4~-8.2일로 다른 연구 결과에 비해 매우 높은 개량량을 나타냈는데, 이는 높은 선발강도와 짧은 세대간격에 기인 한 결과라고 보고하였다. 또한 분만율과 검정비율이 높을 수록 모든 그룹에서 유전적 개량량이 증가했으며, 갱신율 은 높을수록 유전적 개량량이 조금 감소하는 것으로 나타 났다. 정확도는 0.64로 비슷하였으며, 선발강도는 암컷에서 1.33부터 1.72까지, 수컷에서는 2.07부터 2.35로 나타났다.
본 연구 결과에서 분만율과, 검정율, 선발강도에 따른 유전적 개량량의 차이는 있었지만 90 kg 도달일령과 등지 방두께의 가중치 비율이 3:1인 그룹에서 등지방두께는 거 의 변하지 않으면서 90 kg 도달일령이 높게 단축되는 것으 로 나타나 두록 품종에서 부계 선발 지수식으로 활용 될 수 있을 것으로 사료된다.
Ⅳ. 요약
본 연구에서는 두록품종의 종돈 선발 시 중요한 90 ㎏ 도달일령, 등지방두께 형질의 유전모수를 추정하고 경제형 질별 표준화 육종가에 가중치를 설정하여 ZPLAN+를 이 용한 모의시험을 통하여 경제형질별 유전적 개량량변화를 확인하여 부계선발지수식을 개발하고자 실시하였다. 분석 에 이용된 자료는 돼지개량네트워크 사업에 참여한 종돈 장에서 2005년부터 2012년 7월까지 농장검정한 두록 품종 25,972두에 대한 90 ㎏도달일령(D90KG)과 등지방두께 (BFT), 등심단면적(EMA) 및 정육율(RCP)의 자료와 27,734
두의 혈통 자료를 이용하여 유전모수를 추정하였고, 이와 함께 돼지개량 네트워크 구축 사업에 참여한 각 종돈장별 종돈의 분만율과 검정비율 및 갱신율 등을 종합한 뒤 모의 시험 프로그램인 ZPLAN+의 모수로 입력하여 90 kg 도달 일령과 등지방두께의 가중치에 따른 세대당 유전적 개량 량을 분석하였다. 유전모수 추정 결과 90 kg 도달일령, 등 지방두께, 등심단면적 및 정육율에서 추정된 유전력은 각 각 0.406, 0.355, 0.159 및 0.379로 나타났고, 유전상관은 90 kg 도달일령과 등지방두께, 등심단면적 및 정육율에서 각 각 -0.043, 0.049 및 0.021로, 등지방두께와 등심단면적, 정 육율에서는 각각 -0.394 및 –0.937로, 등심단면적과 정육 율에서는 0.524로 나타났다. ZPLAN+를 이용한 모의시험 에서는 분만율과, 검정율, 선발강도에 따른 유전적 개량량 의 차이는 있었지만 90 kg 도달일령과 등지방두께의 가중 치 비율이 3:1인 그룹에서 등지방두께는 거의 변하지 않으 면서 90 kg 도달일령이 높게 단축되는 것으로 나타나 두록 품종의 부계 선발 지수식으로 활용 될 수 있을 것으로 사 료된다.
사사
본 논문은 농촌진흥청 연구사업(과제번호: PJ008453, 국 가단위 돼지 및 닭 개량체계 구축 연구)의 지원에 의해 이 루어진 것임.
Ⅴ. REFERENCES
1. Chen, P., Baas, T. J., Dekkers, J. C. M., Koehler, K. J.
and Mabry, J. W. 2003. Evaluation of strategies for selection for lean growth rate in pigs. J. Anim. Sci.
81:1150-1157.
2. Cho, K. H., Kim, S. D., Kim, M. J., Lee, I. J. and Jeon, G. J. 2001. Changes of genetic improvement and predicted breeding values by various performance test methods for selection. J. Anim. Sci. Technol.
43(6):803-810.
3. Edwards, R. L. and Omtvedt, I. T. 1971. Genetic analysis of a swine controlpopulation. Ⅱ. Estimates of population parameters. J. Anim. Sci. 32:185-190.
4. Fredeen, H. T. and Hitoshi, M. 1986. Mass selection in
[Provider:earticle] Download by IP 118.70.52.165 at Monday, December 20, 2021 7:59 PM
www.earticle.net
a pig population: Correlated changes in carcass merit.
J. Anim. Sci. 62:1523-1532.
5. Hazel, L. N. 1943. The genetic basis for constructing selection indexes. Genetics 28:476-490.
6. Hill, W. G. 1974. Prediction and evaluation of response to selection with overlapping generations.
Anim. Prod. 18:117-139.
7. Hudson, G. F. S. and Kennedy, B. W. 1985. Genetic evaluation of swine for growth rate and backfat thickness. J. Anim. Sci. 61:83-91.
8. Karras, K., Niebel, E., Graser, H.-U., Bartenschlager, H. and Nitter, G. 1994. ZPLAN-PC program to optimise livestock selection programs. User's Guide for ZPLAN, Version November 1994, University Hohenheim.
9. Li, X. and Kennedy, B. W. 1994. Genetic parameters for growth rate and backfat in Canadian Yorkshire, Landrace, Duroc and Hampshire pigs. J. Anim. Sci.
72:1450-1454.
10. Meyer. K. 2007. WOMBAT—A tool for mixed model analyses in quantitative genetics by restricted maximum likelihood (REML). J. Zhejiang Univ. Sci.
B. 8:815-821.
11. Täaubert, H., Reinhardt, F. and Simianer, H. 2010.
ZPLAN+, a new software to evaluate and optimize animal breeding programs. Proc 9th WCGALP, Leipzig, Germany.
(Received 16 October 2013, Revised 09 June 2014, Accepted 10 June 2014)
[Provider:earticle] Download by IP 118.70.52.165 at Monday, December 20, 2021 7:59 PM