361
and Safety
Available online at http://www.foodhygiene.or.kr
https://doi.org/10.13103/JFHS.2018.33.5.361
총식이조사 자료를 이용한 음식별 니트로사민 함량 분포 규명
최슬기1·이영원1·서정은1·박종은1·이지연3·권훈정1,2*
1서울대학교 식품영양학과, 2서울대학교 생활과학연구소, 3한국보건산업진흥원
Elucidation of Dishes High in N-Nitrosamines Using Total Diet Study Data
Seul Ki Choi1, Youngwon Lee1, Jung-eun Seo1, Jong-eun Park1, Jee-yeon Lee3, and Hoonjeong Kwon1,2*
1Department of Food and Nutrition, Seoul National University, Seoul, Korea
2Research Institute of Human Ecology, Seoul National University, Seoul, Korea
3Bureau of Health Industry Policy, Korea Health Industry Development Institute, Cheongju, Korea (Received July 9, 2018/Revised July 27, 2018/Accepted August 10, 2018)
ABSTRACT - N-nitrosamines are probable or possible human carcinogens, which are produced by the reaction between secondary amines and nitrogen oxide in the acidic environment or by heating. Common risk assessment pro- cedure involves the comparison between exposures expressed in the unit, mg/kg body weight/day and the Health- Based Reference dose expressed in the same unit. This procedure is suitable for the policy decision-making and is considered as inappropriate for the consumers to get information about their dietary decision-making. Therefore, the distributions of NDMA (N-nitrosodimethylamine), NDBA (N-nitrosodibutylamine), the six N-nitrosamines (NDMA, NDBA, NDEA (N-nitrosodiethylamine), NPYR (N-nitrosopyrrolidine), NPIP (N-nitrosopiperidine), and NMOR (N- nitrosomorpholine) in the menus grouped based on the presence of main ingredients and cooking methods were ana- lyzed to generate consumer-friendly information regarding food contaminants. Recipes and intakes were taken from 2014 to 2016 KNHANES (The Korean National Health and Nutrition Examination Survey) and only the data from ages of 7 years or older were used. The contamination data were collected from the 2014~2016 Total Diet Study and all the analysis were performed using R software. Rockfish, eel, anchovy broth and pollock were mainly exposed to N-nitrosamines. In terms of cooking methods, soups and stews appeared to contain the highest amount of N-nitro- samines. Cereals, fruits, and dairy products in the ingredient categories, and rice dishes and rice combined with others in recipe categories had the lowest level exposure to N-nitrosamines. In case of N-nitrosamines, unlike other cooking related food contaminants, boiled dishes such as soups and stews and dishes mainly consisting of fishes and shell- fishes had highest level of exposure, showing a large discrepancy with the previous thought of processed meat is the main source of N-nitrosamines.
Key words : N-nitrosamine, Distribution, Total Diet Study
니트로사민은 ‘R1N(-R2)-N=O’ 형태의 구조를 갖는 화합 물로1) amine nitrogen에 대한 치환기에 따라서 화학적 혹 은 물리적인 특징이 다양하고2) 담배, 맥주, 베이컨 등 광 범위한 생활환경 내에 존재한다3-5).
랫드, 토끼, 마우스, 기니피그 및 개를 20~40 mg/kg의 니 트로사민에 노출시킨 결과, 간 괴사가 유발되었다는 연구 결과가 밝혀지면서 니트로사민의 발암성에 주의를 기울이 기 시작했다6). 니트로사민은 식품을 통해서 쉽게 노출될
수 있는데7) 식품 중에서 발암성을 지닌 니트로사민 종류 로는 NDMA (N-nitrosomethylamine), NDEA (N-nitro- sodiethylamine), NDBA (N-nitrosodibutylamine), NPYR (N-nitrosopyrrolidine), NPIP (N-nitrosopiperidine), NMOR (N-nitrosomorpholine), NPRO (N-nitrosoproline)이 있다8,9). WHO/IARC (International Agency for Research on Cancer) 에 따르면 NDMA, NDEA를 인체 발암에 유력한 인체발 암추정물질(Group 2A)로 분류하였고 NDBA, NPYR, NPIP, NMOR은 인체 발암에 가능한 인체발암가능물질(Group 2B)로 구분한 반면에 NPRO는 인체 발암 가능 근거자료 가 없는 물질(Group 3)로 구별되어 있다10).
지금까지 이루어진 니트로사민 섭취량에 대한 평가로는 2009년 식품의약품안전청 (현 식품의약품안전처)에서 7종
*Correspondence to: Hoonjeong Kwon, Department of Food and Nutrition, Seoul National University, 1 Gwanak-ro, Gwanak-gu, Seoul 08826, Korea
Tel: 82-2-880-6835, Fax: 82-2-884-7555 E-mail: [email protected]
니트로사민(NDMA, NDEA, NDBA, NPYR, NPIP, NMOR, NDPA (N-nitrosodipropylamine)) 노출량을 측정한 결과, 평 균 노출량이 4.92 × 10⁻⁷mg/kg body weight/day로 보고되 었다11). 2013~2015년 총식이조사에 자료를 이용한 2016년 니트로사민류 위해평가 보고서에서는 국민 평균 7종 니트 로사민(NDMA, NDEA, NDBA, NPYR, NPIP, NMOR, NMEA (N-nitrosomethylethylamine)) 노출량은 1.89 × 10⁻⁵ mg/kg body weight/day 그리고 NDMA노출량은 1.16 × 10⁻⁵ mg/kg body weight/day로 보고되었다12). 앞의 2009년 보 고서는 총 13종 154건의 시료(식육가공품 3종 51건, 어육 가공품 3종 62건, 젓갈류 5종 20건, 음료·주류 2종 21건) 를 대상으로 니트로사민 노출량 평가를 진행한 반면 총식 이조사를 이용한 니트로사민류 위해평가 보고서는 6개년 도 국민건강영양조사에서 섭취량 누적 비율이 95% 까지 되는 식품(다소비 식품), 섭취자 비율이 1% 이상인 식품 (다빈도 식품), 지방 섭취량 누적 기여비가 90% 까지 되 는 식품을 대표 샘플로 정하고 조리된 상태에서 오염물질 의 농도를 측정함으로써 현실에 근접한 자료를 생산한 것 이 특징이다. 본 연구에서는 대상 식품의 범위가 높고, 조 리 상태까지 반영한 총식이조사 원자료를 사용하였다.
다만 이와 같은 일부 선행 연구들의 결과는 국민 체중 당 니트로사민 노출량을 확인한 방법으로 동물 실험의 데 이터와 인체 노출량을 비교하여 정책 결정의 수단으로는 유용하나 실제로 섭취하는 음식 내의 니트로사민 함량에 대한 직관적 정보가 주어지지 않아 식생활 교육 자료로 사용하기에는 어려운 점이 있다. 그러므로 본 연구에서는 국민건강영양조사에 나타난 다양한 음식들의 니트로사민 함 량을 총식이조사 자료를 기반으로 추산하고자 하였다13-17). 음식내 니트로사민의 함량(NDMA, NDBA, NDEA, NPYR, NPIP, NMOR) 분포를 주재료 및 조리법 별로 파악하여 소비자들이 음식 선택 시 사용할 수 있는 안전정보를 제 공하는 것이 본 연구의 목적이다.
Materials and Methods
연구 대상
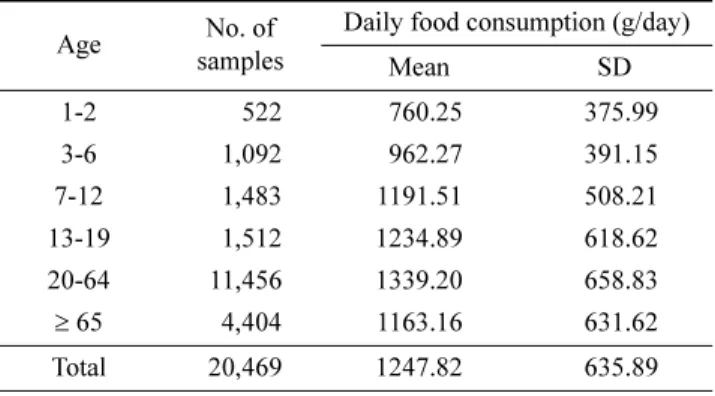
본 연구는 2014~2016년의 국민건강영양조사 24시간 회 상법 자료를 통합하여 사용하였다18-20). 국민건강영양조사 에 참여한 대상을 만 1~2세, 만 3~6세, 만 7~12세, 만 13~19세, 만 20~64세, 및 만 65세 이상으로 나눠서 연령 별 하루 동안 섭취한 식품의 양을 분석한 결과, 만 1~2세 와 만 3~6세를 제외한 전 연령대의 섭취량이 동일하여 1 일 음식 섭취량 5~95 백분위수 사이에 분포하는 만 7세 이상 전 연령대의 사람이 섭취하는 음식을 최종 연구 대 상으로 사용하였다(Table 1).
음식내 니트로사민 함량 산출
각 식품 별 NDMA, NDEA, NDBA, NPYR, NPIP, NMOR 의 농도 값은 선행 총 식이조사연구의 결과를 사용하였
다13-17). 일반적으로 섭취되는 음식의 니트로사민 농도에
대한 분포 조사가 목적이므로 환자용식품, 특수용도식품, 및 일반의약품은 제외하였고 국민건강영양조사 섭취량 데 이터에 있는 식품 목록이지만 니트로사민이 분석치가 존 재하지 않는 경우 맵핑 기법을 도입하였다.
맵핑 기법은 특정 식품 내의 분석 결과값을 분석치가 없는 국민건강영양조사 자료의 개인별 식품 섭취량 데이 터에 대입하는 방법으로21) 니트로사민이 오염물질이라는 조건 하에22)분석된 샘플과 생태학적 분류기준 및 오염 경 로가 비슷한 식품에 대입하였다. 조리법의 경우에도 해당 식품 내에서 가장 유사한 조리법으로 맵핑하였다.
국민건강영양조사에 나열되어 있는 각 음식별 식재료 섭 취량에 선행 총식이조사 연구에서 측정된 각 식재료 별 해당조리법에 따른 니트로사민 함량을 곱한 후 해당 음식 중 모든 식재료들의 니트로사민 함량을 합쳐서 음식 한 그릇 내의 니트로사민 함량을 도출하였다.
음식의 주재료 및 조리법 구분 기준
주재료별 니트로사민 함량 분포를 알아보기 위해, 국민 건강영양조사 중의 섭취 음식을 주재료별로 분류하였다.
이 때 물을 제외한 식재료의 총합 중 35% 이상을 차지하 는 식재료를 주재료로 삼았다. 음식에 따라서는 하나의 주 재료 보다는 여러 재료의 비율이 비슷하게 포함되는 경우 가 있으므로, 35% 이상을 차지하는 재료가 없는 음식의 경우 총량의 20% 이상이 사용된 모든 식재료를 주재료로 정하여 주재료별 음식을 분류하였다.
조리법은 국민건강영양조사 자료 내 ‘음식군분류’에 따 라서 분류하였다. 음식별 분류에 따라 1회 섭취량에 대한 분포를 파악한 후, 1회 섭취량의 5~95 백분위수에 속하는 값을 대상으로 음식 내 니트로사민 함량의 분포를 산출하 였다.
Table 1. Total daily food consumption by age groups
Age No. of
samples
Daily food consumption (g/day)
Mean SD
1-2 522 760.25 375.99
3-6 1,092 962.27 391.15
7-12 1,483 1191.51 508.21
13-19 1,512 1234.89 618.62
20-64 11,456 1339.20 658.83
≥ 65 4,404 1163.16 631.62
Total 20,469 1247.82 635.89
데이터 처리 방법
데이터 분석은 R version 3.4.2 for windows 1023)을 기본 으로 사용자의 편리성을 제공하는 R studio version 1.1.383 for windows 1024)을 사용하였다.
Results and Discussion
주재료 및 조리법에 따른 NDMA의 함량 분포
총식이조사에서 가장 검출빈도가 높았던 NDMA와
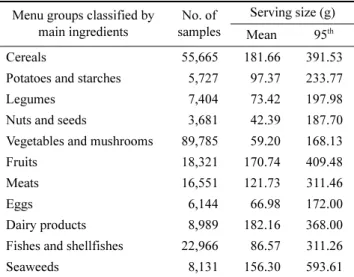
NDBA12)및 6종 니트로사민의 합에 대한 함량 분포를 분 석하였으며, 소비자의 이해가 직관적일 수 있도록 한끼(1 회) 섭취량에 대한 니트로사민 양을 산출하고 각 음식군 에 따른 serving size를 함께 보고하였다(Table 2,3).
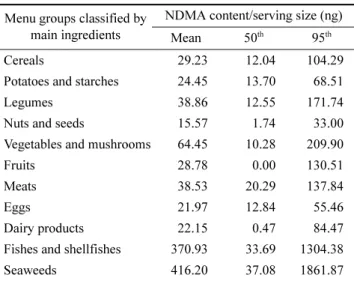
주재료별 한끼 식사량당 NDMA 노출량에 대한 평균, 중앙값 그리고 95 백분위수를 Table 4에 제시하였다. 어 패류(370.93 ng/serving size) 및 해조류(416.20 ng/serving size)가 주재료인 음식은 한끼 섭취량에 비해 NDMA의 평 균 함량이 높게 나타났다. 그러나 과실류(28.78 ng/serving size)·곡류(29.23 ng/serving size)·유제품류(22.15 ng/serving size)를 주재료로 하는 음식은 한끼 섭취량이 높아도 자체 내의 NDMA의 평균 함량이 적어 음식에 기여하는 정도 가 낮았으며 95 백분위수도 비슷한 경향을 보였다(Table 2,4). 어패류 및 해조류가 주재료인 음식 중 모두 함께 사 용한 어패류의 영향이 가장 큰 것으로 나타났으며, 특히 멸치 육수와 볼락, 바다, 명태를 끓이는 경우 및 구운 명 태의 기여도가 높은 것으로 확인되었다.
조리법별 한끼 식사량당 NDMA 노출량에 대한 평균, 중앙값 그리고 95 백분위수를 Table 5에 제시하였다. 찌 개 및 전골류(294.86 ng/serving size)와 국 및 탕류(206.33 ng/serving size)는 섭취량에 비해서 NDMA의 평균 함량이 높이 나타났다. 찌개 및 전골류에서는 매운탕 내의 끓인 볼락의 높은 NDMA 함량 및 음식 중 주재료로 차지하는 비율이 높아 음식 내 NDMA 함량 분포에 크게 기여한 것 으로 드러났다. 국 및 탕류에서는 일부 된장국, 미역국 등 Table 2. Serving size of menus reported in KNHANES (2014-
2016) grouped by main ingredients Menu groups classified by
main ingredients
No. of samples
Serving size (g) Mean 95th
Cereals 55,665 181.66 391.53
Potatoes and starches 5,727 97.37 233.77
Legumes 7,404 73.42 197.98
Nuts and seeds 3,681 42.39 187.70
Vegetables and mushrooms 89,785 59.20 168.13
Fruits 18,321 170.74 409.48
Meats 16,551 121.73 311.46
Eggs 6,144 66.98 172.00
Dairy products 8,989 182.16 368.00
Fishes and shellfishes 22,966 86.57 311.26
Seaweeds 8,131 156.30 593.61
Table 3. Serving size of menus reported in KNHANES (2014-2016) grouped by cooking methods
Menu groups classified by cooking methods No. of samples Serving size (g)
Mean 95th
Rice dishes 36,469 202.98 397.06
Rice combined with others 3,420 246.76 576.82
Porridges (including Western styles) 1,042 140.65 367.28
Noodles and dumplings 8,620 181.22 476.06
Bread and confectionery 9,375 110.56 327.64
Soups 13,398 111.58 328.02
Stews 9,586 115.89 275.46
Boiled down in sauces 5,284 45.50 121.04
Braised 4,798 109.19 310.09
Sauté 12,626 66.22 227.34
Grilled 11,939 95.53 246.68
Pan-fried 5,513 59.14 159.14
Deep-fried 4,345 113.45 333.44
Cooked vegetables 10,452 34.50 87.36
Salad (including Korean and Western styles) 9,720 47.09 130.65
Pickled 6,126 20.94 59.72
Kimchi 35,051 66.19 169.37
Salted and fermented seafoods 2,082 13.40 51.39
Beverages (non-alcoholic) 19,299 154.18 507.51
에 포함된 볼락과 더불어 일반적으로 사용되는 명태 그리 고 멸치 육수가 주요 원인으로 파악되었다. 그러나 재료 가 한정적인 밥류(17.16 ng/serving size)의 NDMA 함량이 예상대로 매우 낮게 나타났으며 비빔밥, 덮밥 등 밥에 다 른 재료를 섞어 한끼 식사를 제공하는 음식군(36.10 ng/
serving size)은 다양한 재료와 섭취량에 불구하고 NDMA 의 함량은 높지 않았다. 그리고 음료류(136.20 ng/serving size)는 원두커피, 알커피 등 커피류의 영향으로 섭취량에 따라 NDMA 함량이 증가하는 것으로 나타났다. 주류에서
는 NDMA가 검출되지 않았다13-17). 95 백분위수도 비슷한 성향을 보였다(Table 3,5). 몇몇 선행연구에서 커피 중 NDMA 함량이 Not detected~0.11 ng/g으로 검출된 바와 비
교하여25,26) 훨씬 높은 NDMA의 수치가 관찰되었다. 이는
NDMA가 불검출이었던 알커피에 비해 끓인 물과 혼합한 커피에서 높은 양의 NDMA가 검출된 결과(206.42 ng/g)에 따른 것으로13-15), 0.0261~0.112 ng/g의 NDMA가 정수장 및 수돗물에서 보고된 선행연구 결과와 종합할 때 음료에서 사용되는 물이 NDMA 함량에 영향을 준 것으로 추측된 다27). 수산물에는 2차 아민인 Dimethylamine (DMA), 3차 아민인 Trimethylamine (TMA), 그리고 Trimethylamine oxide (TMAO)가 함유되어 있는데28) 이들이 NDMA를 형 성하는 전구체로 작용할 수 있다고 알려져 있다29,30).DMA 는 아질산염 이온과 반응하여 NDMA를 형성되는 기전이 있어 수산물에서 NDMA 함량이 높게 검출되는 것으로 사 료된다2).
주재료 및 조리법에 따른 NDBA의 함량 분포
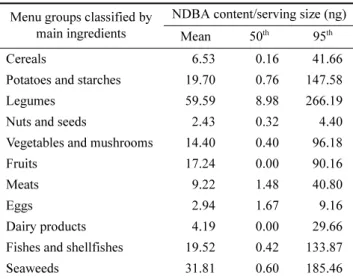
주재료별 한끼 식사량당 NDBA 노출량에 대한 평균, 중 앙값 그리고 95 백분위수를 Table 6에 제시하였다. 주재 료를 기준으로 분류한 음식 내 NDBA의 평균 함량을 살 펴보면 두류가 주재료인 음식에서 가장 높게 나타났으며 (59.59 ng/serving size), 뒤를 이어 해조류(31.81 ng/serving size)의 평균이 2위를 차지하였다. 두류 주재료 음식군은 섭취량에 비해 NDBA 함량이 높았고 이는 된장찌개나 청 Table 4. Estimated NDMA content/serving size in menu groups
classified by main ingredients Menu groups classified by
main ingredients
NDMA content/serving size (ng)
Mean 50th 95th
Cereals 29.23 12.04 104.29
Potatoes and starches 24.45 13.70 68.51
Legumes 38.86 12.55 171.74
Nuts and seeds 15.57 1.74 33.00
Vegetables and mushrooms 64.45 10.28 209.90
Fruits 28.78 0.00 130.51
Meats 38.53 20.29 137.84
Eggs 21.97 12.84 55.46
Dairy products 22.15 0.47 84.47
Fishes and shellfishes 370.93 33.69 1304.38
Seaweeds 416.20 37.08 1861.87
Table 5. Estimated NDMA contents/serving size in menu groups classified by cooking methods
Menu groups classified by cooking methods NDMA content/serving size (ng)
Mean 50th 95th
Rice dishes 17.16 6.86 53.84
Rice combined with others 36.10 23.88 82.57
Porridges (including Western styles) 66.20 14.03 306.15
Noodles and dumplings 93.05 30.54 370.66
Bread and confectionery 31.68 21.27 97.35
Soups 206.33 34.52 1084.26
Stews 294.86 52.94 731.79
Boiled down in sauces 86.49 6.88 319.35
Braised 7.22 0.87 30.42
Sauté 15.05 8.36 48.05
Grilled 131.20 19.04 188.92
Pan-fried 21.48 11.92 64.47
Deep-fried 85.94 30.15 191.73
Cooked vegetables 7.32 2.34 34.22
Salad (including Korean and Western styles) 19.65 6.33 47.38
Pickled 7.59 4.46 26.00
Kimchi 96.13 51.03 306.16
Salted and fermented seafoods 8.71 2.44 33.19
Beverages (non-alcoholic) 136.20 8.40 557.33
국장찌개의 된장과 청국장의 NDBA 함량이 많기 때문이 었다. 반면에 해조류 음식군 역시 함께 사용한 장류의 기 여로 드러났다13). 이에 반해 유제품류 음식군(4.19 ng/serving size) 및 곡류 음식군(6.53 ng/serving size)은 많이 섭취하 더라도 유제품 및 곡류 자체의 NDBA 함량이 낮아서 이 들 음식군들의 NDBA 함량이 낮음을 알 수 있다(Table 2,6).
조리법별 한끼 식사량당 NDBA 노출량에 대한 평균, 중 앙값 그리고 95 백분위수를 Table 7에 제시하였다. 조리 법에 따른 음식 내 NDBA의 평균 함량은 찌개 및 전골류
(71.75 ng/serving size), 국 및 탕류(48.31 ng/serving size)의 NDBA 함량이 높은 것을 볼 수 있으며, 이 역시 된장과 청국장의 영향으로 드러났다. 그러나 다른 조리법들의 경 우 음식군 한끼 식사량과 함량이 비례하는 것으로 특정 원료 또는 조리법의 따른 특징은 없는 것으로 나타났다 (Table 3,7). 조리법에 따른 분류에서도 기여 요인이 끓인 된장 및 청국장으로 나타나는 것으로 보아 NDBA 함량은 재료 조합보다는 특정 재료의 유무가 좌우하는 것임을 알 수 있었으며 조리하지 않은 된장과 청국장보다 끓인 된장 및 청국장 샘플 내의 NDBA의 함량이 더 높게 나타난 것 으로 보아 식수 내에 오염된 니트로사민의 영향이나 또는 그 전구체가 가열 중 반응에 의해 니트로사민을 생성했을 가능성도 무시할 수 없다31).
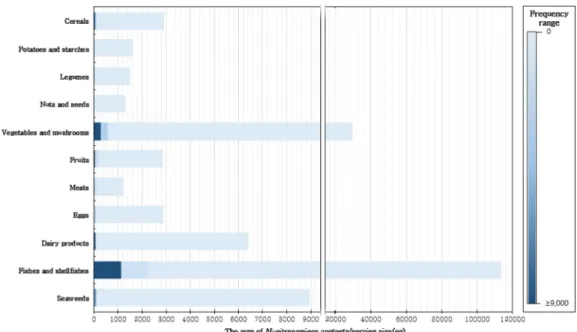
주재료 및 조리법에 따른 6종 니트로사민 합에 대한 함량 분포 6종 니트로사민 합에 대한 음식별 함량 분포는 검출 빈 도와 양이 높은 NDMA의 영향을 크게 받아 이 분포와 유 사하게 나타났다. 주재료에 따른 음식군의 6종 니트로사 민 합에 대한 함량 분포를 보면 어패류, 채소류 및 버섯 류, 해조류 순으로 분포가 넓게 퍼져있다는 것을 확인할 수 있다(Fig. 1). 어패류가 주재료인 음식 중 북어구이 및 장어탕 그리고 채소류 및 버섯류가 주재료인 음식 중 매 운탕이 속하는데 이들 음식에는 공동으로 사용된 식재료 인 어패류가 분포 결과에 기여한 것으로 판단된다. 그러 나 곡류·과실류·유제품류는 니트로사민 섭취량에 크게 Table 6. Estimated NDBA content/serving size in menu groups
classified by main ingredients Menu groups classified by
main ingredients
NDBA content/serving size (ng) Mean 50th 95th
Cereals 6.53 0.16 41.66
Potatoes and starches 19.70 0.76 147.58
Legumes 59.59 8.98 266.19
Nuts and seeds 2.43 0.32 4.40
Vegetables and mushrooms 14.40 0.40 96.18
Fruits 17.24 0.00 90.16
Meats 9.22 1.48 40.80
Eggs 2.94 1.67 9.16
Dairy products 4.19 0.00 29.66
Fishes and shellfishes 19.52 0.42 133.87
Seaweeds 31.81 0.60 185.46
Table 7. Estimated NDBA content/serving size in menu groups classified by recipes
Menu groups classified by cooking methods NDBA content/serving size (ng)
Mean 50th 95th
Rice dishes 6.33 0.00 42.69
Rice combined with others 18.69 5.20 76.29
Porridges (including Western styles) 11.23 2.22 46.32
Noodles and dumplings 7.73 1.91 42.70
Bread and confectionery 3.58 0.31 15.65
Soups 48.31 3.62 219.01
Stews 71.75 5.82 332.23
Boiled down in sauces 1.46 0.44 6.67
Braised 7.22 0.87 30.42
Sauté 2.13 0.27 8.69
Grilled 1.43 0.33 5.47
Pan-fried 1.24 0.52 5.02
Deep-fried 8.37 0.97 12.96
Cooked vegetables 1.32 0.06 3.95
Salad (including Korean and Western styles) 4.73 1.20 25.23
Pickled 2.91 0.99 17.69
Kimchi 1.95 0.00 2.53
Salted and fermented seafoods 0.22 0.00 1.12
Beverages (non-alcoholic) 0.22 0.00 0.00
기여하지 않는 식품군으로 나타났다.
조리법에 따른 음식군의 6종 니트로사민 합에 대한 분 포를 보면 찌개 및 전골류, 구이류, 국 및 탕류의 순으로 넓게 퍼졌다는 것을 알 수 있다(Fig. 2). 앞서 NDMA, NDBA의 개별 화합물의 경우와 크게 다르지 않은 결과를 볼 수 있는데 볼락, 장어, 명태, 멸치 등 대부분 어패류의 기여도가 크게 나타났다. 이처럼 조리법보다 음식 내 함 유된 특정 식재료가 음식의 니트로사민 함량에 차이를 두 는 것으로 밝혀졌다.
총식이조사 분석치의 식품별 함량의 경우 끓인 가다랑
어, 조미가루, 볶은 새우자건품은 높은 NDMA의 함량을
보였으나13-15) 실제 국민건강영양조사에서 조사된 음식에
사용된 양이 낮아 음식 내 니트로사민 함량에 기여하는 정도는 낮았다. 또한 모든 음식을 통틀어서 니트로사민의 함량을 고려할 때, 니트로사민은 조리 중 생성되는 다른 오염물질들과는 달리 주로 끓인 음식 종류에서 많이 관찰 되며 식재료 중에서는 어류가 특히 높은 기여율을 보이고 있다. 다른 니트로사민류보다 식품 내에서 높은 농도로 자 주 검출되었던 NDMA는32) 마우스에 50ppm을 5달 동안 경구 투여했을 때, 4마리는 폐에 선암(adenocarcinomas), Fig. 1. The distribution of the sum of six N-nitrosamines contents/serving size by main ingredients.
Fig. 2. The distribution of the sum of six N-nitrosamines contents/serving size by cooking methods.
21마리에 다중 샘종(multiple adenomas), 2마리에 악성 신 장 종양 및 악성 간 종양을 발생시킨 발암물질이다33). 랫 드에서도 30주 음용수를 통한 투여로 간 종양 유발이 보 고되었다34). 따라서 본 연구에서는 단순히 6종 니트로사민 의 함량을 합쳐서 분포를 분석했으나 니트로사민류 중 독 성이 가장 큰 NDMA가 가장 중요한 비중을 차지할 것으 로 생각되며, 이를 기준으로 각 니트로사민 별 독성에 따 른 환산치를 곱하여 독성 등가량(Toxic Equivalents, TEQ) 을 고려한 니트로사민 함량을 확인하는 후속연구가 필요할 것으로 생각된다.
Acknowledgement
본 연구는 2015년도 식품의약품안전처의 연구개발비 (13162KFDA049)로 수행되었으며 이에 감사드립니다.
국문요약
니트로사민은 산성이나 열을 가했을 때 2급 아민과 질 소산화물이 반응해서 생성되는 발암물질이다. 일반적으로 위해 물질에 대한 안전성평가는 그 노출량을 mg/kg body weight/day로 산출하여 독성기준치와 비교하는 방법을 사 용한다. 이런 방법은 정책 근거자료로는 적합하나 소비자 들에게 식생활 정보로 제공하기에 미진한 부분이 있다. 따 라서 주재료 및 조리법으로 분류한 음식군에 대한 NDMA (N-nitrosodimethylamine), NDBA (N-nitrosodibutylamine) 및 6종 니트로사민(NDMA, NDBA, NDEA (N-nitroso- diethylamine), NPYR (N-nitrosopyrrolidine), NPIP (N-nitroso- piperidine), NMOR (N-nitrosomorpholine) 함량 분포를 파 악하여 식습관 교육에 도움을 주고자 본 연구를 실시하였 다. 2014~2016년 국민건강영양조사 24시간 회상법 자료를 사용하여 만 7세 이상을 연구 대상으로 음식별 레시피와 섭취량을 추출하였고, 2013~2015년 총식이조사 원자료를 바탕으로 음식 한끼니 제공량 내 니트로사민 함량 분포를 R프로그램으로 산출하였다. 볼락, 장어, 멸치 육수, 명태 등의 기여로 어패류 및 해조류를 주재료로 한 음식군은 섭취량과 상관없이 NDMA, NDBA 및 총 6종 니트로사민 모두에 대한 노출을 높이는 것으로 나타났다. 또한 조리 법에 따른 분류에서는 국 및 탕류와 찌개 및 전골류가 가 장 크게 노출에 기여하는 것으로 나타났다. 곡류, 과실류 및 유제품류 주재료 음식군, 밥류 및 밥 외의 다른 재료 를 부가한 음식군들의 니트로사민 노출에 대한 기여도는 매우 낮은 것으로 나타났다. 니트로사민의 경우 조리시 생 성되는 여타 화합물과는 달리 국, 탕, 찌개, 전골 등 끓임 을 주로 하는 음식과 어패류를 주재료로 하는 음식에서의 기여율이 매우 높은 것으로 나타났으며, 이는 기존에 가
공육류를 니트로사민의 주노출원으로 생각하던 것과는 매 우 큰 차이를 보인다.
References
1. Rostkowska K., Zwierz K., Rozanski A., Moniuszko-Jako- niuk J., Roszczenko A.: Formation and Metabolism of N- Nitrosamines. Polish Journal of Environmental Studies. 7, 321-326 (1998).
2. Scanlan R.A. ,Issenberg P.: Nnitrosamines in foods. Critical Reviews in Food Science & Nutrition. 5, 357-402 (1975).
3. Hecht S.S.: DNA adduct formation from tobacco-specific N- nitrosamines. Mutation Research/Fundamental and Molecu- lar Mechanisms of Mutagenesis. 424, 127-142 (1999).
4. William L.: N-Nitroso compounds in the diet. Mutation Research/Genetic Toxicology and Environmental Mutagene- sis. 443, 129-138 (1999).
5. Glória M.B.A., Barbour J.F., Scanlan R.A.: Volatile nitro- samines in fried bacon. Journal of Agricultural and Food Chemistry. 45, 1816-1818 (1997).
6. Barnes J.M., Magee P.N.: Some toxic properties of dimeth- ylnitrosamine. British Journal of Industrial Medicine. 11, 167 (1954).
7. Tricker A.R., Preussmann R.: Carcinogenic N-nitrosamines in the diet: occurrence, formation, mechanisms and carcino- genic potential. Mutation Research/Genetic Toxicology. 259, 277-289 (1991).
8. Walker R.: Nitrates, nitrites and Nnitrosocompounds: A review of the occurrence in food and diet and the toxicological implications. Food Additives & Contaminants. 7, 717-768 (1990).
9. Stuff J.E., G.T.Eugenia, Stephanie B.L., Bondy M.L., For- man M.R.: Construction of an N-nitroso database for assess- ing dietary intake. Journal of Food Composition and Analysis.
22, S42-S47 (2009).
10. IARC: Agents classified by the IARC monographs 1-121, Available from: http://monographs.iarc.fr/ENG/Classifica- tion/latest_classif.php. Accessed June 21 (2018).
11. KFDA: Exposure assessment of N-nitrosamines in foods for review regulation, Seoul, Republic of Korea, Korea Food and Drug Administration, No. 09071KFDA153 (2009).
12. MFDS: Risk assessment of Nitrosamines, Chungcheongbuk- do, Republic of Korea, Ministry of Food and Drug Safety (2016).
13. Seo J.E.: Method development for determining seven N-nit- rosamines and its application to agricultural food products.
Master's Dissertation, Seoul National University Graduate (2015).
14. Park J.E.: Method development for determining N-nitro- samines and its application to animal food products. Master's Dissertation, Seoul National Univerisity Graduate (2016).
15. Lee Y.W.: Total diet study of N-nitrosamines in marine food and exposure assessment for Korean population. Master's
Dissertation, Seoul National Univerisity Graduate (2017).
16. Seo J.E., Park J.E., Lee J.Y., Kwon H.J.: Determination of seven N-nitrosamines in agricultural food matrices using GC- PCI-MS/MS. Food Analytical Methods. 9, 1595-1605 (2016).
17. Park J.E., Seo J.E., Lee J.Y., Kwon H.J.: Distribution of seven N-nitrosamines in food. Toxicological Research. 31, 279 (2015).
18. MHW, KCDC: The Sixth Korea National Health and Nutri- tion Examination Survey (KNHANES VI-2), Available from:
https://knhanes.cdc.go.kr. Accessed January 12 (2018).
19. MHW, KCDC: The Sixth Korea National Health and Nutri- tion Examination Survey (KNHANES VI-3), Available from:
https://knhanes.cdc.go.kr. Accessed January 12 (2018).
20. MHW, KCDC: The Seventh Korea National Health and Nutrition Examination Survey (KNHANES VII-1), Available from: https://knhanes.cdc.go.kr. Accessed January 12 (2018).
21. Moy G.G., Vannoort R.W. Total diet studies. Springer, pp. 4- 437 (2016).
22. Loeppky R.N. Nitrosamine and N-nitroso compound chem- istry and biochemistry: advances and perspectives. ACS Publications, pp. 1-18 (1994).
23. R: A language and environment for statistical computing, Available from: http://www.R-project.org. Accessed January 12 (2018).
24. RStudio: Integrated Development for R, Available from:
http://www.rstudio.com. Accessed February 13 (2017).
25. Tricker AR., Pfundstein B., Theobald E., Preussmann R., Spiegelhalder B.: Mean daily intake of volatile N-nitro- samines from foods and beverages in West Germany in 1989- 1990. Food and Chemical Toxicology. 29, 729-732 (1991).
26. Biaudet H., Mavelle T., Debry G.: Mean daily intake of N- nitrosodimethylamine from foods and beverages in France in
1987-1992. Food and Chemical Toxicology. 32, 417-421 (1994).
27. Han K.C., Kim H.K.: Optimization of analytical conditions for the determination of nitrosamines in chlorinated tap water by high performance liquid chromatography Analyti- cal Science & Technology. 23, 551-559 (2010).
28. Sung N.J., Kang S.K., Lee S.J, Kim S.H.: The factors for the formation of carcinogenic N-nitrosamine from dried marine food products. Korean Journal of Fisheries and Aquatic Sci- ences. 27, 247-258 (1994).
29. daCosta K.A., Vrbanac J.J., Zeisel S.H.: The measurement of dimethylamine, trimethylamine, and trimethylamine N-oxide using capillary gas chromatography-mass spectrometry. Ana- lytical Biochemistry. 187, 234-239 (1990).
30. Bulushi I.A., Poole S., Deeth H.C., Dykes G.A.: Biogenic amines in fish: roles in intoxication, spoilage, and nitro- samine formation-a review. Critical Reviews in Food Sci- ence and Nutrition. 49, 369-377 (2009).
31. Wang W., Ren S., Zhang H., Yu J., An W., Hu J., Yang M.:
Occurrence of nine nitrosamines and secondary amines in source water and drinking water: Potential of secondary amines as nitrosamine precursors. Water Research. 45, 4930- 4938 (2011).
32. Doma ska K., Kowalski B.: Occurence of volatile N- nitrosoamines in Polish processed meat products. Bulletin of the Veterinary Institute in Pulawy. 47, 507-514 (2003).
33. TAKAYAMA S., OOTA K.: Malignant tumors induced in mice fed with N-nitrosodimethylamine. GANN Japanese Journal of Cancer Research. 54, 465-472_463 (1963).
34. Lijinsky W., Reuber M.D.: Carcinogenesis in rats by nitro- sodimethylamine and other nitrosomethylalkylamines at low doses. Cancer Letters. 22, 83-88 (1984).
n′