INTRODUCTION
Wastewater discharged into the aquatic envi- ronment can contaminate surface and ground water, degrading the quality of drinking water supplies. The conventional wastewater treat- ment plants can be applied to treat wastewater in densely populated urban areas while decen- tralized wastewater treatment system can be used to treat relatively small volume of waste-
water generated from rural dwellings. Decentral- ized wastewater treatment systems are individ- ual on-site or clustered wastewater systems used to treat wastewater from individual dwellings or small communities. Among the systems, the sep- tic system is most commonly used to treat sewage and wastewater. In the septic system, a raw sewage is treated biologically in the septic tank under the anaerobic condition and subsequently discharged to leaching field or tile bed for further aerobic treatment (Butler and Payne, 1995). De-
─
─ 489 ─ ─
Development of Natural and Ecological Wastewater Treatment System for Decentralized Regions
and Rural Communities
Kim, Song-Bae, Chun-Gyeong Yoon 1, *, Tae-Young Kwon 2 and Jung-Yoon Han 1 (Program in Rural System Engineering, Seoul National University, Seoul 151-921, Korea
1 Department of Environmental Science, Konkuk University, Seoul 143-701, Korea
2 Nature and Environment, 99-5 Garak-dong, Songpa-gu, Seoul 138-701, Korea)
The feasibility of the Natural and Ecological Wastewater treatment System (NEWS) was examined for rural wastewater treatment in Korea. The intermittent trickling biofilter with high hydrophilic filter media was used for pretreatment for suspended solids and organic pollutants. The subsequent constructed wetland with porous granule materials was used for promoting nutrient removal. The results show that the removal efficiencies of the system were high with respect to the water quality parameters except COD. Even if the eff luent from the biofilter did not meet the guidelines for wastewater treatment plant eff luent in Korea in terms of BOD 5 and TN, the final eff luent of the system meets the guidelines due to good performance of the constructed wetland. The regression analysis between pollutant loading rate and removal rate indicated that the system could have stable removal for SS, BOD 5 , TN, and TP in the given inf luent ranges. The analysis in the winter period indicated that the wetland covered with transparent polycarbonate glass had the stable performance during the winter period due to increase of temperature inside the wetland without any heating system. With the stable performance, effective pollu- tant removal, low maintenance, and cost-effectiveness, the NEWS could be consid- ered as an alternative treatment system for decentralized regions and rural commu- nities in Korea.
Key words : wastewater treatment, trickling biofilter, constructed wetland, decen- tralized wastewater treatment system
* Corresponding Author: Tel: +82-2-450-3747, Fax: +82-2-446-2543, E-mail: [email protected]
centralized wastewater treatment systems are recognized as potentially viable, low-cost, and long-term methods for wastewater treatment under appropriate design and operation. Recent- ly, optimization of the onsite systems attracts considerable attention after recognition of their impacts on water quality.
In wastewater treatment, biological treatment processes are considered to be more efficient and less expensive than physical and/or chemical pro- cesses (Cohen, 2001). In biofiltration, wastewater can be treated while flowing through filter medi- um where microorganisms are immobilized. The treatment of wastewater with biofiltration has been studied by many researchers under various conditions (Yap et al., 1992; Diab et al., 1993; Hu et al., 1993; Lowengart et al., 1993; Le Bihan and Lessard, 1998; Kwun et al., 2000; Villaverde et al., 2000), including treatment of septic tank ef- fluent using a horizontal subsurface biofilter (Netter et al., 1993), development of biofilter sys- tem with wheat straw for irrigation water treat- ment (Avnimelech et al., 1993), application of submerged aerated biofilter to treat hazardous landfill leachate in a bench scale (Smith, 1995), development of a peat-based biofilter for on-site wastewater treatment (Talbot et al., 1996), dy- namic simulation of submerged biofilters using a mathematical model (Jacob et al., 1997), treat- ment of flushed swine wastes with upflow aerat- ed biofilters (Westerman et al., 2000), biofilter treatment of an eel culture pond water for reuse (Yang et al., 2001), and biological treatment of domestic wastewater with floating filter media (Xie et al., 2004).
In this study, a natural and ecological waste- water treatment system (NEWS) was developed using up- and down-flow type constructed wet- land for decentralized wastewater treatment in Korea.
MATERIALS AND METHODS
1. Treatment system
The NEWS was developed by combining the high-hydrophilic biofilter and the constructed wetland into the wastewater treatment system (Fig. 1). The biofilter was made of polyethylene and had a dimension of 1.49 m in diameter and 2.00 m in height. The biofilter was packed by porous materials with the packing height of 1.20
m. The porous material used in the biofilter was melamin resin foam with a dimension of 4.0 cm×
4.0 cm×4.0 cm. The constructed wetland had a total capacity of 15.75 m 3 (dimension of 10.5 m in length, 1.5 m in width, and 1.0 m in depth) and a hydraulic retention time (HRT) of 12 hr. The por- ous materials used as the wetland media was a volcanic tuff and yellow Russian iris (Iris pseu- doacoru L.) was planted. The diameters of the porous materials ranged from 5 to 10 mm with the porosity of about 0.595, which is higher than those of sands and gravels (0.3-0.4). Iris pseudo- acorus was planted at the total area of 12.75 m 2 with 25 individuals per unit area.
2. Operation of treatment system
The NEWS was operated at the Rural Research Institute located in Ansan, Korea with an opera- tion capacity of 30 m 3 day -1 . High strength waste- water obtained from the animal wastewater tre- atment plant near the study area was diluted and applied into the biofilter as influent with intermittent injection mode (supply: 1-3 min;
pause: 10-25 min). The hydraulic loading rate in the biofilter ranged from 4.31-8.62 m 3 m -2 day -1 . In the biofilter tank, an aerobic condition was maintained by circulating air for 24 hr using a ventilation fan (25 w hr -1 ). The wastewater treat- ed in the biofilter was discharged as influent into the constructed wetland. In the wetland, the dynamic flow was designed to move up and down repeatedly to obtain the maximum removal effi- ciency per unit area (Fig. 1).
The operation of the treatment system was performed for 11 months between September, 2004 and July, 2005. The effluents at the biofilter and constructed wetland were monitored seven- teen times during the operation. The water sam- ples were analyzed with the Standard Methods (APHA, 1998).
3. Regression analysis
The regression analysis was performed for the
observed data using SPSS (Version 12). In the
regression analysis, the method of least squares
was applied to minimize difference between the
observed and predicted values. In the analysis,
the coefficient of determination (R 2 ) was calculat-
ed and then F distribution was analyzed to asses
the adequacy of the regression line.
RESULTS AND DISCUSSION
1. System performance
The removal efficiencies of SS, BOD 5 , COD, TN, and TP in the treatment system were pre- sented in Table 1. The total removal efficiency of SS in the NEWS was 97.5%. In case of BOD 5 and COD, the removal efficiencies were 95.7 and 58.5
%, respectively. In addition, the removal efficien- cies of TN and TP were 91.8 and 90.1%, respec- tively. The removal efficiencies of the treatment system were high with respect to the water qual- ity parameters except COD. The low COD remo-
val might be attributed to the high refractory organic compounds in the livestock waste, and higher removal rate is expected in municipal wastewater treatment. The effluent from the bio- filter did not yet meet the guidelines for waste- water treatment plant effluent in Korea in terms of BOD 5 and TN. In overall, however, the final effluent of the NEWS system met the guidelines stably due to a good of the constructed wetland.
In the biofilter, the mean influent and effluent concentrations of SS were 86.7 and 9.5 mg L -1 , respectively, with the averaged percent removal efficiency of 88.5%. The removal efficiency of BOD 5 was 82.9% with the influent and effluent
Septic tank Biofilter
Pump
Influent Intermittent spray
injection
Supporting substrate plate
Melanin form substrate Effluent
Substrate
Effluent Gravel
Iris pseudoacorus L.
Influent
Ground level
For waterhead Constructed wetland
Fig. 1. Schematic diagram of the NEWS.
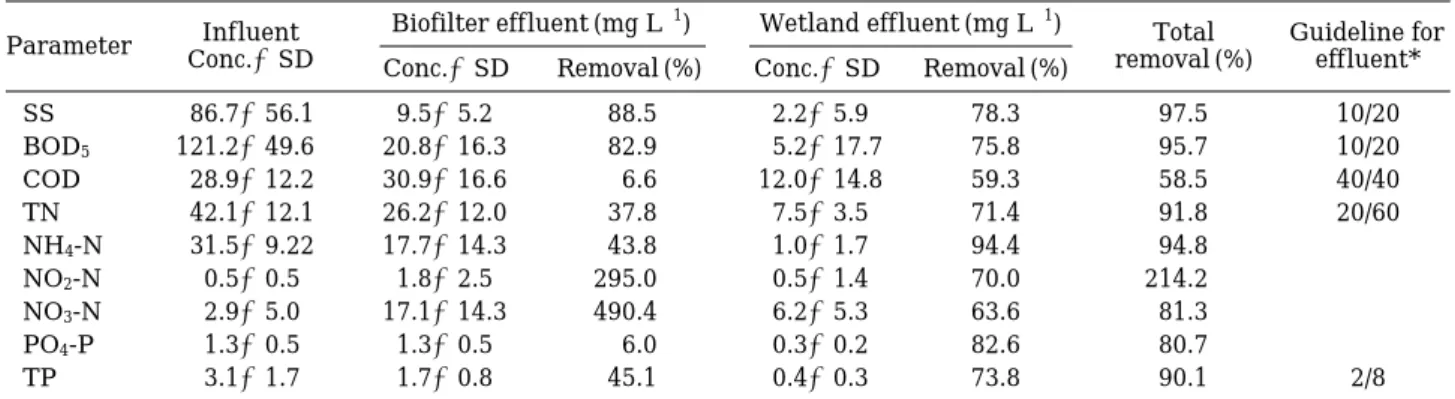
Table 1. Removal efficiencies of SS, BOD 5 , COD, TN, and TP in the NEWS.
Parameter Influent Biofilter effluent (mg L -1 ) Wetland effluent (mg L -1 ) Total Guideline for Conc.±SD Conc.±SD Removal (%) Conc.±SD Removal (%) removal (%) effluent*
SS 86.7±56.1 9.5±5.2 88.5 2.2±5.9 78.3 97.5 10/20
BOD 5 121.2±49.6 20.8±16.3 82.9 5.2±17.7 75.8 95.7 10/20
COD 28.9±12.2 30.9±16.6 -6.6 12.0±14.8 59.3 58.5 40/40
TN 42.1±12.1 26.2±12.0 37.8 7.5±3.5 71.4 91.8 20/60
NH 4 -N 31.5±9.22 17.7±14.3 43.8 1.0±1.7 94.4 94.8 -
NO 2 -N 0.5±0.5 1.8±2.5 -295.0 0.5±1.4 70.0 -214.2 -
NO 3 -N 2.9±5.0 17.1±14.3 -490.4 6.2±5.3 63.6 -81.3 -
PO 4 -P 1.3±0.5 1.3±0.5 6.0 0.3±0.2 82.6 80.7 -
TP 3.1±1.7 1.7±0.8 45.1 0.4±0.3 73.8 90.1 2/8
*: Guidelines for wastewater treatment plant effluent at special regions (4 major rivers)/other regions in Korea
concentrations of 121.2 and 20.8 mg L -1 , respec- tively. In case of COD, the mean effluent concen- tration in the biofilter (30.9 mg L -1 ) was even higher than that of the influent (28.9 mg L -1 ), indicating the negative removal efficiency (-6.6
%). The influent and effluent concentrations of TN were 42.1 and 26.2 mg L -1 , respectively, with the removal efficiency of 37.8%. In case of TP, the removal efficiency was 1.7% with the influent and effluent concentrations of 42.1 and 26.2 mg L -1 , respectively. It indicated that the biofilter had high removal efficiencies in SS and BOD 5
but low efficiencies in TN and TP. In addition, the biofilter was not effective in the removal of COD.
In the constructed wetland, the influent con- centrations were equivalent to the effluent con- centrations of the biofilter. The mean effluent concentration of SS in the wetland was 2.2 mg L -1 with the removal efficiency of 78.3%. The remo- val efficiency of BOD 5 was 75.8% with the efflu- ent concentrations of 5.2 mg L -1 . In case of COD, the effluent concentration was 12.0 mg L -1 with the removal efficiency of 59.3%. It should be noted that the wetland could remove COD con-
siderably whereas the biofilter had negative removal efficiency. The effluent concentrations of TN and TP were 7.5 and 0.4 mg L -1 with the removal efficiencies of 71.4 and 73.8%, respec- tively. It indicated that the constructed wetland had relatively high removal efficiencies for the water quality parameters.
2. Removal of nutrients
In the treatment system, the total removal effi- ciency of TN was high. However, the removal efficiencies of the nitrogen components including NH 4 -N, NO 2 -N, and NO 3 -N varied in the system (Table 1). In the biofilter, the mean influent and effluent concentrations of NH 4 -N were 31.5 and 17.7 mg L -1 , respectively, with the averaged per- cent removal efficiency of 43.8%. In case of NO 2 - N, the mean effluent concentration in the biofil- ter (1.8 mg L -1 ) was higher than that of the influ- ent (0.5 mg L -1 ) with the negative removal effi- ciency (-295.0%). In the biofilter, NO 3 -N also had the negative removal efficiency (-490.4%) with the influent and effluent concentrations of 2.9 and 17.1 mg L -1 , respectively. It indicated
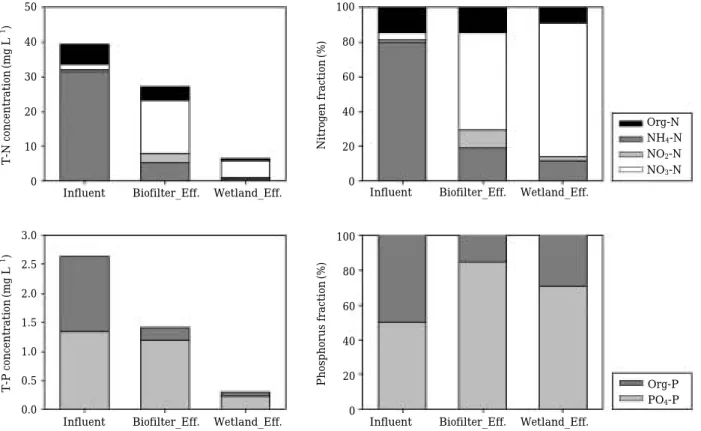
Fig. 2. Concentrations of nutrients in the treatment system.
50
40
30
20
10
0
3.0 2.5 2.0 1.5 1.0 0.5 0.0
Influent Biofilter_Eff. Wetland_Eff.
Influent Biofilter_Eff. Wetland_Eff.
Org-N NH
4-N NO
2-N NO
3-N
Org-P PO
4-P Influent Biofilter_Eff. Wetland_Eff.
Influent Biofilter_Eff. Wetland_Eff.
100
80
60
40
20
0
100
80
60
40
20
0
T-N concentration (mg L
-1) T-P concentration (mg L
-1) Nitrogen fraction (%) Phosphorus fraction (%)
that the concentration of NH 4 -N decreased in the biofilter due to volatilization along with nitrifi- cation to NO 2 -N and NO 3 -N.
In the wetland, the influent concentrations of the nitrogen components were equivalent to the effluent concentrations of the biofilter. The efflu- ent concentration of NH 4 -N was 1.0 mg L -1 with the removal efficiency of 94.4%. The removal effi- ciency of NO 2 -N was 70.0% with the effluent con- centrations of 0.5 mg L -1 . In case of NO 3 -N, the effluent concentration was 6.2 mg L -1 with the removal efficiency of 63.6%. In overall, the remo- val efficiency of NH 4 -N was high in the treat- ment system with 94.8%, but the efficiencies of
NO 2 -N and NO 3 -N were negative (-214.2 and -81.3%, respectively).
The variation of the nitrogen components in the treatment system was depicted in Fig. 2. The composition ratio of Org-N decreased slightly from 15.0% to 14.6% in the biofilter and down to 8.8% in the constructed wetland. In case of NH 4 - N, the ratio decreased sharply from 79.8% to 18.9% in the biofilter and down to 11.5% in the wetland. The ratio of NO 2 -N increased about 10 times from 1.0 to 10.2% in the biofilter but de- creased down to 2.6% in the wetland. The ratio of NO 3 -N increased sharply from 4.2 to 56.3% in the biofilter and continuously up to 77.1% in the
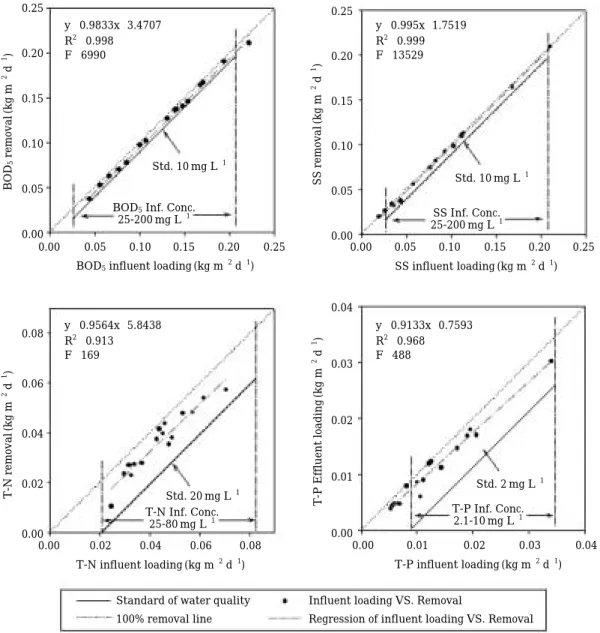
Fig. 3. Regression analysis between pollutant loading and removal rate.
0.25
0.20
0.15
0.10
0.05
0.00
y= =0.9833x-3.4707 R
2= =0.998 F= =6990
Std. 10 mg L
-1BOD
5Inf. Conc.
25-200 mg L
-1T-N Inf. Conc.
25-80 mg L
-1T-P Inf. Conc.
2.1-10 mg L
-1SS Inf. Conc.
25-200 mg L
-1Std. 20 mg L
-1Std. 2 mg L
-1Std. 10 mg L
-1y= =0.9564x-5.8438 R
2= =0.913 F= =169
y= =0.9133x-0.7593 R
2= =0.968 F= =488
y= =0.995x-1.7519 R
2= =0.999 F= =13529
0.00 0.05 0.10 0.15 0.20 0.25 BOD
5influent loading (kg m
-2d
-1)
0.00 0.02 0.04 0.06 0.08
T-N influent loading (kg m
-2d
-1)
0.00 0.01 0.02 0.03 0.04
T-P influent loading (kg m
-2d
-1) 0.00 0.05 0.10 0.15 0.20 0.25
SS influent loading (kg m
-2d
-1)
0.08
0.06
0.04
0.02
0.00
0.25
0.20
0.15
0.10
0.05
0.00
0.04
0.03
0.02
0.01
0.00
BOD
5removal (kg m
-2d
-1) T-N removal (kg m
-2d
-1) SS removal (kg m
-2d
-1) T-P Effluent loading (kg m
-2d
-1)
Standard of water quality Influent loading VS. Removal
100% removal line Regression of influent loading VS. Removal
wetland.
The variation of the phosphorus components in the treatment system was also shown in Fig. 2.
The composition ratio of Org-P decreased sharply from 49.6% to 15.3% in the biofilter but increas- ed to 29.0% in the constructed wetland. In case of PO 4 -P, the ratio increased from 50.4% to 84.7
% in the biofilter but decreased to 71.0% in the wetland. It indicated that Org-P (particulate type P) was filtered out in the biofilter whereas PO 4 -P (dissolved type P) was removed in the wetland.
As presented in Table 1, the overall removal effi- ciency of PO 4 -P in the treatment system was 80.7
% with 6.0% in the biofilter and 82.6% in the wetland.
3. Regression between pollutant loading rate and removal rate
The regression analysis between pollutant loading rate and removal rate was given in Fig.
3. The influent and effluent concentrations were converted into pollutant loading rate and remo- val rate, respectively and presented along with the water quality standard in the figure. The 100
% removal line indicated the ideal condition that all the pollutants loaded in the treatment system were removed. For SS, BOD 5 , TN, and TP, the coefficient of determination (R 2 ) was over 0.9 and F-value over 150, indicating that the regression models could be used to predict the effluent con- centration. The regression analysis indicated that BOD 5 had R 2 of 0.998 and F of 6990 and
could be removed stably in 25-200 mg L -1 of influ- ent concentration. SS had R 2 and F of 0.999 and 13529, respectively, and could be removed stably in 25-200 mg L -1 . TN had R 2 of 0.913 with F of 169, and the system could have stable removal of TN in 20-80 mg L -1 of influent concentration. TP had R 2 of 0.968 with F of 1488 and the system could have stable removal of TP in 2.1-10 mg L -1 .
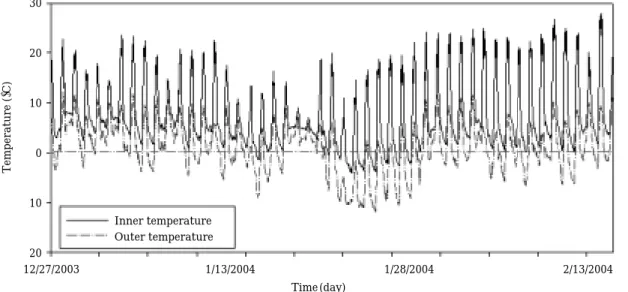
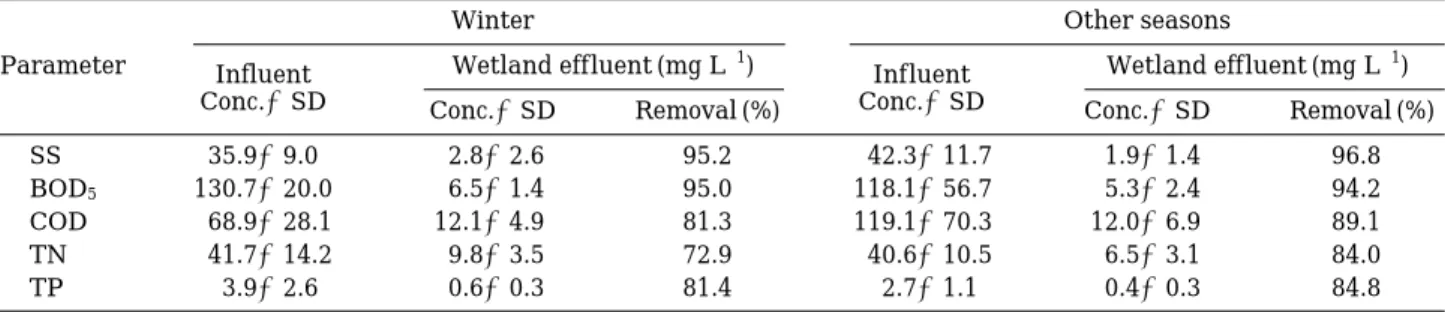
4. Performance in winter period
In the winter period between December 2003 and February 2004, the constructed wetland was covered with transparent polycarbonate glass to increase temperature inside the wetland without any heating system and so to solve the low per- formance of the wetland due to cold weather. The variation of the temperature in the winter period was presented in Fig. 4. The inner temperature of the wetland was higher than the outer tem- perature with the maximum difference of 20� C.
As presented in Table 2, the wetland had the sta- ble performance during the winter period.
In the winter period, the mean influent con- centration of SS into the NEWS system was 35.9 mg L -1 and the effluent concentration from the wetland was 2.8 mg L -1 with the averaged remo- val efficiency of 95.2%. In other seasons, the in- fluent and effluent concentrations of SS were 42.3 and 1.9 mg L -1 , respectively, with the remo- val efficiency of 96.8%. In case of BOD 5 , the in- fluent and effluent concentrations were 130.7 and 6.5 mg L -1 with the removal efficiency of
30
20
10
0
-10
-20
Temperature ( �C)
12/27/2003 1/13/2004 1/28/2004 2/13/2004
Time (day) Inner temperature
Outer temperature
Fig. 4. Inner and outer temperatures of the constructed wetland.
95.0% in the winter while they were 118.1 and 5.3 mg L -1 , respectively, with the removal effi- ciency of 94.2% in other seasons. For COD, the removal efficiency was 81.3% in the winter with the influent and effluent concentrations of 68.9 and 1.9 mg L -1 , respectively, while it was 89.1%
in other seasons with the influent and effluent concentrations of 119.1 and 12.0 mg L -1 , respec- tively.
In case of nutrients, the influent concentration of TN into the system was 41.7 mg L -1 and the effluent concentration from the wetland was 9.8 mg L -1 with the removal efficiency of 72.9%. In other seasons, the influent and effluent concen- trations of TN were 40.6 and 6.5 mg L -1 , respec- tively, with the removal efficiency of 84.0%. For TP, the removal efficiency was 81.4% in the win- ter with the influent and effluent concentrations of 3.9 and 0.6 mg L -1 , respectively, while it was 84.8% in other seasons with the influent and eff- luent concentrations of 2.7 and 0.4 mg L -1 , res- pectively.
CONCLUSIONS
In this study, the feasibility of the NEWS com- posed of the biofilter and constructed wetland was examined for rural wastewater treatment in Korea. The results show that the removal effi- ciencies of the system were high with respect to the water quality parameters except COD. Even if the effluent from the biofilter did not meet the guidelines for wastewater treatment plant efflu- ent in Korea in terms of BOD 5 and TN, the final effluent of the NEWS system meets the guide- lines due to good performance of the constructed wetland. The regression analysis between pollu- tant loading rate and removal rate indicated that the system could have stable removal for SS,
BOD 5 , TN, and TP in the given influent ranges.
The analysis in the winter period indicated that the wetland covered with transparent polycar- bonate glass had the stable performance during the winter period due to increase of temperature inside the wetland without any heating system.
With the stable performance, effective pollutant removal, low maintenance, and cost-effective- ness, the NEWS could be considered as an alter- native treatment system for decentralized regions and rural communities.
ACKNOWLEDGEMENT
This research was supported by a grant (code number 4-5-2) from Sustainable Water Resources Research Center of 21st Century Frontier Rese- arch Program.
LITERATURE CITED
American Public Health Association. 1995. Standard methods for the examination of water and waste- water (19 th ed.). APHA, Washington D.C.
Avnimelech, Y., S. Diab and M. Kochba. 1993. Devel- opment and evaluation of a biofilter for turbid and nitrogen-rich irrigation water. Water Res. 27:
785-790.
Butler, D. and J. Payne. 1995. Septic tanks: problems and practice. Build. Environ. 30: 419-425.
Cohen, Y. 2001. Biofiltration-the treatment of fluids by microorganisms immobilized into the filter bedding material: A review. Bioresour. Technol.
77: 257-274.
Diab, S., M. Kochba and Y. Avnimelech. 1993. Devel- opment of a biofilter for turbid and nitrogen-rich irrigation water; B: removal of phosphorus, algae and clay. Bioresour. Technol. 44: 137-140.
Hu, H.Y., K. Fujie and K. Urano. 1993. Dynamic be- haviour of aerobic submerged biofilter. Water Sci.
Table 2. Removal efficiencies of SS, BOD 5 , COD, TN, and TP at the wetland in winter versus other seasons.
Winter Other seasons
Parameter Influent Wetland effluent (mg L -1 ) Influent Wetland effluent (mg L -1 )
Conc.±SD Conc.±SD Removal (%) Conc.±SD Conc.±SD Removal (%)
SS 35.9±9.0 2.8±2.6 95.2 42.3±11.7 1.9±1.4 96.8
BOD 5 130.7±20.0 6.5±1.4 95.0 118.1±56.7 5.3±2.4 94.2
COD 68.9±28.1 12.1±4.9 81.3 119.1±70.3 12.0±6.9 89.1
TN 41.7±14.2 9.8±3.5 72.9 40.6±10.5 6.5±3.1 84.0
TP 3.9±2.6 0.6±0.3 81.4 2.7±1.1 0.4±0.3 84.8
Technol. 28: 179-185.
Jacob, J., J.M. Le Lann, H. Pingaud and B. Capde- ville. A generalized approach for dynamic model- ing and simulation of biofilters: Application to waste-water denitrification. Chem. Eng. J. 65:
133-143.
Kwun, S.K., C.G. Yoon and B. Kim. 2000. Perfor- mance of a small on-site wastewater treatment system using absorbent biofilter for Korean rural community. J. Environ. Sci. Heal. A. 35: 1701- 1717.
Le Bihan, Y. and P. Lessard. 1998. Microbiological study of a trickling biofiltration process: represen- tativeness of washwaters and vertical distribution of heterotrophic aerobic bacteria. Environ. Tech- nol. 19: 555-566.
Lowengart, A., S. Diab, M. Kochba and Y. Avnimele- ch. 1993. Development of a biofilter for turbid and nitrogen-rich irrigation water; A: organic carbon degradation and nitrogen removal processes. Bio- resour. Technol. 44: 131-135.
Netter, R., E. Stübner, P.A. Wilderer and I. Sekoulov.
1993. Treatment of septic tank effluent in a sub- surface biofilter. Water Sci. Technol. 28: 117-124.
Smith, D.P. 1995. Oxygen flux limitation in aerobic fixed-film biotreatment of a hazardous landfill leachate. J. Hazard. Mater. 44: 77-91.
Talbot, P., G. Bélanger, M. Pelletier, G. Laliberté and Y. Arcand. 1996. Development of a biofilter using an organic medium for on-site wastewater treat- ment. Water Sci. Technol. 34: 435-441.
Villaverde, S., F. Fdz-Polanco and P.A. García. 2000.
Nitrifying biofilm acclimation to free ammonia in submerged biofilters. Start-up influence. Water Res. 34: 602-610.
Westerman, P.W., J.R. Bicudo and A. Kantardjieff.
2000. Upflow biological aerated filters for the treatment of flushed swine manure. Bioresour.
Technol. 74: 181-190.
Xie, W., Q. Wang, G. Song, M. Kondo, M. Teraoka, Y.
Ohsumi and H.I. Ogawa. 2004. Upflow biological filtration with floating filter media. Process Bio- chem. 39: 765-770.
Yang, L., L.S. Chou and W.K. Shieh. 2001. Biofilter treatment of aquaculture water for reuse applica- tions. Water Res. 35: 3097-3108.
Yap, M.G.S., W.J. Ng and H. Chua. 1992. Perfor- mance of an anaerobic biofilter for 2-ethylhexa- noic acid degradation. Bioresour. Technol. 41: 45- 51.
(Manuscript received 10 November 2006,
Revision accepted 15 December 2006)
⁄ ¤
분산지역 및 농촌마을 하수처리를 위한 자연정화 고도처리 공법 개발
김성배∙윤춘경
1,
*∙권태영2
∙한정윤1
(서울대학교 지역시스템공학전공,
1
건국대학교 환경과학과,2
자연과 환경)본 연구에서는 우리나라의 분산지역 및 농촌마을의 하수처리를 위해 자연정화 고도처리 공법인