The eutrophication in the lower Nakdong River has proceeded rapidly since the late 1980s cau- sing serious water quality problems. Of parti- cular concern has been the proliferation of bloom causing algal species (mainly Microcystis and
Stephanodiscus) (Joo et al., 1997; Ha et al., 1999).The development of Microcystis algal blooms creates difficulties during the processing of river water for human consumption (e.g. high pH, scum formations, toxin production) (see Reynolds, 1984;
Shapiro, 1990), which must be overcome in order to provide safe drinking water.
Recently substantial expense and effort has been expended on the reduction of algae in the water purification processes. Two approaches
have been used i) reducing and eliminating the key factors which contribute to algal bloom for- mation and ii) control and reduction of algal bio- mass during water purification. The former approach is normally undertaken by large-scale point and non-point source management (e.g.
Edmondson and Litt, 1982; Carpenter et al.
1998), while water quality improvement systems such as sand-filtering, counter-osmosis meth- ods, chlorination and ozone addition and destra- tifications comprise the latter (Hoffmann, 1976;
Trotter et al., 1978; Brooks and Liptak, 1979;
Lambert et al., 1996; Tsuji et al., 1997; Vuori, 1997; Daldorph, 1998; Plummer and Edzwald, 1998). Both methods can lead to improvements of
─
─ 467 ──
The Application of an Algal Fence for the Reduction of Algal Intake into the Water Intake Facility
Joo, Gea-
-Jae
1, Min--Ho Jang
1, 2, Sung--Bae Park
1, Jong--
Mun Jung1, 3, Jae--Soon Roh
1, 3and Kwang--Seuk Jeong
1*
(1Dept. of Biology, Pusan National Univ., Jang-Jeon Dong, Gum-Jeong Gu, Busan, S. Korea, 609-735
2School of Biological and Biomedical Sciences, Univ. of Durham, South Road, Durham, UK, DH3 1LE,
3Busan Water Quality Institute, Busan Waterworks HQ, S. Korea, 621-813)
In this study, an algal fence was developed and applied to reduce the input of algal scum into the water intake facility. The effectiveness of vertical algal fences (overlapped three types of meshes, (312µµm×375µµm, 390µµm×450µµm, and 0.7 cm×1 cm; vertical depth, 1.5 m; length of fence, about 120 m)) was experimentally tested at a water intake facility (Mulgum, lower Nakdong River). The application of the fence resulted in the statistically significant difference of algal biomass between inside and outside of the fence. According to ANOVA test, chl. a concentration in Day-1 showed large difference at each depth of 0, 1, 2 m (0.001¤p at each depth, n = 16 respectively). Especially large difference was observed at 0 and 1 m depth. However, the fence was only effective for a short period and its efficiency declined by Day-5 after the installation. When better maintenance options for the fence are prepared, e.g. mechanical installation and periodic backwashing of the fence, the performance of algal fence may be sustained. In addition, reliable models for bloom prediction are required to provide an advanced indication of the optimal timing for the installation so that effective operation would be achieved.
Key words : Microcystis blooms, algal fence, water intake facility, Nakdong River
* Corresponding Author: Tel: 051) 510-2258, Fax: 051) 581-2962, E-mail: [email protected]
the quality of treated water, but they are costly and require long-term application.
In this study, an algal fence system was de- signed to overcome some of these problems and to compliment some of the other control methods.
Fences are frequently utilized in water intake systems prevent the inlet of algal cells however their physical properties are not appropriate to cyanobacterial blooms. In addition, scientific evaluation of such algal fence system has not been made. In this study an algal fence was de- signed to consider the ecological characteristics of the Microcystis community, the results may provide an option for the reduction of algal input into water purification systems.
The in situ experiment was conducted by the installation of the algal fence at Mulgum (27 km upperstream from the estuarine barrage) from Jun. to Sept. 2001. The site is eutrophic and an- nual cyanobacterial blooms occur in summer (Ha
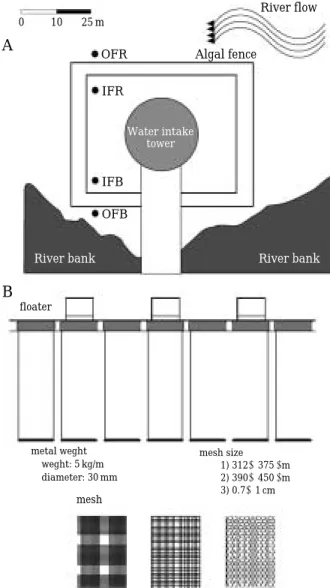
et al., 1999). The fence was constructed in twolayers surrounding the water intake (Fig. 1). The fence is a combination of fence units consisting of a filter screen on a frame suspended between styrofoam for buoyancy, and a weighted metal bar. The filter screen consisted of three types of mesh filters of differing pore size (312×375
µm, 390×450
µm, and 0.7×1 cm). They were over- lapped from small to large pore size screens, and the large one was faced to the outside of fence.
The average depth of the study site was 5 m, and the vertical length of fence screen was 2.5 m.
Limnological parameters were measured be- fore and after instillation, and inside and outside of the algal fence to compare and evaluate the efficiency of algal reduction (Table 1). Water sampling was conducted at four stations (Outside the Fence to River, OFR; Inside the Fence to Ri- ver, IFR; Inside the Fence to Bank, IFB; Outside the Fence to Bank, OFB) and at 3 depths (0, 1, 2m). At each sampling point water samples were
collected using a 8 L Van Dorn water sampler and water temperature (YSI DO Model 52), dis- solved oxygen (DO) (YSI DO Model 52), pH (Ori- on pH meter-Model 250A), turbidity (Turbidi- meter Model 11052) and phytoplankton biomass (chlorophyll a) was measured. Chlorophyll a con- centration was measured according to Wetzel and Likens (1991). Sampling was conducted on 6 occasions (8, 9, 11, 12 June, 8 August and 9 Sep- tember 2001) after the instillation of the algal fence (Fig. 1A), with 2-3 replicates at each sam- pling point. The first sampling was conducted immediately after the installation (within 30 minutes).
Table 1. Conditions for the field experiment of the algal fence.
Category Status
Sampling points 4 points (2 for outside of the fence, 2 for inside of the fence)
Depth for each 3 levels (0, 1, 2 m) sampling
Replicates 2-3 times for each sampling point and each depth
Sampling dates 2001 Jun. 8, 9, 11, 13; Aug. 8; Sept. 9
Fig. 1. The structure of algal fence at the study site. A, diagram of the installation of the algal fence; B, the structure of three types of fence materials.
0 10 25 m
River flow
OFR Algal fence
floater
metal weght -weght: 5 kg/m -diameter: 30 mm
mesh
size 1) 312×375µm 2) 390×450µm 3) 0.7×1 cm mesh size
1) 312×375µm 2) 390×450µm 3) 0.7×1 cm Water intake
tower IFR
IFB OFB
River bank River bank
A
B
One-way ANOVAs (α = 0.05) were conducted on turbidity and algal biomass (chl. a concentration) from installation day to 4th day. From the results of ANOVAs, multiple comparisons (Duncan test) were conducted to detect detailed differences be- tween inside and outside of the fence. Statistical analyses was conducted using SPSS for Windows version 10.0.
The limnological characteristics in- and out- side differed after the installation of the algal fence, and there was a reduction in algal biomass with the fence at the study site (Table 2). Initi- ally about 2 to 7 times lower concentration of turbidity and chl. a were detected inside the fence. However, the difference became scarce and there was no difference after one month. Other variables such as water temperature, dissolved oxygen and pH did not show significant differ- ences.
On the date of fence installation (June 8, 2001), turbidity and chl. a in- and outside of the fence were similar to each other respectively. The effect of algal fence occurred in June 9. Turbidity and chl. a at OFR were 16 NTU and 113
µg/L, however, IFR showed 10 NTU and 18
µg/L.
Comparing IFB and OFB, about 10 NTU and 20
µg/L of turbidity and chl. a were higher at OFB.
Vertically there was a slight difference of tur- bidity and chl. a, however the pattern was simi- lar. On June 11, higher values of those parame- ters were detected at the bank-side points (IFB and OFB) on comparing with the river-side. In this case, turbidity and algal biomass were lower inside the fence. Both parameters on June 13 were similar to those of fence installation, and
there was no difference between in and outside of the fence. The effectiveness of algal fence decrea- sed as time passed, In August and September, inversed condition (higher chl. a inside the fence) were observed.
Table 2. The changes of turbidity and chlorophyll a concentration during the experiment. Each data consisted of mean±
SD.
Turbidity (n = 12-24)
Points Jun. 8 Jun. 9 Jun. 11 Jun. 13 Aug. 2 Sept. 6
OFR 13.2±1.4 16.1±3.3 19.0±1.1 12.0±0.8 12.3±0.0 11.6±2.0
IFR 10.4±1.1 10.2±3.5 14.7±0.7 11.0±0.4 13.1±0.9 10.8±0.4
IFB 10.8±0.1 7.6±1.8 13.2±1.0 11.0±0.3 15.9±0.4 11.0±0.8
OFB 11.6±0.4 17.3±4.1 15.5±1.4 11.5±0.1 14.0±2.9 9.2±0.5
Chl. a
Points Jun. 8 Jun. 9 Jun. 11 Jun. 13 Aug. 2 Sept. 6
OFR 35.3±6.8 113.7±63.3 51.7±18.5 20.0±3.3 23.6±0.0 39.1±3.8
IFR 38.3±4.9 18.7±3.4 41.3±6.3 16.1±0.3 30.2±1.3 49.2±14.4
IFB 31.0±1.6 21.5±7.1 45.4±3.4 18.5±0.9 27.1±3.9 32.2±3.2
OFB 19.3±5.6 40.3±2.4 105.5±25.1 17.8±0.5 27.1±0.4 23.9±2.4
Table 3. The results of ANOVA test (one-way, one- tailed, α= 0.05) on the differences of chlorophyll a concentration inside and outside of the fence.
OFR, Outside the Fence to River; IFR, Inside the Fence to River; OFB, Outside the Fence to Bank; IFB, Inside the Fence to Bank.
Date Depth n F p Duncan test
(m)
2001. 6. 8 0** 12 17.110 0.01¤p OFR-IFR,
¤0.025 IFB, OFB 1 12 3.970 0.1¤p
¤0.05
2* 12 4.841 0.05¤p OFR-IFR-
¤0.025 IFB, OFB 2001. 6. 9 0** 16 190.539 0.001¤p OFR, IFR-
IFB, OFB 1** 16 221.479 0.001¤p OFR, IFR-
IFB, OFB 2** 16 30.058 0.001¤p OFR-OFB,
IFR-IFB 2001. 6.11 0** 24 10.808 0.001¤p OFR-OFB,
IFR-IFB 1** 24 29.869 0.001¤p OFR-IFR-
OFB, IFB 2** 24 45.203 0.001¤p OFR-IFR-
OFB, IFB 2001. 6.13 0 24 1.219 p¤0.25
OFR, IFR- 1** 24 9.556 0.001¤p OFB, IFB-
OFB 2 24 0.309 p¤0.5
* indicates the significance of ⁄0.05, ** for ⁄0.01
The fence effects on the reduction of algal bio- mass were statistically significant (Table 3). This effects were distinctive in the initial stage (about 4-5 days), but decreased in a week or more. On the installation date (June 8), there was no difference between in and out of the fence. The difference could be observed on June 9, and chl. a in each depth of 0, 1, 2 m inside the fence was lower than outside (one-way ANOVA; 0 m, F = 190.539, 0.001¤p, n = 16; 1 m, F = 221.479, 0.001
¤p, n = 16; 2 m, F = 30.058, 0.001¤p, n = 16).
Especially large difference could be observed in 0 and 1 m depth. On June 11, difference at the sur- face was clear (F = 10.808, 0.001¤p, n = 24), but there was no difference at 1 and 2 m depth. The chl. a concentrations in-and outside the fence were statistically identical at every water depth on June 13.
The algal fence was effective at reducing the algal biomass in the initial stage. Its effectiven- ess declined after continued operation and after 5-7 days no reduction in algal biomass was observed.
The algal fence may play an important role in preventing the inflow of algae when there is especially severe surface scum development in the river. In the lower Nakdong River cyanobac- terial blooms usually resulted in the develop- ment of surface scum (e.g. serious proliferation in 1994) (Ha et al., 2000) because of water stagna- tion. It would appear that the timing of the deployment of the fence is critical in order for it to operate efficiently and to reduce algal input.
The reduction in the efficiency of the fence may be caused by two possibilities. Firstly, “algae can move freely in the water column through the fence.” Turbulence in the water column toward the riverside may cause intrusion of algae benea- th the fence screen into the water intake facility.
However, the length of screen has considered the buoyancy of cyanobacteria. Thus, within short- term (maybe 3-5 days), this reason can have less effect. Rather, the other reason of “the vagrancy of adhered cells to the screen” would be more influencing in longer time-series.
The fence efficiency would be maximized as algal blooms occurred seriously. The reduction of efficiency can be decreased fast during severe proliferation of algae. During the study period, the cyanobacterial colonies were large enough to be blocked by the screen, and the fence did not work properly after 4-5 days. When development
of algal bloom is not severe, the fence can persist for more days. However, to manage the fence effectiveness at high level, frequent and perio- dical maintenance should be adopted. Further research is required to develop management opt- ions such as periodical backwashing on the scre- en, to improve and maintain efficiency of the fence. In addition, to improve the usability and effectiveness of the algal fence its installation and removal must be simplified (e.g. mechanical lowering).
For “raw water” treatment, it is important to control turbidity before the process of higher purification (Wagner, 1978; Australian and New Zealand Environmental and Conservation Coun- cil, 1992). Traditionally several methods have been used at water intake facilities for the pri- mary reduction of algae. These include aeration from the reservoir bottom, artificial destratifica- tion by mechanical pumping, and spreading algi- cide. However, while these methods produce wor- thwhile declines in algal populations, problems are associated with these methods. The cost involved in mechanical pumping and aeration are prohibitive when considered at large scales and the application of algicide has problems as- sociated with the toxicity especially when water is for human consumption (Hammer, 1986). The algal fence may provide an effective method for controlling turbidity before higher purification takes place.
Combination of existing purification systems can increase the efficiency of water treatment.
Many different methods of water purification are practiced, such as sand filter (Hoffmann, 1976;
FWR, 1991; Lambert et al., 1996), counter-osmo- sis (Wannemacher et al., 1994; Vuori et al., 1997), polymeric nano-filtration (James et al., 1994) and chlorination (Jung et al., 2002). In the lower Nakdong River, activated carbon, ozone and chl- orination are applied to remove algal scum and microcystin. The algal fence can reduce the pri- mary input of cyanobacteria into the system allowing the secondary purification methods to function effectively.
By developing ecological models (e.g. Jeong et
al. 2001) to predict the timing of algal blooms thedeployment of the algal fence can be optimized.
This approach coupled with improvements to the
efficiency of the algal fence may lead to reduc-
tions in the cost of water quality management.
ACKNOWLEDGEMENT
The authors are grateful to Dr. Kyong Ha for comments on the earlier draft and appreciate field assistance of Mr. Jung-Gon Kim. This study was funded by the Institute of Water Qua- lity of the Pusan Metropolitan City Waterworks Headquarters. This study is the Cont. No. 36 of the Ecosystem Study on the Nakdong River of the Limnology Lab, Pusan National Univ.
REFERENCES
Australian and New Zealand Environmental and Conservation Council. 1992. Australian Water Quality Guidelines for Fresh and Marine Waters.
Sydney.
Brooks, A.S. and N.E. Liptak. 1979. The effect of intermittent chlorination on freshwater phyto- plankton. Water Res. 13:49-52.
Carpenter, S.R., N.F. Caraco, D.J. Correl, R.W.
Howarth, A.N. Sharpley and V.H. Smith. 1998.
Non-point pollution of surface water with phos- phorus and nitrogen. Ecol. Appl. 8:559-568 Daldorph, P.W.G. 1998. Management and treatment
of algae in lowland reservoirs in Eastern England.
Water Sci. Technol. 37:57-63.
Edmondson, W.T. and A.H. Litt. 1982. Daphnia in Lake Washington. Limnol. Oceanogr. 27:272-293.
Ha, K., E.A. Cho, H.W. Kim and G.J. Joo. 1999. Mic- rocystis bloom formation in the lower Nakdong River, South Korea: importance of hydrodynamics and nutrient loading. Mar. Freshwater Res. 50:
89-94
Ha, K., H.W. Kim, K.S. Jeong and G.J. Joo. 2000.
Vertical distribution of Microcystis population in the regulated Nakdong River (S. Korea). Lim- nology 1:225-230.
Hammer, M.J. 1986. Water and Wastewater Tech- nology. SI version, 2nded. John Wiley and Sons, NY.
Hoffmann, J.H. 1976. Removal of Microcystis toxin in water purification process. Wat. Sa. 2:58
James, H.A., C.P. James and J. Hart. 1994. The an- alysis of microcystins in raw and treates water.
In: G.A. Codd, T.M. Jefferies, C.W. Keevil and E.
Potter (Editors), Detection methods for cynobac- terial toxins. The Royal Society of Chemistry.
Special Publication No. 149. pp. 51-58.
Jeong, K.S., G.J. Joo, H.W. Kim, K.Ha and F.
Recknagel. 2001. Prediction and elucidation of phytoplankton dynamics in the lower Nakdong River (Korea) by means of an artificial neural network. Ecol. Modelling 146:115-129
Joo, G.J., H.W. Kim, K. Ha and J.K. Kim. 1997. Long -term trend of the eutrophication of the lower Nakdong River. Kor. J. Limnol. 30:472-480.
Jung, J.M., H.K. Park, Y.J. Lee, E.Y. Jung, K.W.
Kwon, P.S. Shin and G.J. Joo. 2002. Effect of chl- orination on removal of cyanobacterial microcy- stins. J. Kor. Environ. Sci. Soc. 11:1157-1163.
Lambert, T.W., F. Charles, B. Holmes and S.E.
Hrudey. 1996. Adsorption of microcystin-LR by activated carbon and removal in full scale water treatment, Water Res 30:1411-1422.
Plummer, J.D. and J.K. Edzwald. 1998. Effect of ozone on disinfection by product formation of algae. Water Sci. Technol. 37:49-55.
Reynolds, C.S. 1984. The Ecology of Freshwater Phytoplankton. Cambridge University Press, New York.
Shapiro, J. 1990. Current beliefs regarding dominan- ce by blue-greens: the case for the importance of CO2 and pH. Verh. Internat. Verein.. Limnol. 24:
38-54.
Trotter, D.M., A.C. Hendricks and J. Cairns, Jr.
1978. The use of Stigeoclonium subsecundum (Chlorophyceae) as a bioassay organism-III. Res- ponse to intermittent chlorination. Water Res. 12:
185-191
Tsuji, K., T. Watanuki, F. Kondo, M. F. Watanabe, H.
Nakazawa, M. Suzuki, H. Uchida and K.-I.
Harada. 1997. Stability of microcystins from cya- nobacteria-IV. Effect of chlorination on decom- position. Toxicon. 35:1033-1041.
Vuori, E., A. Pelander, K. Himberg, M. Waris and K.
Ninivaara. 1997. Removal of nodularin from brac- kish water with reverse osmosis or vacuum distil- lation. Water Res. 31:2922-2924.
Wagner, R.H. 1978. Environment and Man. W.W.
Norton & Company, Toronto.
Wannemacher, R.W., R.E. Dinterman, W.L. Thomp- son, M.O. Schmidt and W.D. Burrows. 1994. Trea- tment for removal of biotoxin from drinking wa- ter. Govt. Reports Announcements & Index (GRA
& I). Issue 12.
Wetzel, R.G. and G.E. Likens. 1991. Limnological Analyses. 2nd ed. Springer-Verlag, New York, 391 pp.
(Manuscript received 10 November 2003, Revision accepted 15 December 2003)
⁄ ¤
조류펜스의 조류 저감 효과에 대한 실험적인 평가
주기재*∙장민호∙박성배∙정종문∙노재순∙정광석
(1부산대학교 생물학과, 2School of Biological and Biomedical Science, Univ. of Durham,
3부산광역시 상수도 사업본부 수질연구소)
본 연구에서는 상수원수 취수장의 취수구로 유입되는 조류 군체의 양을 물리적으로 억제할 수 있 는 조류 펜스를 개발하고, 현장에 적용 및 평가하였다(2001년6-9월). 펜스를 설치한 후 펜스 안팎 의 식물플랑크톤 생체량은 통계적으로 유의한 차이를 나타내었다. 분산 분석의 결과 설치 1일 후 의 chl. a는 모든 수심(0, 1, 2 m)에서 유의한 차이를 보였으며(모든 수심에서0.001¤p, 각 수심별 n = 16), 특히 표층과 수심1 m에서 가장 큰 차이를 보였다. 하지만 조류 저감 효과는 설치 후3-5 일이 지나면서 감소하였다. 조류 펜스의 물리적 유입 저감 효과의 지속성 유지를 위해서는 효과적 인 설치 및 유지관리 방안(예, 기계적인 설치 및 주기적인 역세척 등)이 모색되어야 하며, 생태 모 형을 이용하여 대번성 시기 예측이 가능할 경우 훨씬 효과적으로 조류의 유입 차단이 가능할 것으 로 보인다.