167 Corresponding author: [email protected]
✽생태계 모델을 이용한 동경만
Molecular Marker (DSBP)
의 거동 예측 및 물질수지 산정김동명✽
부경대학교 생태공학과
Estimation of Transport and the Mass Balance of a Molecular Marker (DSBP) in Tokyo Bay Using an
Ecological Model
Dong-Myung Kim*
Department of Ecological Engineering, Pukyong National University, Busan 608-737, Korea
A three-dimensional ecological model (EMT-3D) was applied to Tokyo Bay to simulate 4,4'-bis (2-sulfostyryl)biphenyl (DSBP). The simulated results were in good agreement with the observed values, with a correlation coefficient of R=0.8431 and a coefficient of determination of R2=0.7108. The sensitivity analysis indicated that the photolysis rate is the most important factor. Therefore, the parameters must be considered carefully in modeling. The mass balance results showed that the standing stock of DSBP in water and in particulate organic carbon was 621.2 and 19.5 kg, respectively, and the effluent flux to the open sea was 2.63 and 0.055 kg/day, respectively.
Key words: EMT-3D, FWAs, DSBP, Marine environment, Ecological model
서 론
넓은 범위의 오염물질이 하수의 직접적인 배출이나 강으로 들어오는 하수로 인해 연안역으로 유입된다. 하수는 연안수의 오염에 주요한 기여를 하는 것으로 알려져 있기 때문에 연안 역에서 하수에 의한 오염물질의 공간적 분포와 거동의 이해는 연안 환경을 관리하는데 있어 필수적이다 (Eganhouse et al., 1983; Brown and Wade, 1984; Ferna´ndez et al., 1991; Takada and Eganhouse, 1998).
동경만은 반 폐쇄성 연안으로 인구 2,600만의 세계적인 도 시화 지역인 대도시 동경에 둘러싸여 있다. 매년 약 2 km
3의 하수 배출수가 직접적으로 또는 강을 통해 만의 내부로 유입 되는데 이런 거대한 양의 폐수유입에 의한 동경만의 오염은 점점 심각해지고 있지만 사실상 동경만 수층에서 친수성 molecular markers의 분포에 대한 정보는 거의 없다 (Managaki et al., 2006).
형광표백제 (FWAs, fluorescent whitening agents)는 세제, 직물, 종이, 플라스틱 등의 첨가물로 자외선을 흡수하고 눈으 로 볼 수 있는 청색광을 변형시키는 합성 화합물이다. FWAs는 DAS1 (4,4'-bis[ (4-anilino-6-morpholino-1,3,5-triazin-2-yl)amino]
stilbene-2,2' -disulfonate)과 DSBP (4,4'-bis (2-sulfostyryl)biphenyl) 등으로 구성되는데 가정용 세탁 세제에 포함되어 있어 많은 비율이 하수를 통해 배출된다.
하수 처리수에서 FWAs의 제거율은 DSBP 53%, DAS1 89%
로 보고되었는데 이는 초기 단계와 활성슬러지에서 흡착에
의한 것으로 생물분해가 되지 않고 수용성 물질이기 때문에 호기성과 혐기성의 친온성 처리 조건 동안에는 제거되지 않는 다 (Poiger et al., 1998). 결과적으로 높은 농도의 FWAs가 하수 배출수에 존재하게 되고, 일본 및 다른 여러 나라의 강물과 퇴적물에서 널리 검출된다 (Abe et al., 1983; Hayashi et al., 2002; Poiger et al., 1996; Stoll et al., 1998).
수 환경에 배출된 FWAs는 즉시 광이성질체화 (photoisomerize) 되고, 햇빛에 의해 천천히 광분해된다. FWAs의 광분해는 용존 유기물질의 존재에 의해서도 천천히 일어나는데 여름 정오 햇빛하의 호수에서 DSBP의 분해는 DAS1보다 빠르게 나타난 다 (Canonica et al., 1997). 또한 낮은 생분해성을 갖는 특성을 가지고 있으며, 육상에서 배출된 가정하수에 의한 해역의 영 향여부 판단 및 하수의 희석, 확산 등의 거동 파악에 유용하게 사용 될 수 있다 (Poiger et al., 1998).
이러한 화학적 특성을 바탕으로 연안 환경에서 가정폐수에 의한 오염 연구에 대해 잠재적인 수용성 molecular markers로 제시되고 있다 (Stoll et al., 1997; Hayashi et al., 2002).
본 연구에서는 3차원 생태계 모델 (EMT-3D)을 사용하여 FWAs의 구성성분 중 하나인 DSBP를 대상으로 동경만에서의 적용성을 검토하였으며, 민감도 분석을 수행하여 상태함수의 농도결정에 대한 영향인자를 판별하고 모델링 결과를 바탕으 로 DSBP의 물질 수지를 산정하였다.
재료 및 방법
모델링 시스템
본 연구에서 적용된 생태계모델은 유한차분법에 의한 3차
원 모델로서, 수환경으로 유입된 화학물질의 이류/확산작용에 의한 이송현상과 생물, 화학적인 반응을 고려하였다 (Fig. 1).
EMT-3D는 기존의 여러 해양유체역학모델과의 연결이 용이 하며, 여러 화학물질에 대하여 적용성 및 데이터 존재 상황에 따른 유연성을 가지는 3차원 생태계 모델이다 (Kim et al., 2004b).
Fig. 1. Schematic diagram of the fate and transport of chemicals in the EMT-3D (Kim et al., 2004b).
Table 1. Biological and chemical processes which were applied in each cell of the EMT-3D (Kim et al., 2004b)
d (Dissolved Chemicals)/dt =
- Adsorption into POC in water + Desorption from POC in water - Uptake and sorption of plankton
+ Excretion and respiration from plankton - Uptake and sorption of fish + Excretion and respiration from fish - Uptake and sorption of benthos + Excretion and respiration from benthos
- Biodegradation - Hydrolysis - Photolysis - Oxidation
- Volatilization at surface layer + Diffusion or release from porewater d (Chemicals in Plankton)/dt =
+ Uptake and desorption from water into water - Excretion and respiration into water d (Chemicals in Fish)/dt =
+ Uptake and desorption from water into water - Excretion and respiration into water d (Chemicals in Benthos)/dt =
+ Uptake and desorption from water into water - Excretion and respiration into water
+ Uptake and desorption from porewater into water - Excretion and respiration into porewater d (Chemicals in POC)/dt =
+ Adsorption from water + Desorption into water - Sinking to sediment + Resuspension from sediment - Biodegradation - Hydrolysis - Photolysis - Oxidation d (Dissolved Chemicals in Porewater)/dt =
- Adsorption into POC in sediment + Desorption from POC in sediment - Uptake and sorption of benthos + Excretion and respiration of benthos - Biodegradation - Diffusion and release to water column
d (Chemicals in Sediment POC)/dt =
+ Adsorption from pore water - Desorption into pore water + Sinking - Resuspension - Biodegradation
모델 내 구성요소의 시간에 따른 변화는 다음의 식 (1)에 의해서 기술된다.
t
B u x
B v y
B w z
B
Chemical transport by advection
x
Kx
x
B
y
Ky
y
B
z
Kz
z
B
Chemical transport by turbulent diffusion
dt dB
Biological and chemical processes (1) 여기서 B는 대상 화학물질, u는 x방향의 유속, v는 y방향의 유속, w는 z방향의 유속이고, Kx, Ky는 x방향과 y방향의 수평 확산계수이며, Kz는 z방향의 수직확산계수이다. 모델에 적용 된 생물, 화학적인 프로세스는 Table 1에 나타내었다.
결과 및 고찰
대상해역 및 모델의 적용
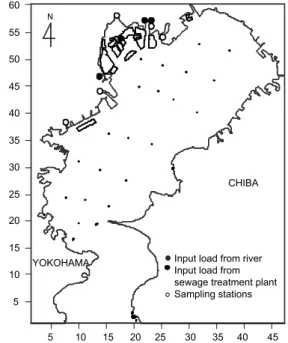
동경만을 대상으로 DSBP의 거동을 시뮬레이션 하기위해 EMT-3D를 사용하였다. 대상해역은 수평방향으로는 각 1 km, 수직방향으로는 10층으로 구분하였다. 부하는 동경만으로 유 입되는 5개의 하천과 4개의 하수처리장으로부터의 유입부하 를 고려하였다 (Fig. 2). 생물, 화학적인 과정은 문헌조사와 데이터의 존재상황 등을 고려하여 광분해, 흡착과 탈착, 퇴적 등을 고려하였다. 입력조건 및 파라메타와 동경만으로 유입되 는 DSBP의 부하량은 Table 2에 나타내었다. 유동장은 동경만 을 대상으로 한 Kim et al. (2004b)의 조석류와 잔차류를 계산한 결과를 이용하였다.
Fig. 2. Sampling stations and locations of input loads in the
model region.
Table 2. Input data for EMT-3D
Parameters Input value
Model region Tokyo Bay
Target chemicals DSBP
Mesh size ⊿x = ⊿y = 1 km
Layer 10
Considered biological and chemical
processes Photolysis, Adsorption,
Desorption, Sedimentation
Input loads from river 9.507 kg/day
from sewage treatment 19.821 kg/day
Photolysis rate 7.0
(1), (2)1 / day
Extinction factor 8.0
(3), (4), (9)1 / m Adsorption rate of particulate organic
carbon 1.1×10
5L / [kg·day]
Desorption rate of particulate organic
carbon 1.57 1 / day
Partition factor of particulate organic
carbon 7.0×10
4 (5), (6)L / kg Settling rate of particulate matter 2.782
(7)g / [m
2·day]
Horizontal eddy viscosity and
diffusivity 3.0×10⁵
(7), (8)cm
2/ sec
(1)
Poiger et al., 1999 ;
(2)Kramer et al., 1996 ;
(3)Wong-Wah-Chung et al., 2001 ;
(4)Mills et al., 1985 ;
(5)Hayashi et al., 2002 ;
(6)Stoll et al., 1998 ;
(7)Kim et al., 2004b ;
(8)Horiguchi et al., 2001 ;
(9)Kesselman-Truttmann et al., 1999.
대상해역에서 2002년과 2003년에 조사된 Managaki et al.
(2006)의 DSBP 실측값과 생태계 모델을 이용하여 계산된 계 산치의 비교를 Fig. 2에 나타내었다. 계산치와 관측치간 관계 정도를 나타내는 상관계수 R값이 0.8431로 계산되었으며, 적 합성의 지표가 되는 R
2값이 0.7108로 나타나 계산치가 비교적 잘 재현된 것으로 사료된다.
Fig. 3. Comparison of the observed and simulated DSBP in Tokyo Bay.
시뮬레이션 된 표층 및 저층의 용존 DSBP와 입자성 유기물 질내의 DSBP를 Fig. 4에 나타내었다. 유입부하가 집중되어있 는 동경 인근해역에서 가장 높은 농도를 나타내었으며, 외해 로 갈수록 낮아졌다. 표층의 경우 용존 DSBP의 범위는 10~210 ng/L의, 입자성 유기물질내 DSBP는 500~5,500 μg/kg 정도로 나타났다. 저층의 경우 농도 범위는 용존 DSBP의 경우 4~13 ng/L, 입자성 유기물질내 DSBP는 250~950 μg/kg 정도의 값을 나타내었다.
민감도 분석
계수의 민감도 분석을 위해 모델 보정에 적용된 계수값에 대하여 각 계수값의 2배 및 1/2배에 해당하는 값을 증감시켰을 때 나타나는 상태변수 결과값의 변동량을 산정하였고, 그 결 과를 Table 3에 나타내었다. 민감도 분석의 결과값이 큰 경우 일수록 상태함수의 농도결정에 미치는 영향이 커지는 것을 나타낸다.
용존 DSBP의 경우 광분해속도의 증감에 따른 농도변화가 87.61% 및 -54.22%로 가장 영향이 큰 계수로 나타났고, 다음으 로 흡광계수의 증감에 따른 농도 변화가 -45.16% 및 79.78%로 나타났으며 다른 계수에 의한 영향은 미미한 것으로 나타났다.
입자성 유기물질내 DSBP의 경우는 광분해속도의 증감에 따른 농도 변화가 89.09% 및 -54.64%로 가장 큰 영향이 나타났 으며, 분배계수의 증감에 따른 농도 변화가 -47.35% 및 82.51%
로, 흡광계수의 증감에 따른 농도 변화가 -45.78% 및 81.19%로 다소 높게 나타났다.
따라서 추후의 DSBP에 대한 모델 적용 시에는 목적하는 상태변수에 따라 이들 계수에 대한 정밀한 고찰이 필요할 것으로 사료된다.
Table 3. Sensitivity analysis of DSBP concentration by change of values of parameters
The changes of DSBP (%)
Items In dissolved
phase
In particulate organic matter
Photolysis rate × 1/2 87.61 89.09
× 2 -54.22 -54.64
Extinction factor × 1/2 -45.16 -45.78
× 2 79.73 81.19
Settling rate of particulate matter
× 1/2 0.36 5.32
× 2 -0.61 -8.76
Adsorption rate of particulate organic carbon
× 1/2 0.08 -8.03
× 2 -0.05 4.83
Partition factor of particulate organic carbon
× 1/2 0.39 -47.35
× 2 -0.69 82.51
물질수지 산정
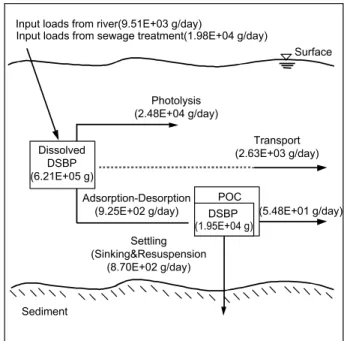
모델링 결과를 바탕으로 동경만에서 DSBP의 물질수지를 계산하였다 (Fig. 5). 대상해역의 DSBP 현존량은 용존 DSBP 621.2 kg, 입자성 유기물질내 DSBP 19.5 kg으로 산정되었다.
DSBP는 하천으로부터 9.51 kg/day 및 하수처리장으로부터
Fig. 4. The distribution of the simulated DSBP.
171 19.8 kg/day의 속도로 동경만에 유입되었다. 용존 DSBP는 24.8 kg/day의 속도로 광분해되는 것과 동시에 0.93 kg/day로 입자 성 유기물질에 흡착된다. 용존 DSBP는 2.63 kg/day, 입자성 유기물질내 DSBP는 0.055 kg/day의 속도로 만외에 운반된다.
DAS1에 관한 Kim et al. (2004a)의 결과와 비교해 보면, 해역내 현존량은 DSBP가 DAS1에 비하여 약 2배 높은 것으로 나타났다. 육상으로 부터의 유입은 DSBP가 DAS1에 비하여 약 3.3배 높은 값을 보였으며, 존재형태는 DAS1이 상대적으로 용존형태로 존재하는 비율이 높은 것으로 나타났다.
Fig. 5. The mass balance of DSBP in Tokyo Bay using the simulated results of EMT-3D.
참고문헌