2015, 26
(5)
,1087–1095
기상 및 소셜미디어 정보를 활용한 인플루엔자 예측모형
황은지
1
· 나종화2
1한국보건산업진흥원 ·2충북대학교 정보통계학과/비즈니스데이터융합학과
접수 2015년 7월 25일, 수정 2015년 9월 3일, 게재확정 2015년 9월 24일
요 약
인플루엔자는 흔히 독감으로 불리는 질병으로 인플루엔자 바이러스가 호흡기 (코, 인후, 기관지, 폐 등)에 감염되어 생기는 병이다. 감기와는 달리 심한 증상을 나타내거나 생명이 위험한 합병증 (폐 렴 등)을 유발할 수도 있다. 본 연구에서는 인플루엔자에 대한 예측모형을 다루었으며, 주로 회귀적인 모형을 고려하였다. 기존의 연구들이 주로 기상요인을 예측변수로 사용한 반면, 본 연구에서는 소셜 요인의 효과를 살펴보았으며 그 결과 기상요인과 대등한 설명력을 가짐을 확인하였다. 반응변수로는 국민건강보험공단에서 제공하는 인플루엔자 진료건수가 사용되었고, 설명변수에는 기상청에서 제공하
는 기상정보와 트위터에서의 인플루엔자 연관키워드 빈도가 사용되었다. 모형의 비교를 위해 시계열
모형도 함께 제시되었다.
주요용어: 소셜미디어, 연관키워드, 예측모형, 인플루엔자.
1. 머리말
인플루엔자는 독감 (flu) 또는 계절 독감 (seasonal flu)로도 불리는 질병으로 감기와 증상이 비슷하여 구별하기가 힘들지만, 일반적으로 감기는 증상이 약하고, 인플루엔자는 증상이 중하다. 감기는 100여가 지바이러스에 의해 발생하며, 인플루엔자는 인플루엔자 바이러스에 의해 발병한다. 인플루엔자에 감염 되면 코, 목, 폐에서 시작하여 몸 전체로 퍼지며, 인플루엔자에 걸린 사람이 기침이나 재채기를 할 때 퍼 진다. 인플루엔자는 또한 바이러스가 묻어있는 표면이나 물건을 만진 손으로 눈이나 코 또는 입을 만질 때도옮긴다. 인플루엔자의 증상으로는 38℃가 넘는 고열, 기침이나 인후염, 콧물이나 코막힘, 두통, 매 우 피곤함, 근육통, 구토, 설사, 오한 등이다.
인플루엔자 및 감기와 관련된 선행연구로는 Xiao 등 (2013), Manangan (2006), Hains와 Patz (2004), Pablo (2004), Jang (2011), Cho (2012)가 있으며, 이들 연구는 대부분 인플루엔자 (또는 감기) 와 기상정보와의 관계를 다루고 있다.
최근에는 질병 또는 경제지표 등의 예측에 소셜 빅데이터의 활용이 부상하고 있다. 질병의 예측 에 소셜정보를 활용한 연구로는 검색엔진 질의데이터를 이용하여 인플루엔자를 예측한 Ginsberg 등 (2009)의 연구가 대표적이며, 국내의 연구로는 Cho 등 (2013)이 있다. 소셜정보를 이용한 실업률 등 의 경제지표에 대한 연구는 보다 활발하며, SAS와 UN Global Pulse (2011)에서 소셜미디어와 온라 인 대화를 이용한 실업률 통계에 대한 연구를 비롯하여, Askitas와 Zimmermann (2009), Choi와 Var- ian (2012), Choi (2010), D’Amuri (2009), D’Amuri와 Marcucci (2009), Xu 등 (2012), Na와 Kim
1
(361-951) 충북 청주시 흥덕구 오송읍 오송생명2로 187, 한국보건산업진흥원, 연구원.
2
교신저자: (362-763) 충북 청주시 서원구 충대로1, 충북대학교 정보통계학과/비즈니스데이터융합학과,
교수. E-mail: cherin@cbnu.ac.kr
2. 기초분석과 적합모형
2.1. 분석자료 소개
본 연구에서는 국민보험공단에서 제공하는 인플루엔자 진료건수를 반응변수로하는 통계적 예측모형 을 구축한다. 분석에 사용될 자료는 2년 6개월간 (2011년 1월 1일 ∼ 2013년 6월 30일)의 서울시 진료 건수 (일일자료)를 사용하였다. 예측변수로는 기상청에서 제공하는 동 기간의 기상자료 (기온, 습도, 일 조량)와 트위터에서 언급된 연관키워드 (인플루엔자, 독감, 감기, 신종인플루엔자, 신종플루, 사스)의 버 즈량 (단위: 건)을 사용하였다. Figure 2.1은 동 기간의 인플루엔자 진료건수에 대한 시도표이다.
Figure 2.1 Medical treatment number of influenza (period: 2011.1.1 ∼2013.6.30, data: NHIS)
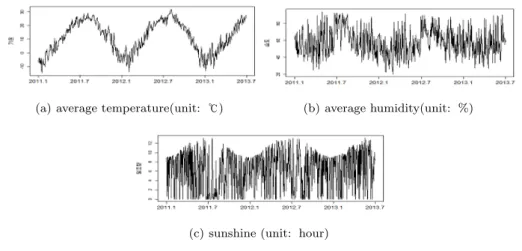
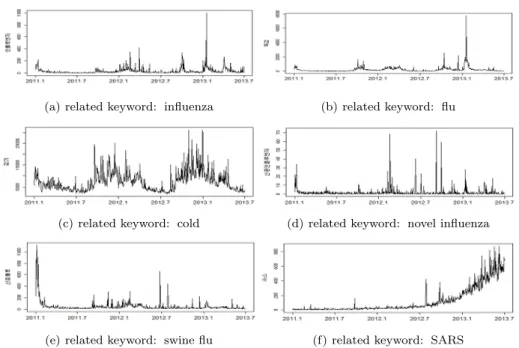
예측변수로 사용될 기상요인과 트위터로부터 추출한 주요인플루엔자 연관키워드 버즈량에 대한 시도 표는 각각 Figure 2.2와 Figure 2.3과 같다.
(a) average temperature(unit: ℃) (b) average humidity(unit: %)
(c) sunshine (unit: hour)
Figure 2.2 Time series plot of meteorological factors
(a) related keyword: influenza (b) related keyword: flu
(c) related keyword: cold (d) related keyword: novel influenza
(e) related keyword: swine flu (f) related keyword: SARS Figure 2.3 Twitter buzz amount of influenza-related keywords
2.2. 소셜정보의 수집절차
비정형데이터인 인플루엔자 질병 연관키워드의 트윗 버즈량 (소셜정보)의 수집절차는 Figure 2.4와 같다. 먼저 트위터로부터 (주)다음소프트에서 제공하는 API 서버로부터 2차에 걸쳐 데이터를 수집한 다. 1차수집에서는 트위터의 문서를 표준화, 스팸필터링, 텍스트마이닝을 수행하고, 2차수집에서는 해 당질병 (인플루엔자) 관련 연관키워드와 동의어 등에 대한 정보를 추출한다. 이때, 연관키워드의 선정 은 한국 표준질병사인분류, 지식분류체계 등을 통해 사전에 선정된다. 추출된 정보는 비정형데이터 수 집서버를 통해 데이터베이스로 저장된다.
Figure 2.4 Collection procedure of the twitter buzz (unstructured data) of the influenza-related keywords
t
모형 1은 ARIM A(p, d, q)(P, D, Q)s에 해당하는 모형으로, 이 모형의 표기에 대한 자세한 내용은 시계 열 관련 서적 (Box와 Jenkins, 1976)을 참고하기 바란다.
모형 1: 계절형 ARIMA 모형
φp(B)ΦP(Bs)(1 − Bs)D(1 − B)dZt= δ + θq(B)ΘQ(Bs)et, 여기서 δ는 상수이고, et는백색잡음 W N (0, σ2e)이며, 각 기호에 대한 정의는 다음과 같다.
φ(B) = 1 − φ1B − φ2B2− · · · − φpBp θq(B) = 1 − θ1B − θ2B − · · · − θqBq Φ(B) = 1 − Φ1Bs− Φ2B2s − · · · − ΦPBPs Θq(B) = 1 − Θ1Bs− Θ2B2s − · · · − ΘQBQs.
위 식에서, B는 후진연산자로 BbZt= Zt− b을 의미한다.
모형 2 ∼ 모형 4는 진료건수를 반응변수로 하는 회귀적인 모형을 고려한다. 일반적인 회귀모형과는 달리 모형 1의 적합결과로부터 (d = 1, D = 1로 나타남) 진료건수의 이전 1 과 7시차 (s = 7)를 예측변 수에 포함시키는 모형을 고려하되, 추가되는 예측변수로는 모형 2는 기상요인만을 포함, 모형 3은 소셜 요인만을 포함, 모형 4는 기상과 소셜요인을 모두 포함하는 모형을 고려한다. 이 모형은 모두 시계열에 서의 자귀회귀 (autoregressive) 성분과 기상 (또는/과 소셜) 성분을 예측변수로 사용하는 회귀모형으로 ARX (AutoRegressive with eXogenous) 모형으로 나타내기로 한다.
모형 2: ARX-기상 모형
yt∼ yt−1+ yt−7+ (text1)t+ (기상2)t+ · · · 모형 3: ARX-소셜 모형
yt∼ yt−1+ yt−7+ (소셜1)t+ (소셜2)t+ · · · 모형 4: ARX-기상소셜 모형
yt∼ yt−1+ yt−7+ (기상1)t+ (기상2)t+ · · · +(소셜1)t+ (소셜2)t+ · · ·
3. 모형적합 및 모형비교
3.1. 모형적합
3.1.1. 모형 1: 계절형 ARIMA 모형
로그변환된 시계열 자료 yt에 대해, 시계열 자료의 적합절차에 따라, 계절형 ARIMA 모형을 적합한 결과 ARIM A(0, 1, 1)(0, 1, 1)7 모형이 적합되었으며, 그 결과는 Table 3.1과 같다. 참고로, 적합과정에 서 1 차분과 7차분을 수행한 시계열에 대한 시도표와 ACF, PACF 도표는 Figure 3.1과 같이 주어졌다.
Figure 3.1 Time series and (ACF, PACF) plot of the series(1 − B
7)(y
t− y
t− 1)
Table 3.1 Results of seasonal ARIMA model fitting
ma1 sma1
Estimate -0.775 -0.927
Std. Error 0.019 0.029
AIC 1162.19 AICc 1162.22 BIC 1176.61
Table 3.1로부터 적합된 계절형 ARIM A(0, 1, 1)(0, 1, 1)7모형을 기술하면 다음과 같다.
(1 − B)(1 − B7)yt= (1 + 0.775B)(1 + 0.927B7)et. 즉, 위의 식을 정리하면 아래와 같다.
yt= yt−1+ yt−7− yt−8+ et+ 0.775et−1+ 0.927et−7+ 0.718et−8. 3.1.2. 모형 2 ∼모형 4: 기상 및 소셜정보를 이용한 회귀적 모형
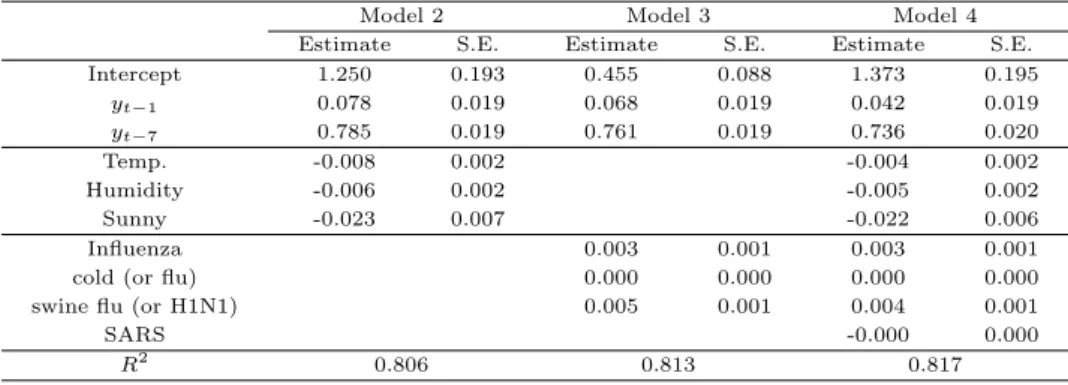
Table 3.2는 회귀적 모형 (모형 2 ∼ 모형 4)의 적합결과를 나타낸다. 표에서 추정치가 제시된 변수는 모두 유의수준 5%에서 통계적으로 유의한 것으로 나타난 변수들이다. 모형 2 와 모형 3은 각각 기상변 수와 소셜변수를 예측변수 (각각 3개씩)로 사용한 모형으로 두 모형의 결정계수가 비슷하나, 작게나마 소셜변수의 설명력이 높게 나타난 것은 주목할 만하다. 기상변수와 소셜변수를 모두 포함하는 모형 4의 경우 모형 3에 비해 설명력이 크게 개선되지는 않음을 알 수 있다. 표에서 0으로 표시된 결과는 소수이 하 3자리까지만 나타내었기 때문이다.
Table 3.2 Estimates and standard errors of regression parameters
Model 2 Model 3 Model 4
Estimate S.E. Estimate S.E. Estimate S.E.
Intercept 1.250 0.193 0.455 0.088 1.373 0.195
y
t−10.078 0.019 0.068 0.019 0.042 0.019
y
t−70.785 0.019 0.761 0.019 0.736 0.020
Temp. -0.008 0.002 -0.004 0.002
Humidity -0.006 0.002 -0.005 0.002
Sunny -0.023 0.007 -0.022 0.006
Influenza 0.003 0.001 0.003 0.001
cold (or flu) 0.000 0.000 0.000 0.000
swine flu (or H1N1) 0.005 0.001 0.004 0.001
SARS -0.000 0.000
R
20.806 0.813 0.817
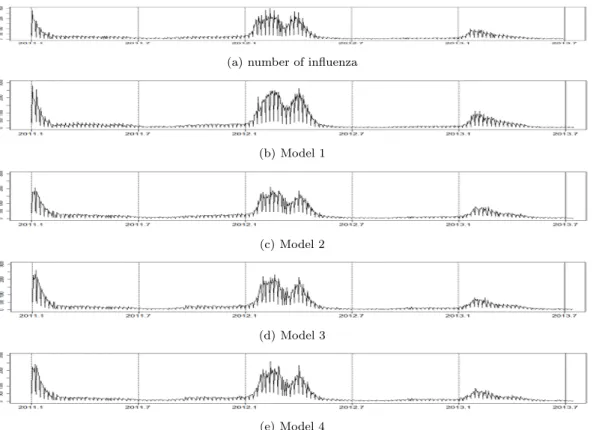
(a) number of influenza
(b) Model 1
(c) Model 2
(d) Model 3
(e) Model 4
Figure 3.2 Time series plots of the number of observed and fitted influenza
Table 3.3은 각 모형의 적합력과 예측력을 나타낸다. 사용된 평가측도로는 평균절대오차 (MAE), 평 균제곱오차 (MSE), 평균절대백분위오차 (MAPE)가 사용되었으며, 자세한 정의는 다음과 같다.
• 평균절대오차 (Mean Absolute Error):
M AE = 1 n
n
X
i=1
|yi− ˆyi| (3.1)
• 평균제곱오차 (Mean Squared Error):
M SE = 1 n
n
X
i=1
(yi− ˆyi)2
• 평균절대백분위오차 (Mean Absolute Percentage Error):
M AP E = 1 n
n
X
i=1
|yi− ˆyi| yi
× 100
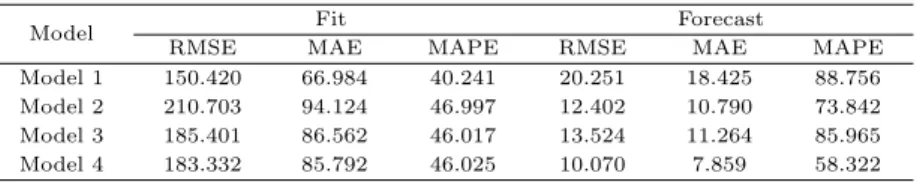
적합력은 모형 1이 가장 우수하나, 예측력에서는 모형 4가 가장 우수하게 나타나고 있다. 예측력은 회 귀적인 모형 (모형 2 ∼ 모형 4)이 모형 1 (시계열적 모형) 보다 전체적으로 우수하게 나타나고 있다. 회 귀적인 모형 가운데 모형 2 (ARX-기상모형)와 모형 3 (ARX-소셜모형)은 적합력과 예측력이 대등하게 나타나고 있다. 이 사실은 인플루엔자 질병의 예측에 소셜정보가 기상정보를 대체할 수 있음을 시사한 다.
Table 3.3 Goodness of fit of comparison models
Model Fit Forecast
RMSE MAE MAPE RMSE MAE MAPE
Model 1 150.420 66.984 40.241 20.251 18.425 88.756
Model 2 210.703 94.124 46.997 12.402 10.790 73.842
Model 3 185.401 86.562 46.017 13.524 11.264 85.965
Model 4 183.332 85.792 46.025 10.070 7.859 58.322
4. 결론 및 향후연구
4.1. 결론
인플루엔자는 심각한 질병을 유발하고 고위험군의 대상을 죽음으로도 몰고가는 심각한 질병이다. 특 히 사람간의 감염이 쉽게 이루어지므로 공중보건의 측면에서 잘 관리되어야 할 질병이다. 본 연구에서 는 국민건강보험공단에서 제공되는 인플루엔자 진료건수에 대한 예측모형을 제시하였다. 시계열 모형 과 회귀적인 모형을 동시에 고려하였으며, 특히 기존의 연구에서 다루어진 회귀적 모형들이 주로 기상요 인만을예측변수로 사용함 반면, 본 연구에서는 소셜요인 (질병 연관키워드의 트위터 버즈량)을 함께 고 려하였다. 그 결과 소셜요인이 기상요인과 대등한 설명력을 가짐을 확인하였다. 다만 본 연구에서 제시 된모형적합도를 통한 모형간의 비교는 제한적인 결과이므로, 일반화된 해석으로는 무리가 있다.
4.2. 향후연구
본 연구에서 고려된 시계열 및 회귀적 모형들은 모두 최근의 진료건수를 필요로 한다. 그러나 실제의 진료건수에 대한 정보는 일선 진료기관에서의 건강보험심사평가원을 거쳐 보고되고 전달되는 과정에서, 시차 등의 문제로 최소 30일 최대 90일 정도의 최근 진료건수에 대한 정보는 매우 불안정하다. 또한, 구 축된 모형을 이용하여 미래시점의 예측을 위해서도 기상 및 소셜변수에 대한 예측값이 전제되어야 한다.
이러한 점은 실무차원에서의 예측모형 개발에 큰 지장을 주고 있으므로, 향후의 연구에서는 이전 시차의 질병건수를 요구하는 시계열적 또는 ARX 계열의 모형 보다 기상 및 소셜정보 만을 예측변수로 하는 회 귀적 모형을 고려하되, 효율적인 예측을 위해 선행시차의 예측변수 (leading variable)를 찾아내는 것이 효과적이다.
References
Askitas, N. and Zimmermann, K. F. (2009). Google econometrics and unemployment forecasting, IZA Discussion Paper, 4201.
Box, G. E. P. and Jenkins, G. M. (1976). Time series analysis : Forecasting and control , Holden Day, San Francisco.
Cho, S. A. (2012). nvestigation of association between influenza occurrence and climate factors using time
series analysis, Master’s Thesis, Korea University, Seoul.
2-9.
D’Amuri, F. (2009). Predicting unemployment in short samples with internet job search query data, MPRA paper , 18403.
D’Amuri, F. and Marcucci, J. (2009). Google it! forecasting the US unemployment rate with a google job search index , Bank of Italy.
Ginsberg, J., Mohebbi, M. H., Patel, R. S., Brammer, L., Smolinski, M. S. and Brilliant, L. (2009). Detecting influenza epidemics using search engine query data, Nature, 457, 1012-1014.
Haines and Patz (2004). Health Effects of Climate Change, The Journal of the American Medical Associ- ation, 291, 99-103.
Jang, M. (2011). A study on the prediction of regional influenza patients by using meteorological factors, Proceedings of the Autumn Meeting of KMS , 292-293.
Lee, H. J. (2014). Analysis of statistical models on temperature at the seosan city in Korea, Journal of the Korean Data & Information Science Society, 25, 1293-1300.
Manangan, A. P. (2006). Influenza prevalence in the US associated with climate factors, analyzed at multiple spatial and temporal scales, Master Thesis, Georgia State University.
Na, J. H. and Kim, E. S. (2013). Forecasting unemployment rate using social media information, Journal of the Korea Industrial Information Systems Research, 18, 95-101.
Pablo, F. (2004). Climate, weather and flu diagnoses incidence in the region of Santander (Northern Sapain) during the 1999-2000 epidemic diffusion period, Kluwer Academic Publishers, 20, 223-228.
SAS and UN Global Pulse. (2011). Using social media and online conversations to add depth to unem- ployment statistics, White Paper , 1-21.
Son, K. T. and Kim, D. H. (2015). Development of statictical forecast model for PM10 concentration over Seoul, Journal of the Korean Data & Information Science Society, 26, 289-299.
Xiao, H., Tian, H., Lin, X., Gao, L., Dai, X., Zhang, X., Chen, B., Zhao, Z. and Xu, J. (2013). Influence of extreme weather and meteorological anomalies on outbreaks of influenza (H1N1), Prevention Medicine
& Hygienics, 58, 741-749.
Xu, W., Li, Z. and Chen, Q. (2012). Forecasting the unemployment rate by neural networks using search
engine query data, 2012 45th Hawaii International Conference on System Sciences, 3591-3599.
2015, 26
(5)
,1087–1095
Influenza prediction models by using meteorological and social media informations
Eun-Ji Hwang
1
· Jong-Hwa Na2
1Korea Health Industry Policy Development Institute
2Department of Information and Statistics/Business Data Convergence, Chungbuk National University
Received 25 July 2015, revised 3 September 2015, accepted 24 September 2015
Abstract
Influenza, commonly known as “the flu”, is an infectious disease caused by the influenza virus. We consider, in this paper, regression models as a prediction model of influenza disease. While most of previous researches use mainly the meteorological variables as a predictive variables, we consider social media information in the models.
As a result, we found that the contributions of two-type of informations are compa- rable. We used the medical treatment data of influenza provided by Natioal Health Insurance Survice (NHIS) and the meteorological data provided by Korea Meteorologi- cal Administration (KMA). We collect social media information (twitter buzz amount) from Twitter. Time series model is also considered for comparison.
Keywords: Influenza, prediction model, related keyword, social media.
1
Researcher, Korea Health Industry Policy Development Institute, Chungbuk 361-951, Korea.
2