Fisheries Oceanography Lab.
26
0
0
전체 글
(2) Park et al (1998) Kang (2002) Choi et al (2008). Zhang et al. (2004). Zhang et al.(2004). Minobe, 1997; Murata, 1989, Sakurai et al., 2000.
(3) 이 (1992) Fig. -left: distribution area of squid, . Todarodes pacificus. -right: schematic diagram of currents in the Northwest pacific. Fisheries Oceanography Lab..
(4) Annual fluctuation of squid catch in the East/Japan Sea and the Northwest Pacific from 1970 to 2000. Squid catch data for the North West Pacific are from FAO2005, and for the East/Japan Sea from NFRDI and MAFFJ. Fisheries Oceanography Lab.. Schematic diagram of triangle migration of common squid in Korean waters..
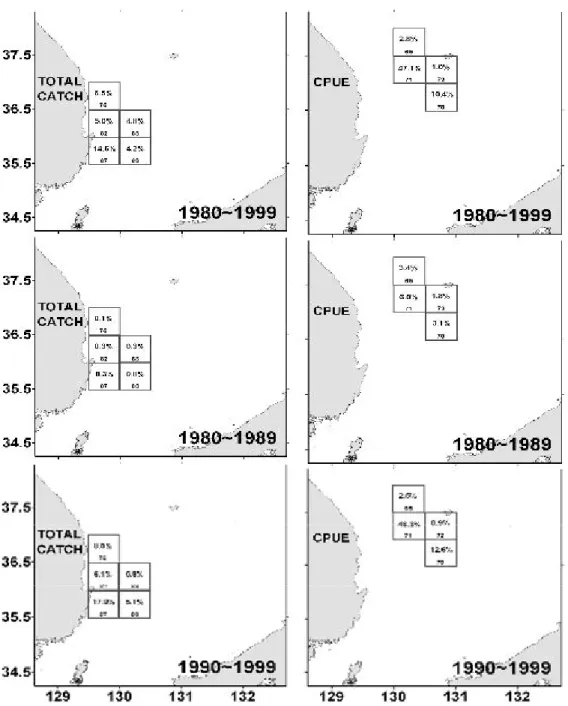
(5) Choi et al (2005). Ellipses determined from the monthly average. catch. distributions. by. Choi et al (2005). the. Korean jig fishery from 1980 to 1999. (a)northward. movement. of. fishing. movement. of. fishing. grounds (b)southward grounds.. Main fishing ground 10°C isothermal line at 100m depth. Fisheries Oceanography Lab..
(6) Fig. High total catch (left) & CPUE(catch/gear/day, right) area..
(7) Squid zone and every two monthly mean 10℃ lines at the depth of 50m (left) and 100m (right) from 1980 to 1989 (upper) and 1990 to 1999 (lower) in the East Sea (red squre : High level CPEU area, blue squre : High level total catch area).. Schematic view of vertical profile of 10℃ face and common squid's migration path in theEast Sea..
(8) Lee (2003), Simura (2009): Highly correlation between Tsushima Warm Current and Water temperature in the East Sea Hong and Cho (1983) Lee (2003) A B. B. Anomaly (oC) Anomaly (oC). WT (oC)at 100m. WT (oC)at 0m. A. Fig. Time series change at 50m and 100m depth during winter season (Jan-Mar) from 1960 – 2008..
(9) Fig. Left : Difference between catch in 1993 (good fishing) and mean catch. Right: Horizontal distribution of mean water tempeature at 50m from Aug. to Oct. in 1993. (오징어 풍어기의 해구별 어획량 분포 및 50m수심의 수온 수평 분포) Fisheries Oceanography Lab..
(10) Fig. Left : Difference between catch in 1986 (poor fishing) and mean catch. Right: Horizontal distribution of mean water tempeature at 50m from Aug. to Oct. in 1986. (오징어 흉어기의 해구별 어획량 분포 및 50m수심의 수온 수평 분포) Fisheries Oceanography Lab..
(11) Fig.Horizontal distributions of annually average of zooplankton biomass(mg/m3) from 1980 to 1990 and from 1991 to 1999 in the East sea of korea.
(12) Offshore jigging Large powered purse seine. Large otter trawl Fishing grounds by fishery of common squid in Korean waters (Lee et al., 2009). The shaded area and circles represent the study area, and total squid catch in each grid (0.5˚ latitude x 0.5˚ longitude) during 1980-1999. (Choi et al., 2008).
(13) 기후 변화에 따른 해역별 어획량의 변화 원인 해석 30. East Sea. 20. 10. 0. 50. JAN. MA R. MA Y. J UL. S EP. NO V. 1993. Russia EEZ. 40 30 20. Ratio (%). 10 0. 40. JAN. 30 20. MAR. MAY. JUL. S EP. NOV. Yellow Sea. 10. Yellow Sea. 0. East Sea South Sea. JA N. 40. MA R. MA Y. J UL. S EP. NO V. South Sea. 30 20 10 0 JA N. MA R. MA Y. J UL. S EP. NO V. Month. Annual and monthly fluctuations in common squid Todarodes pacificus catches by sea area (Choi, 2005). 1986.
(14)
(15) Why this difference in the East Sea catch?. J. BAD CONDITIONS. an p a. Ko re a. Ko re a. GOOD CONDITIONS. J. an p a. ?. X X. Paralarvae migration Spawning migration. Spawning ground Sakurai (2009).
(16) Minami et al., 1999. Anomalies of zooplankton biomass along PM line. (PM 라 인 상 의 동물플랑크톤 생체량의 편차). Zooplankton biomass in the eastern sector of serial observation area of NFRDI (동물플랑크톤 평 균 생체량의 연변 동) Fisheries Oceanography Lab..
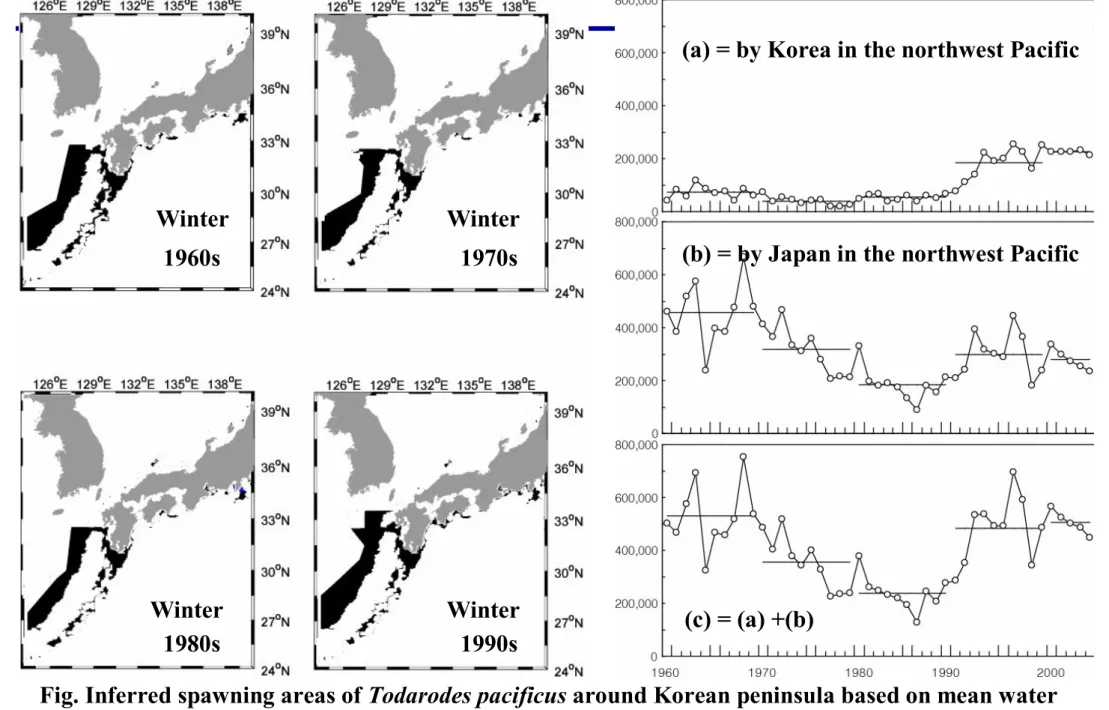
(17) Fig. Annual fluctuation of squid catch in the East/Japan Sea and the Northwest Pacific from 1970 to 2000. Squid catch data for the North West Pacific are from FAO, and for the East/Japan Sea from NFRDI and MAFFJ (북서태평양 및 동해에서 한국과 일본의 살오징어 연간 총어획량). Fisheries Oceanography Lab..
(18) Cold. Warm. Fig. Annual fluctuation of squid catch in theWarm East/Japan regimeSea and the Northwest Pacific from 1970 to 2000. Squid catch data for the North West Pacific are from FAO, and for the East/Japan Sea from NFRDI Cold regime and MAFFJ (북서태평양 및 동해에서 한국과 일본의 살오징어 연간 총어획량). Fig. Annual changes of abundance of T. pacificus paralarvae / 1000m3 (Oct-Nov) and CPUE (kg/day , May-Oct, Japan Sea) (Goto et al, 2002) Fisheries Oceanography Lab. (살오징어 어획량 및 유생 개체수의 연변화).
(19) 3 annual cohorts: autumn, winter and summer Winter. Autumn. Spawning ground. Feeding migration. Feeding ground Spawning migration. Sakurai et al. (2009).
(20) (a) = by Korea in the northwest Pacific. Summer Winter Autumn 1960s 1960s 1960s. Summer Winter Autumn 1970s 1970s. Summer Winter Autumn 1980s 1980s 1980s. Summer Winter Autumn 1990s 1990s. (b) = by Japan in the northwest Pacific. (c) = (a) +(b). Fig. Inferred spawning areas of Todarodes pacificus around Korean peninsula based on mean water temperature Embryonic development (15-23℃) over the continental shelf and slope isobaths of 100500m. (매 10년마다 여름, 가을, 겨울철 산란장 변동 추정) Fisheries Oceanography Lab..
(21) Time series change in squid catch and spawning ground area. C a tc h e s (x 1 ,0 00 m t). 250 200. Korea. 150 100 50 0 1980. 추정된 산란장과 오징어 어획량간의 상관계수 상 관 계 수. C a tc h (x 1 ,0 0 0 m t). Angling G illnet 500. 400. 1985. Traw l Setne t. 1990 Y ear. 1995. Purs e s eine Other. 2000. Sto w net. Choi (2005) Japan. 300 200 100 0. R. 0.61. R(3 yr). 0.74. 3년 이동평균간의 상관계수. R(5 yr). 0.81. 5년 이동평균간의 상관계수. 1980. Angling. 1985. Trawl. 1990 Year. 2000. 1995. Setnet. Other. Annual fluctuations in common squid Todarodes pacificus catches by fishery in Korea..
(22) 위성 SST => 산란장 추정 ? -현장관측 자료의 한계 -DB구축의 시간적 지연 -공간분해능의 문제 등. 1981-2008. Jan - Mar. Winter 1960s. Winter 1970s. 1981-2008. Jul - Sep. 1981-2008. Winter 1980s. Winter 1990s. Oct - Dec.
(23) V. (sour olume T ce:Ta kikaw ra nspor t a and Yoon , 2005. te r Wa. ). e tur a r pe te m. Spectrum analysis : top – volume transport, bottom – water temperature.
(24) Horizontal circulation patterns after Kondo (1985), Ichikawa and Beardsley (2002), and Lie and Cho (2002).. Schematic of the main surface current system in the Northwest Pacific (modified from Senjyu (1999) and Ichikawa and Beardsley (2002)..
(25) 정리하면… 1)어장/자원량의 변동 원인 및 향후 변동 경향 예측 [기존의 해어황 요소간의 연구 +] - Local Environmental Index 개발 - 어획량에 근거한 자원량 조사(추정) 방법의 개선 - 장기적인 환경변화 양상을 고려한 변동 시나리오 - 다양한 분야에서 자료의 공동 활용 2) 산란장 환경조사 - 산란장에 대한 현장조사(卵 조사, 산란장 환경 조사) - 다양한 환경인자에 대한 복합적인 분석 - Satellite image => 산란장 추정.
(26) 대체 언제까지 우려 먹을 거니?.
(27)
수치


+2
관련 문서
In order to offer data about fisheries resources management and prediction of catch on large purse seine fisheries, the fluctuation of the fisheries condition and distributions
영문정보지명 East Sea Regional FRI Oceanography and Marine Fisheries Resources
영문정보지명 East Sea Regional FRI Oceanography and Marine Fisheries Resources
영문정보지명 East Sea Regional FRI Oceanography and Marine Fisheries Resources
영문정보지명 East Sea Regional FRI Oceanography and Marine Fisheries Resources
동해수연 해어황 정보지, 제80호 Newsletter of the Oceanography and Fisheries Resources, East Sea Fisheries Research Institute, No.80.. 동해 해어황 정보 - 2006년 8월
Influences of Climate Factors and Water Temperature in Squid Spawning Grounds on Japanese Common Squid (Todarodes pacificus) Catches in the East (Japan)
Fisheries 2007 Export strategy items Tuna, Cod, Mackerel, Squid, Mackerel Chop, Halibut, Abalone, Sea cucumber, Seaweed Major Strategy items Squid, Tuna,
