서울지역에 거주하는 체중 감량 시도자의 성별, 연령별 체중 조절 실태
두미애․김양하
†
이화여자대학교 식품영양학과Study on the Status in Body Weight Loss Practice According to Age and Gender of Subjects with Experiences of Attempting to Lose Weight in Seoul
Miae Doo and Yangha Kim
†
Dept. of Nutritional Science and Food Management, Ewha Womans University, Seoul 120-750, Korea
Abstract
Among current health-related problems, the issue of over-weight is considered one of the most important, fostering a national interest in body weight loss. In this study, an awareness of one's current body weight and previous experiences of body weight loss were analyzed according to age and gender. The subjects of the study were 720 people (male: 360 and female: 360) aged 10~60 years with previous experiences of attempting to lose weight 1 year prior to this study. Anthropometrics, general characteristics, awareness of one’s current body weight, and the body weight loss practice were analyzed through a questionnaire.
Approximately 73.2% of the subjects recognized themselves as obese, and 83.5% wished to lose weight. The older the subjects were, the frequency of attempting to lose weight was lower, and those who succeeded in losing weight maintained their reduced body weight for a longer period. Compared to male subjects, more female reported attempts of losing weight, but the period of maintaining their reduced weight was shorter.
The older subjects reported a higher satisfaction rate of the weight loss methods they used, and few of them gained back the weight they lost. This phenomenon was especially more stronger among male than female subjects. From our studies, it may be concluded that attitudes concerning a person’s current body weight and body weight loss practice vary according to age and gender.
Key words: obesity, body weight loss practice, age, gender, yo-yo dieting
†Corresponding author. E-mail: [email protected]
†Phone: 82-2-3277-3101, Fax: 82-2-3277-2862
서 론
2005년 세계보건기구(WHO) 자료(1)에 의하면 전 세계적 으로 비만 인구는 약 4억 명이며 10년 후인 2015년에는 약 7억 명 이상 증가할 것으로 보고하고 있다. 우리나라의 경우 2005년 국민건강영양조사(2)에 의하면 비만 유병률(20세 이 상)은 전체 31.7%로 1998년 26.3%, 2001년 29.6%와 비교 시 점차 증가하는 추세이다. 이에 따라 비만의 예방 또는 치료 를 위한 비만 관리 영양프로그램이 개발되고 있으며, 과체중 이거나 비만인 사람들이 체중 감량 프로그램에 참여하거나 체중 감량을 시도하는 사람의 비율 또한 증가하고 있다 (3-6). 2005년 국민건강영양조사(2)에서 지난 1년간 체중 조 절 시도율은 성인의 43.47%, 청소년 36.4%로 나타났고 남성 보다 여성이, 연령이 낮을수록 체중조절을 위해 노력을 하였 다고 보고하였다.
비만은 과잉의 열량이 축적되어 발생하므로 체중 감량은 영양적으로 균형된 식사를 하면서 열량의 섭취를 제한하고 규칙적인 운동을 병행하는 과학적인 방법으로 이루어져야
한다(7). 그러나 실제로 대부분의 체중 감량을 위하여 보다 빠르고 간편한 방법으로 단기간의 운동이나 과도한 식이 제 한을 선호하고 있으며 지나친 체중 감소에 의해 건강을 해치 는 결과를 초래하기도 한다. 적당한 운동 없이 열량을 제한 한 식사를 한 경우 체중 감소와 지방의 감소는 있을 수 있으 나 제지방과 기초대사량도 함께 저하되어 다시 체중이 증가 되기 쉽다(8).
비만한 사람일 경우 비만으로 인한 합병증도 건강을 해치 는 요인이기는 하나, 맹목적인 체중 감량시도로 인해서 잦은 요요현상을 경험하게 되고 체조성의 변화로 인해 더욱 비만 해지기 쉽고 성인병과 사망률에 영향을 미치기 쉽다. 체중 감량 후 체중이 증가되는 현상인 요요현상을 막기 위해서는 장기간 적극적인 노력을 해야 하며 감량된 체중이 유지되는 시간이 길면 길수록, 장기적으로 체중이 증가될 가능성이 적어진다(9). 그러나 감소된 체중을 유지하는 어려움은 반복 적인 체중 조절 시도를 하게끔 만들고, 이러한 체중 증감은 최근 비만보다 오히려 건강에 더 해롭다는 견해의 연구들이 보고되었다(10-12). 요요현상을 보인 사람은 심장병의 위험
을 증가시키고(10), 나중에 체중을 오히려 증가시켰다고 보 고하였고(10,11), 다른 연구에서는 요요현상이 체내 지방의 비율, 특히 복부 지방을 증가시켜 건강 위험을 증가시키고, 사망률을 증가시킨다고 주장하였다(12).
사실 체중 조절 시도 자체가 문제가 되는 것은 아니다.
그러나 이러한 현상이 문제가 되는 것은 실제로 비만인 경우 뿐만 아니라 저체중 또는 정상체중인 경우에도 자신의 외모 및 체형에 대한 왜곡된 인식에 의해 체중 감량을 시도하고 있으며, 특히 연령이 낮고 여성일수록 체중 감량 시도가 많 다는 점이다(13). 이러한 시도가 대부분 비만이 가져오는 유 해성을 고려하여 건강관리를 위한 시도가 아닌 단지 날씬해 져야 한다는 생각 즉, 외모를 관리하려는 차원에서 생각하는 인식 및 태도에 임하고 게다가 정확한 영양지식을 기반으로 하는 것이 아니라 잡지나 TV 등 대중매체에서 과학적 근거 가 없는 식품이나 식사법에 대해서 잘못된 과신을 가지고 이루어진다는 점이다(14,15).
최근 국내에서 비만에 대한 관심이 높아짐에 따라 연구는 많이 이루어지고 있으나, 연구들의 주 대상이 여학생이나 성인여성, 아동 등에 국한되어 각 연령층이나 성별에 따른 연구는 이루어진 바가 없다. 또한 연령과 성별에 따른 체중 감량 실태에 대한 연구는 전무한 상태로 올바른 체중 감량을 위한 지침을 만들기는 부족한 상태이다.
그러므로 본 연구에서는 현재 체중에 대한 인식과 체중 감량 실태를 남녀 각각에서 연령에 따라 어떠한 차이를 나타 내는가를 조사 분석하여 맞춤형 체중 감량을 위한 영양교육 개발안의 토대를 제시하고자 하였다.
연구내용 및 방법
연구대상 및 조사내용
본 연구의 대상자는 서울에 거주하며 지난 1년간 체중 감 량 시도를 경험한 사람들 중 10~60대의 남녀 각각 60명씩 전체 720명을 임의로 선정하였다. 연구 조사 기간은 2006년 12월 1일부터 2007년 1월 31일이었다. 설문지 내용은 일반사 항, 체격, 현재 체중에 대한 인식과 만족 정도와 체중 감량 경험 및 결과를 파악할 수 있는 문항을 포함하도록 개발되었 으며, 조사는 설문지를 이용하여 전화 면담으로 수행되었다.
조사대상자의 현재 체중에 대한 인식은 ‘살찐 편이다’, ‘정 상(표준)체중이다’와 ‘마른 편이다’로 세 가지의 주관적인 응 답들을 세 가지 항목으로 분류하였다. 현재 체중에 대한 만 족 정도는 ‘살쪄야 한다’, ‘매우 만족한다’와 ‘날씬해져야 한 다’의 세 가지 항목으로 분류하였다.
체중 감량 경험 및 결과로는 지난 1년 이내의 체중 감량 경험 횟수와 최대 체중 감량 기간 및 감량 체중, 체중 감량 방법에 대한 만족도와 요요현상 경험여부를 조사하였다. 체 중 감량 경험 횟수는 1회, 2회와 3회 이상의 세 가지 항목을 포함하였다. 최대 체중 감량 기간은 감량된 체중을 최대 유
지하였던 기간에 대하여 1~2주, 1개월, 2~3개월, 6개월 이 내, 6개월 이상의 항목을 포함하여 조사하였다. 또한 체중 감량 방법에 대한 만족도는 ‘매우 만족했다’에 5점, ‘전혀 만 족하지 않았다’에 1점으로 계산한 5점 척도로 측정하여 여러 가지 체중 감량에 대한 만족도의 평균값으로 계산하였다.
요요현상은 체중 감량을 통하여 체중이 감소되었다가 다시 체중이 증가되었는지의 경험 여부를 조사하였으며, ‘있었다/
없었다’ 중 하나를 선택하도록 하여 평가하였다.
자료의 처리 및 분석
본 연구의 모든 조사 자료의 통계처리는 SPSS(Statistical Package for the Social Science version 12.0)를 이용하여 분석하였다. 모든 빈도와 백분율은 chi-square test를 이용 하여 검증하였다. 체격과 최대 감량 체중, 체중 감량 방법에 대한 만족도는 평균과 표준오차를 구하고 유의성은 one- way ANOVA를 이용하였고, Scheffe's multiple range test 를 통해 사후분석을 실시하였다.
결과 및 고찰
조사대상자의 체격
조사대상자의 평균 연령은 남성 39.9세, 여성 39.3세였다 (Table 1). 성별에 따른 신장과 체중은 남성의 경우 172.8 cm와 71.9 kg이었고, 여성의 경우 160.1 cm와 57.6 kg이었다 (Table 1). 한국인 영양섭취기준 설정을 위한 체격 기준치 (16)에서는 10대(10~19세) 남성 165.5 cm와 65.5 kg, 여성 157.5 cm와 49.8 kg, 20대(20~29세) 각각 173.0 cm와 63.8 kg, 160.0 cm와 56.3 kg, 30대~40대(30~49세) 170.0 cm와 63.6 kg, 157.0 cm와 54.2 kg, 50대 이상(50세~) 165.0 cm와 59.5 kg, 152.5 cm와 51.2 kg로, 본 연구의 조사대상자와 비교 시 모든 연령에서 신장과 체중이 다소 높게 나타났다. 이러 한 결과는 본 연구의 조사대상자가 서울에 거주하고 있는 점을 고려할 때 생활수준과 소득 증대에 따른 양호한 영양상 태의 결과라고 보인다.
BMI의 경우 남성 24.2 kg/m2, 여성 22.5 kg/m2로 성별에 따른 유의적인 차이를 보였다(p<0.05). 남성의 비만도를 평 가한 Lee 등(17)의 연구에서는 연령에 따른 BMI의 유의적인 차이는 보이지 않았다고 보고하였으나 본 연구의 남성은 10 대가 가장 낮았으며 50대에서 가장 높아 연령에 따른 유의적 인 차이를 보였다(p<0.05). 여성은 연령이 증가할수록 BMI 도 유의적으로 증가하여(p<0.05), 여성의 비만도를 평가한 연구들의 결과(7,18)와 유사하였다. 희망 체중은 남성 66.4 kg, 여성 51.1 kg으로 실제체중보다 낮았으며, 남성 30대가 6.8 kg, 여성 20대가 8.0 kg로 현재 체중에 비하여 희망 체중 의 차이가 가장 큰 것으로 나타났다. 또한 실제 체중과 희망 체중의 차이는 남성에 비하여 여성이 높아 기존의 연구 결과 (19,20)와 유사하게 성별에 대한 유의적인 차이를 보였다 (p<0.05). 남성과 달리 여성은 연령이 증가할수록 현재 체중
Table 1. Anthropometric variables and BMI according to age and gender
All 10~19
(n=120)
20~29 (n=120)
30~39 (n=120)
40~49 (n=120)
50~59 (n=120)
60~69 (n=120)
Age (year)
Male Female
39.9±16.81) 39.3±16.6
16.1±1.7a2) 16.0±1.8a
24.9±2.7b 24.9±2.7b
34.1±2.8c 33.2±2.8c
45.5±2.9d 44.7±3.2d
55.0±3.3e 53.3±2.7e
63.5±2.6f) 63.8±2.9f) All 39.6±16.7 16.0±1.8a 24.9±2.7b 33.7±2.8c 45.1±3.0d 54.1±3.1e 63.6±2.7f)
Height (cm) Male
Female
172.8±6.2 160.1±5.4
171.6±8.4a 160.5±4.9ab
174.8±5.0c 162.2±4.3a
174.6±4.6c 161.8±5.2a
172.5±5.1bc 159.4±4.9ab
170.8±5.9ab 159.5±6.0ab
168.7±5.4a 157.3±5.5b Body weight (kg) Male
Female
71.9±9.8 57.6±7.4
65.5±10.4a 54.4±6.8a
72.3±9.0b 56.5±8.0ab
76.6±10.4bc 56.9±8.6ab
73.5±8.2b 57.5±5.9ab
73.5±9.6b 59.7±5.9b
70.1±7.4abd 60.6±6.9b
BMI Male
Female
24.2±2.9 22.5±2.8
22.2±2.9a 21.1±2.3a
23.6±2.7ab 21.5±3.0a
25.1±3.3b 21.7±2.8a
24.7±2.7b 22.6±2.5ac
25.2±2.7b 23.5±2.4bc
24.6±2.1b 24.4±2.3be Desired
body weight (kg)
Male Female
66.4±7.2 51.1±5.6
60.0±8.1a 46.7±4.5a
66.9±5.6b 48.5±3.4ab
69.8±6.1b 49.6±4.8bc
68.0±6.5b 51.8±5.1cd
67.3±6.5b 53.9±4.7de
66.2±6.3b 56.2±5.2e Difference of actual and
desired body weight (kg) Male Female
5.5±6.9 6.5±5.2
5.5±7.9 7.7±4.8a
5.4±7.4 8.0±6.9a
6.8±7.3 7.4±5.6ab
5.5±6.1 5.7±4.6ab
6.2±7.5 5.8±4.6ab
3.8±4.3 4.4±4.4b
1)Mean±SD.
2)Different superscripts were significantly different among each age group at p<0.05 according to Scheffe's multiple range test by one-way ANOVA.
과 희망 체중의 차이가 감소하는 경향을 보여(p<0.05), 연령 이 증가할수록 현재 체중에 대한 불만이 적은 것으로 나타났다.
현재 체중에 대한 인식과 만족 정도
현재 체중에 대한 인식을 조사한 결과 전 연령대에서 73.2% 이상에서 ‘살찐 편’이라고 인식한 반면, ‘마른 편’이라 고 응답한 비율은 6.0%이었다(Fig. 1). 성별에 따른 현재 체 중에 대한 인식은 남성의 경우 ‘살찐 편’이 66.7% 이상, ‘마른 편’이라고 대답한 경우가 15.0% 이하인 반면, 여성은 ‘살찐 편’이 76.6% 이상, ‘마른 편’이 5.0% 이하가 대답하여 성별에 따른 유의적인 차이를 보였다(p<0.05). 기존의 같은 조사대 상자에 대한 연구(21)에서도 현재 체중에 비하여 남성의 7.0%, 여성의 10.7%가 체중 감량을 원하고 있는 것으로 나타 나 남성에 비하여 여성이 현재 체중을 과대평가하는 것으로 조사되었다. Kim 등(22)은 고등학생을 대상으로 한 연구에 서 남고생에 비하여 여고생은 자신의 체중을 실제보다 더 비만하다고 평가하였으며, 성인을 대상으로 한 연구(23)에 서 남성의 정상체중군의 39.5%가 자신의 체중이 적게 나간 다고 인식한 반면, 여성에서는 정상체중군의 36.5%가 체중 이 많다고 인식하였다고 보고하였다. 또한 Miller 등의 연구 (24)에서는 대부분의 남성(59.6%)이 자신의 체중이 많지 않 다고 인식한 반면, 대부분의 여성(53.1%)은 자신의 체중이 많다고 대답하여 본 연구와 유사하게 남성에 비하여 여성이 본인의 체중에 대해 과대평가하는 경향을 나타내었다. 그러 나 국민건강영양조사(2)에서의 20세 이상 성인의 비만 인식 률의 항목에서 남성 30.4%, 여성 39.4%와 비교하였을 때, 본 연구의 대상자들의 비만으로 인식하는 비율이 2배 이상 높게 나타나 조사대상자의 대부분이 체중에 상관없이 ‘살찐 편’이라고 인식하는 것으로 나타났다.
남성의 경우 ‘살찐 편’이라고 인식하는 대상자의 비율을
65
20 15
65
20 15
83.4
8.3 8.3 78.4
18.3 3.3
78.3
15 6.7
66.7
28.3
5
0 20 40 60 80 100
10~19 20~29 30~39 40~49 50~59 60~69
R e c o g n it io n ( % )
Obese Normal Lean
71.6
26.7
1.7 58.4
38.3
3.3 71.7
23.3
5 85
13.3 1.7
83.4
13.3 3.3
71.7
25
3.3
0
20 40 60 80 100
10~19 20~29 30~39 40~49 50~59 60~69
Reco gni ti on (% ) .
Obese Normal Lean A
B
Fig. 1. Recognition to the current body weight according to age and gender (A: male, B: female). Significant differences between each group measured by the Chi-square test; All be- tween-age comparisons within male were statistically significant different (p<0.05). The differences of gender were also statisti- cally signifiant (p<0.05)
연령별로 분석해 보면 30대에서 73.3%로 가장 높았고, 반면 에 10대와 20대에서 65.0%로 가장 낮게 나타나 연령에 따른 유의적인 차이를 보였다(p<0.05). 여성은 ‘살찐 편’이라고 인 식하는 대상자의 비율이 40대가 85.0%로 가장 높았고 20대
가 58.3%로 가장 낮게 나타났으나, 연령에 따른 유의적인 차이는 보이지 않았다.
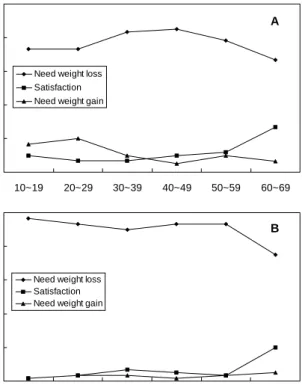
현재 체중의 만족 정도(Fig. 2)에 있어서, ‘날씬해져야 한 다’라는 항목에 응답한 여성이 90.3%로 남성 76.7%에 비해 유의적으로 높아, 여성이 현재 체중에 대한 만족도가 낮으며 체중 감량을 더 원하고 있음을 알 수 있었다(p<0.05). 남성의 11.4%가 ‘살쪄야 한다’라고 응답한데 반해, 여성은 3.1%만이 체중 증가를 원하고 있었다. 기존의 연구(25)에서 연령에 따 라 체형 불만족도가 증가하고 남성보다 여성이 불만족도가 높다고 보고하다. Cachelin 등(26)은 남성 26%가 체중 증가 를 원하는 반면 9%의 여성만이 체중 증가를 원하였고, 54%
의 남성과 66%의 여성이 체중 감량을 원한다고 보고하여 본 연구 결과와 같이 체중 증가를 원하는 남성이 여성에 비 해 많았고, 남성에 비해 여성이 체중 감소를 더 원하고 있음 을 보여주었다.
60대를 제외한 모든 연령층의 83.3% 이상이 ‘날씬해져야 한다’라고 응답하였다(Fig. 2). 남성 40대 85.0%가 ‘날씬해져 야 한다’라고 가장 높은 응답을 한데 비하여, 60대 66.7%로 가장 낮은 응답률을 보였다. 여성은 ‘날씬해져야 한다’라는 응답률은 10대 96.7%로 가장 높았으나 60대가 75.0%로 낮았 다. 대부분의 조사대상자들이 체중 감량을 원하고 있으며 특히 청소년기 여학생들의 체중 감량 의사가 높게 나타나
0 20 40 60 80 100
10~19 20~29 30~39 40~49 50~59 60~69
Des ire to the current bo dy w e ig h t (% ) .
Need weight loss Satisfaction Need weight gain
A
0 20 40 60 80 100
10~19 20~29 30~39 40~49 50~59 60~69
Desire to the current bo dy we ig h t (% ) .
Need weight loss Satisfaction Need weight gain
B
Fig. 2. Desire to the current body weight according to age and gender (A: male, B: female). Significant difference for each group measured by Chi-square test; All between-age compar- isons within each gender were statistically significant different (p<0.05 both male and female). The differences of gender were also statistically signifiant (p<0.05).
청소년기 성장 발달에 우려가 예상되고 있음을 보여주었다.
체중 감량 실태
최근 1년 동안의 체중 감량 횟수는 남녀 20대를 제외한 모든 연령대에서 1회가 가장 높았다(Fig. 3). 성별에 따른 체중 감량 횟수는 남성에 비해 여성이 높았으며, 1회 시도율 은 남성 53.3%와 여성 36.1%를 보였고 3회 이상은 남성과 여성 각각 18.1%와 34.2%로 유의적인 차이를 보였다(p<0.05).
남성에 비해 여성이 신체에 대해 더 민감하게 생각하고 있으 며 이러한 결과, 신체적 불만족 정도가 높을 경우 체중을 감량하고자 하는 시도율이 높았다라고 보고한 Krain 등의 연구(27)와 같은 결과로 보인다. 체중 감량 횟수가 1회라는 응답률은 남녀 모두 60대에서 가장 높았다(남성: 71.7%, 여 성: 60.0%). 여성은 남성에 비해 체중 감량 시도 횟수가 많았 고 특히, 10대에서 가장 높은 결과를 보였으며 연령에 따라 서 시도 횟수가 유의적으로 감소하는 경향을 보였다(p<0.05).
체중 감량 유지기간(Fig. 4)에 대해서 6개월 이상 유지했 다고 대답한 남성은 15.0%로 여성의 9.7%에 비하여 높아 남성이 여성에 비해 체중 감량 유지기간이 유의적으로 긴 것을 알 수 있었다(p<0.05). 남녀 모두에서, 10대는 체중 감 량 유지기간이 1~2주라고 응답한 대상자가 높았고(남성:
53.3%, 여성: 73.3%), 60대는 6개월 이상 유지하였다는 응답
0 20 40 60 80 100
10~19 20~29 30~39 40~49 50~59 60~69
E x per ienc e of bod y w e ight l o s s pr ac ti c e ( % ) .
Once Twice
>three time
A
0 20 40 60 80 100
10~19 20~29 30~39 40~49 50~59 60~69
E x per ienc e of body w e ight l o s s pr ac ti c e ( % )
.Once Twice
>three time
B
Fig. 3. Experience of body weight loss practice according to age and gender (A: male, B: female). Significant difference for each group measured by Chi-square test; All between-age comparisons within female were statistically significant different (p<0.05). The differences of gender were also statistically signi- fiant (p<0.05).
Table 2. The maximum values of body weight loss according to age and gender
All 10~19
(n=120)
20~29 (n=120)
30~39 (n=120)
40~49 (n=120)
50~59 (n=120)
60~69
(n=120) p-value1) Male
Female
5.0±3.3 4.7±3.2
5.9±4.2a2) 3.8±2.3a
5.7±3.6a 5.8±3.6b
5.1±3.2 5.1±2.9
4.9±2.8 4.4±2.8
5.0±3.1 4.7±3.2
3.6±2.1b 4.5±4.0
0.002 0.019
1)p-value by one-way ANOVA.
2)Mean±SD. Different superscripts were significantly different among the each group at p<0.05 according to Scheffe's multiple range test.
53.3
30 41.6
25 43.3
23.3 38.3
35 30
10 20
1.7 3.3 1.7
8.3
1.7 10 13.3
8.4 5
15 15
33.3
21.7 21.7
31.7
11.7 16.7
21.7
8.3
0 20 40 60 80
10~19 20~29 30~39 40~49 50~59 60~69 The l onges t m a in tenan ce per iod
.of r educed body w e ight (% )
1~2WK ~1Mon
2~3Mon ~6Mon
>6Mon
A
73.3
36.7 40
30 25
15
18.3 26.7
40
6.7 30
18.3 18.3
1.7
6.7 5 5 6.7
3.3 10
5 5
28.3 26.7
21.7 30
23.3 31.7
3.3
8.3
0 20 40 60 80
10~19 20~29 30~39 40~49 50~59 60~69
The l o nges t m a in te n ance p e ri od
.o f r educ ed body w e ight ( % )
1~2WK ~1Mon
2~3Mon ~6Mon
>6Mon
B
Fig. 4. The longest maintenance period of reduced body weight according to age and gender (A: male, B: female).
Significant differences between each group measured by the Chi-square test; All between-age comparisons within each gen- der were statistically significant different (p<0.05 both male and female). The differences of gender were also statistically signi- fiant (p<0.05).
이 가장 높게 나타났다(남성: 33.3%, 여성: 26.7%). 연령이 증가할수록 유의적으로 체중 감량 유지기간이 길게 나타나 (p<0.05), 연령이 증가할수록 1년 동안 체중 감량 유지를 했 다는 비율이 남녀 모두에게 높게 나타난 연구(28)와 유사한 결과를 보였다. 그러나 Green 등의 연구(29)에서 여성에서 연령이 증가할수록 체중에 대한 불만족도와 체중 감량 횟수 는 음의 상관성을 보였으나 남성에게는 이러한 연관성이 보 이지 않았다고 보고하여 불만족도와 체중 감량 횟수의 연관 성에 대한 연구가 필요하리라 생각된다.
연령이 낮을수록 체중 감량 시도 횟수는 많으나 체중 감량 후 유지기간이 짧았고 연령이 높을수록 체중 감량 시도 횟수 가 낮았으며 유지기간도 길었다. 즉, 잘못된 체중 감량 방법 에 의해 일시적으로 희망 체중에 도달하기는 하나 유지기간 이 짧아 결국 체중 감량 시도가 많아지는 것으로 사료된다.
최대 체중 감량 체중은 남성의 경우, 10대가 5.9 kg으로 가장 많았으며 60대가 3.6 kg으로 가장 적었고(Table 2), 연 령이 증가함에 따라 최대 감량 체중은 유의적으로 감소하였 다(p<0.05). 여성은 50대의 최대 체중 감량이 5.8 kg으로 가 장 많았으며 10대가 3.8 kg으로 가장 적었다. 성별에 따른 최대 체중 감량 체중은 남성 5.0 kg으로 여성 4.7 kg보다 높았다.
체중 감량 방법에 대한 만족도와 요요현상 경험여부 남성의 여러 가지 체중 감량 방법에 대한 평균 만족도는 전 연령대에서 3.5점 이상이었으나 연령에 다른 유의적인 차이를 보이지 않았다(Fig. 5). 여성의 만족도는 60대 3.7점 을 제외한 모든 연령에 낮은 점수를 보였으며 연령에 따른 유의적인 차이를 보였다(p<0.05). 체중 감량 방법에 대해서 여성은 남성에 비해 대체로 낮은 만족도를 보였다.
요요현상의 경험 여부에 대해서 조사한 결과(Fig. 6), 남성 46.1%에 비해 여성 65.3%로 요요현상이 유의적으로 많았다 (p<0.05). 남성의 경우 20대 58.3%를 제외하고 전 연령대에 서 48.3% 이하로 여성에 비해 적었고, 특히 60대는 33.3%로 가장 적은 요요현상을 경험하였다고 응답하였다. 여성은 51.7% 이상이 요요현상을 경험했다고 응답하였고, 40대 75.0%로 10대와 60대 51.7%와 비교하여 연령에 따른 차이가 보였다(p<0.05). 기존의 연구(30)에서 요요현상을 남성 18%, 여성 29%에서 경험하였다고 보고하여 남성에 비하여 여성이 요요현상 경험 경향이 높은 결과는 본 연구와 유사하
3.7
3.5 3.7
3.5 3.5
3.7
3.2 3.4
3.2 3.3
3.3 3.7
3 3.2 3.4 3.6 3.8
10~19 20~29 30~39 40~49 50~59 60~69
Th e a v era ge sa ti sf act io n rat e s .
Male Female
Fig. 5. The average satisfaction rates to the body weight loss methods according to age and gender. Significant differ- ences for each group measured by one-way ANOVA; All be- tween-age comparisons within female were statistically sig- nificant different (p<0.05). The differences of gender were not statistically significant.
55 45
41.7 58.3
51.7 48.3
51.7 48.3
56.7 43.3
66.7 33.3
0 20 40 60 80 100
Ex per ie n c e o f y o -y o di et in g ( % )
.10~19 20~29 30~39 40~49 50~59 60~69
Yes No A
48.3 51.7
31.7 68.3
26.7 73.3
25 75
28.3 71.7
48.3 51.7
0 20 40 60 80 100
Ex pe ri en c e of y o -y o di e ti n g ( % ) .
10~19 20~29 30~39 40~49 50~59 60~69
Yes No B
Fig. 6. Experience of yo-yo dieting according to age and gender (A: male, B: female). Significant differences between groups measured by the Chi-square test; All between-age com- parisons within each gender (both male and female) were not statistically significant but the differences of gender were stat- istically significant (p<0.05).
였다. 그러나 요요현상을 경험한 대상자의 비율은 본 연구의 결과가 훨씬 높은 결과를 보였는데 이는 요요현상에 대한 정의의 차이에 의한 결과라고 보인다.
10~70대를 대상으로 체중 변화와 요요현상에 미치는 영 향에 대한 코호트 연구결과(31), 남성과 여성 모두에게서 의 도적인 체중 감량을 했을 경우 2년간의 추적 조사 후 큰 체중 증가를 보였다고 보고하여 잘못된 일시적인 체중 감량이 오 히려 체중을 증가시키는 것으로 사료된다.
남녀 모두 60대에서 체중 감량 방법에 대한 만족도가 높으 면서도 요요현상의 경험 여부가 적었으며 남성이 여성에 비 하여 그러한 경향이 강하였다. 잘못된 체중 감량 방법으로 일시적인 체중이 감량되지만, 요요현상 등의 부작용을 겪으 면서 체중 감량 방법에 대한 만족도가 감소되는 것으로 사료 된다.
요 약
본 연구는 현재 체중에 대한 인식과 체중 감량 실태를 남 녀 각각의 연령에 따른 차이와 성별에 따른 차이를 조사하고 자 하였다. 체중 감량 경험이 있는 10~60대의 남녀 각각 60명씩 전체 720명의 대상자들에게 일반사항, 체격, 현재 체 중에 대한 인식과 만족 정도와 체중 감량 경험 및 결과를
전화 설문을 통해 조사 분석하였다. 본 연구에서 현재 체중 인식과 만족도는 큰 차이를 보여 본인의 체중이 정상이거나 마른 체중이라고 인식함에도 불구하고 전 연령대에서 체중 감량을 원하고 있음을 알 수 있었다. 체중 감량 실태 조사 결과, 연령이 높을수록 체중 감량 시도 횟수가 낮으나 체중 감량 후 유지기간이 길었고 남성이 여성에 비하여 이러한 경향이 강하였다. 또한 연령이 높을수록 여러 가지 체중 감 량 방법에 대한 만족도가 높고 요요현상을 적게 경험하였고 이러한 경향은 남성에게 강하게 나타났다. 결론적으로, 잘못 된 체중 감량 방법에 의해서 희망 체중에 도달하나, 유지기 간이 짧고 여러 가지 요요현상을 경험하면서 체중 감량 방법 에 대한 만족도도 낮아져 결국 빈번한 체중 감량을 시도하는 악순환을 경험하게 되는 것으로 사료되어진다. 따라서 성별 과 연령에 따른 인식과 체중 감량 실태의 차이를 고려하여 개인별 맞춤형 체중 감량을 위한 영양 교육이 필요할 것이라 고 사료된다.
감사의 글
본 연구는 한국보건사회연구원의 건강증진사업지원단의 지원으로 수행되었습니다.
문 헌
1.
http://www.who.int/mediacentre/factsheets/fs311/en/
2. Ministry of Health and Welfare. 2006. Report on 2005 National health and nutrition survey.
3. Hughes MC, Girolami TM, Cheadle AD, Harris JR, Patrick DL. 2007. A lifestyle-based weight management program delivered to employees: examination of health and economic outcomes. J Occup Environ Med 49: 1212-1217.
4. Okura T, Nakata Y, Ohkawara K, Numao S, Katayama Y, Matsuo T, Tanaka K. 2007. Effects of aerobic exercise on metabolic syndrome improvement in response to weight reduction. Obesity (Silver Spring) 15: 2478-2484.
5. Gold BC, Burke S, Pintauro S, Buzzell P, Harvey-Berino J. 2007. Weight loss on the web: A pilot study comparing a structured behavioral intervention to a commercial program. Obesity (Silver Spring) 15: 155-164.
6. Hwang MH, Kim K, Lee GC. 2006. The effect of circuit weight training on the body composition of obese col- lege-age women. Korean J Sports Science 15: 549-557.
7. Kim MK, Lee GC. 2006. Weight reduction dieting survey and satisfaction degree and diet related knowledge among adult women by age. J Korean Soc Food Sci Nutr 35:
572-582.
8. Das SK, Gilhooly CH, Golden JK, Pittas AG, Fuss PJ, Cheatham RA, Tyler S, Tsay M, McCrory MA, Lichtenstein AH, Dallal GE, Dutta C, Bhapkar MV, Delany JP, Saltzman E, Roberts SB. 2007. Long-term effects of 2 energy-restricted diets differing in glycemic load on dietary adherence, body composition, and metabolism in CALERIE:
a 1-y randomized controlled trial. Am J Clin Nutr 85:
1023-1030.
9. Klem MT, Wing RR, Lang W, McGuire MT, Hill JO. 2000.
Does weight loss maintenance become easier over time?
Obes Res 8: 438-444.
10. Hamm P, Shekelle RB, Stamler RJ. 1989. Large fluctuations in body weight during young adulthood and the 25 year rik of coronary disease in men. Am J Epodemiol 129:
312-318.
11. Saarni SE, Rissanen A, Sarna S, Koskenvuo M, Kaprio J.
2006. Weight cycling of athletes and subsequent weight gain in middleage. Int J Obes (Lond) 30: 1639-1644.
12. Lee IM, Paffenbarger RS Jr. 1992. Change in body weight and longevity. JAMA 268: 254-259.
13. James DC. 2003. Gender differences in body mass index and weight loss strategies among African Americans. J Am
Diet Assoc 103: 1360-1362.
14. Cho KO, Jeong SY. 2007. The effects of regular dietary habits on obesity indices and nutrition intakes in adult males. J Korean Diatetic Assoc 13: 114-122.
15. Lee HO, Lee YS. 2005. The study of relationship among body composition, athletic ability and nutritional status of young women. Korean J Food & Nutr 18: 127-134.
16. The Korean Nutrition Society. 2005. Dietary reference in- takes for Koreans.
17. Lee LH, Yu CH, Lee SS. 2004. A survey of food and nutrient intakes of Korean men by age group. Korean J Nutr 37:
143-152.
18. Lee EJ, Kim MH, Kim WH, Cho MS. 2003. A survey on weight control and eating behavior in reproductive women by BMI. Kor J Food Culture 18: 172-180.
19. Bish CL, Blanck HM, Maynard LM, Serdula MK, Thomp- son NJ, Khan LK. 1999. Prevalence of attempting weight loss and strategies for controlling weight. JAMA 282:
1353-1358.
20. Kottke TE, Clark MM, Aase LA, Brandel CL, Brekke MJ, Brekke LN, DeBoer SW, Hayes SN, Hoffman RS, Menzel PA, Thomas RJ. 2002. Self-reported weight, weight goals, and weight control strategies of a midwestern population.
Mayo Clin Proc 77: 114-121.
21. Doo MA, Kim YH. 2007. Recognition of body weight loss according to age and gender. Korean J Nutr 40: 658-666.
22. Kim OS, Kim SW, Kim AJ. 2002. BMI, weight control be- havior, and self-esteem in high school adolescents. J
Korean Acad Adult Nurs 14: 53-61.
23. Kim CS, Jeong TH, Kim MC, Park JW. 2004. Factors asso- ciated with distorted self-perception of body weight in Korean adult. J Korean Acad Fam Med 25: 462-468.
24. Miller EC, Schulz MR, Bibeau DL, Galka AM, Spann LI, Martin LB, Aronson RE, Chase CM. 2008. Factors asso- ciated with misperception of weight in the stroke belt. J
Gen Intern Med 23: 323-328.
25. Demarest J, Allen R. 2000. Body image: gender, ethnic, and age differences. J Soc Psychol 140: 465-472.
26. Cachelin FM, Rebeck RM, Chung GH, Pelayo E. 2002. Does ethnicity influence body-size preference? A comparison of body image and body size. Obes Res 10: 158-166.
27. Krain SS, Waldron J, Michalenok J. 2001. Relationships among body satisfaction, social physique anxiety, and eat- ing behaviors in female athletes and exercisers. J Sports
Behav 24: 247-260.
28. Williamson DF, Serdula MK, Anda RF, Levy A, Byers T.
1992. Weight loss attempts in adults: goals, duration, and rate of weight loss. Am J Public Health 82: 1251-1257.
29. Green KL, Cameron R, Polivy J, Cooper K, Liu L, Leiter L, Heatherton T. 1997. Weight dissatisfaction and weight loss attempts among Canadian adults. Canadian Heart Health Surveys Research Group. CMAJ 157: S17-25.
30. Lahti-Koski M, Männistö S, Pietinen P, Vartiainen E. 2005.
Prevalence of weight cycling and its relation to health in- dicators in Finland. Obes Res 13: 333-341.
31. Kroke A, Liese AD, Schulz M, Bergmann MM, Klipstein- Grobusch K, Hoffmann K, Boeing H. 2002. Recent weight changes and weight cycling as predictors of subsequent two year weight change in a middle-aged cohort. Int J
Obes Relat Metab Disord 26: 403-409.
(2008년 2월 5일 접수; 2008년 4월 3일 채택)