I. Introduction
Histology, the study of tissue structure under a microscope, has always been the principal approach to the structural analysis of living organisms at the cellular level. Understand- ing tissue microanatomy is essential to train medical, dental, and other health professional students to recognize cellular structures, comprehend the structure-function relationship of cells and tissues, and follow disease pathogenesis. How- ever, this branch of science has been described as one of the least engaging topics by health professional students [1]. The traditional method of teaching histology relies on light mi- croscopes, which does not allow simultaneous observation by multiple people, prevents interactive in-class discussions, and thus fails to motivate students [2].
At the School of Dentistry at the University of Alberta,
Histoscope: A Web-Based Microscopy Tool for Oral Histology Education
Nazlee Sharmin, Ava K. Chow, Alice S. Dong, Nadine C. Milos
School of Dentistry, Faculty of Medicine and Dentistry, University of Alberta, Edmonton, Canada
Objectives: Histology, the study of tissue structure under a microscope, is one of the most essential yet least engaging topics for health professional students. Understanding tissue microanatomy is crucial for students to be able to recognize cellular structures and follow disease pathogenesis. Traditional histology teaching labs rely on light microscopes and a limited array of slides, which inhibits simultaneous observation by multiple learners, and prevents in-class discussions. We have developed an interactive web-based microscopy tool called “Histoscope” for oral histology in this context. Methods: Good quality mi- croscope slides were selected for digital scanning. The slides were scanned with multiple layers of z-stacking, a method of taking multiple images at different focal distances. The digital images were checked for quality and were archived on Histo- scope. The slides were annotated, and self-assessment questions were prepared for the website. Interactive components were programmed on the website to mimic the experience of using a real light microscope. Results: This web-based tool allows users to interact with histology slides, replicating the experience of observing and manipulating a slide under a real micro- scope. Through this website, learners can access a broad array of digital oral histology slides and self-assessment questions.
Conclusions: Incorporation of Histoscope in a course can shift traditional teacher-centered histology learning to a collabora- tive and student-centered learning environment. This platform can also provide students the flexibility to study histology at their own pace.
Keywords: Histology, Education, Web-Based Microscope, Self-Assessment, Dental Education
Healthc Inform Res. 2021 April;27(2):146-152.
https://doi.org/10.4258/hir.2021.27.2.146 pISSN 2093-3681 • eISSN 2093-369X
Submitted: December 22, 2020 Revised: February 10, 2021 Accepted: March 2, 2021 Corresponding Author Nazlee Sharmin
School of Dentistry, Faculty of Medicine and Dentistry, University of Alberta, 5-533, Edmonton Clinic Health Academy (ECHA), 11405 87 Avenue NW, Edmonton, AB T6G 1C9, Canada. Tel: +1-780-492- 6428, E-mail: [email protected] (https://orcid.org/0000-0002- 2408-2333)
This is an Open Access article distributed under the terms of the Creative Com- mons Attribution Non-Commercial License (http://creativecommons.org/licenses/by- nc/4.0/) which permits unrestricted non-commercial use, distribution, and reproduc- tion in any medium, provided the original work is properly cited.
ⓒ 2021 The Korean Society of Medical Informatics
students extensively study oral histology to learn about teeth and surrounding oral structures, their development, and developmental anomalies. Besides regular didactic lectures, students attend histology lab sessions in which they share a limited number of light microscopes and glass slides to view tooth and oral structures. The microscopic slides used for teaching are decades old, with some being extremely rare and irreplaceable.
A growing number of universities and medical schools worldwide are embracing digital slides as an alternative to traditional light microscopes [3,4]. The incorporation of virtual microscopy in histology and pathology courses has improved in-class teaching environments [3,5] and student performance [6]. The number of websites archiving digital histology slides is also growing internationally. For example,
“The SecondLook” is a collection of histology slides devel- oped by the University of Michigan [7]. “Oral Histology”
created by the University of Kentucky College of Medicine contains a collection of annotated but low-resolution images of oral histology slides [8]. However, the existing web-based histology databases lack sufficient, high-quality resources from the oral cavity, which are critical for dentistry students.
Most of the publicly available histology databases provide ei- ther annotated or non-annotated images without the ability to switch from one to the other, which does not allow learn- ers to perform active memory recall after learning. Other drawbacks of the existing virtual microscopy websites are the quality of graphical resolution [9] and lack of z‐axis in- formation, which is essential for reconstructing the three‐di- mensional visualization of cellular structure [10]. Moreover, in most online sources, users cannot manipulate images to observe structural details. The few websites that provide the ability to zoom in and out permit users to expand a picture
only at a predefined location. The inability to magnify any region of interest limits learners’ freedom to explore the histological section and restricts their curiosity, reducing the student-centeredness of their learning. Furthermore, the COVID-19 pandemic has moved most university teaching online, necessitating an alternative way to teach histology virtually yet in an interactive and engaging manner.
In this context, we have developed a web-based interactive microscopy tool called “Histoscope.” We have scanned our existing oral histological slides in high resolution and ar- chived them on our website. The site allows users to interact with the digital slides and self-assess their knowledge of oral histology.
II. Methods
1. Slide Digitalization and Organization
The School of Dentistry has a collection of oral histology glass slides to teach histology labs with light microscopes.
We curated those slides for quality and rarity and selected the best slides for whole-slide scanning using an Aperio Dig- ital Slide Scanner (Leica Biosystems, Wetzlar, Germany). We chose the slides to represent the oral mucosa, oral structures, tooth, tooth development, and facial structure development.
The slides were scanned with 25 layers of z-stacking, an im- age-processing method of taking multiple images at different focal distances and combining them to make a composite image. This technique, also known as focus stacking, is use- ful for capturing in-focus images of objects under high mag- nification as the depth of field decreases with magnification [11].
The histology glass slides were scanned under 20× or 40×
magnification depending on the specimen’s size and the
A B
C D
2 mm
Label the section of temporomandibular joint* 3 points
Lateral pterygoid muscle Mandibular
fossa Intra-articular disc Condyle of
mandible A
B
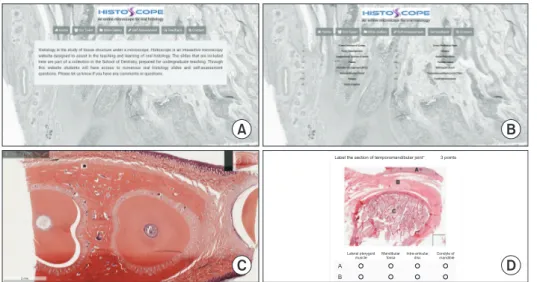
Figure 1. Snapshots from the Histo- scope website. (A, B) The contents of the website are organized under six tabs. (B) Digital slides are arranged in 15 groups under the “Slide Gallery” tab. (C) Snapshot of a slide showing the cross- section of a dental root. (D) Sample question from the Self-Assessment section of the website (D).
structural details required for teaching oral histology. The slides scanned under 40× magnification has a resolution of 0.247 microns per pixel (MPP); the resolution was 0.497
MPP for the slides scanned under 20× magnification. The image bit depth was 8 bits for all the digital slides.
Digital scans of the slides were further checked for quality
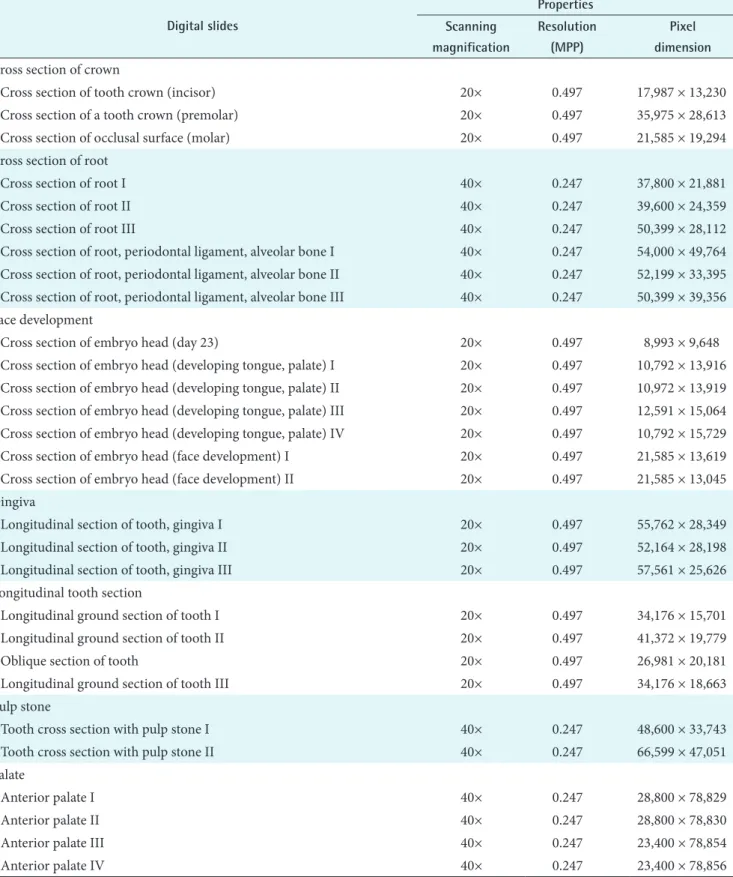
Table 1. List of digital slides included in the “Slide Gallery” of Histoscope Digital slides
Properties Scanning
magnification
Resolution (MPP)
Pixel dimension Cross section of crown
Cross section of tooth crown (incisor) 20× 0.497 17,987 × 13,230
Cross section of a tooth crown (premolar) 20× 0.497 35,975 × 28,613
Cross section of occlusal surface (molar) 20× 0.497 21,585 × 19,294
Cross section of root
Cross section of root I 40× 0.247 37,800 × 21,881
Cross section of root II 40× 0.247 39,600 × 24,359
Cross section of root III 40× 0.247 50,399 × 28,112
Cross section of root, periodontal ligament, alveolar bone I 40× 0.247 54,000 × 49,764 Cross section of root, periodontal ligament, alveolar bone II 40× 0.247 52,199 × 33,395 Cross section of root, periodontal ligament, alveolar bone III 40× 0.247 50,399 × 39,356 Face development
Cross section of embryo head (day 23) 20× 0.497 8,993 × 9,648
Cross section of embryo head (developing tongue, palate) I 20× 0.497 10,792 × 13,916 Cross section of embryo head (developing tongue, palate) II 20× 0.497 10,972 × 13,919 Cross section of embryo head (developing tongue, palate) III 20× 0.497 12,591 × 15,064 Cross section of embryo head (developing tongue, palate) IV 20× 0.497 10,792 × 15,729
Cross section of embryo head (face development) I 20× 0.497 21,585 × 13,619
Cross section of embryo head (face development) II 20× 0.497 21,585 × 13,045
Gingiva
Longitudinal section of tooth, gingiva I 20× 0.497 55,762 × 28,349
Longitudinal section of tooth, gingiva II 20× 0.497 52,164 × 28,198
Longitudinal section of tooth, gingiva III 20× 0.497 57,561 × 25,626
Longitudinal tooth section
Longitudinal ground section of tooth I 20× 0.497 34,176 × 15,701
Longitudinal ground section of tooth II 20× 0.497 41,372 × 19,779
Oblique section of tooth 20× 0.497 26,981 × 20,181
Longitudinal ground section of tooth III 20× 0.497 34,176 × 18,663
Pulp stone
Tooth cross section with pulp stone I 40× 0.247 48,600 × 33,743
Tooth cross section with pulp stone II 40× 0.247 66,599 × 47,051
Palate
Anterior palate I 40× 0.247 28,800 × 78,829
Anterior palate II 40× 0.247 28,800 × 78,830
Anterior palate III 40× 0.247 23,400 × 78,854
Anterior palate IV 40× 0.247 23,400 × 78,856
and resolution, organized in groups, annotated, and archived on the Histoscope website under the Slide Gallery tab (Figure 1). Currently, the website contains 76 digital slides represent- ing teeth and surrounding oral structures.
2. Self-Assessment Question Preparation
We prepared a series of questions (Figure 1D) which were
incorporated into the website under the Self-Assessment tab.
The questions are grouped to correspond to the Slide Gallery organization, so students can choose to test their knowledge of a specific area of the oral cavity. Currently, we have 35 image-labeling and structure-identification questions on our website, which are randomized each time a user takes the test.
Table 1. Continued 1
Digital slides
Properties Scanning
magnification
Resolution (MPP)
Pixel dimension Parotid gland
Cross section of parotid gland I 20× 0.497 34,176 × 17,838
Cross section of parotid gland II 40× 0.247 72,000 × 35,946
Cross section of parotid gland III 40× 0.247 75,600 × 29,470
Cross section of parotid gland IV 40× 0.247 63,000 × 27,881
Cross section of parotid gland V 40× 0.247 54,000 × 37,850
Periodontal ligament
Cross section of root, periodontal ligament, alveolar bone I 40× 0.247 54,000 × 49,764 Cross section of root, periodontal ligament, alveolar bone II 40× 0.247 52,199 × 33,395 Cross section of root, periodontal ligament, alveolar bone III 40× 0.247 50,399 × 39,356 Sublingual gland
Cross section of sublingual gland I 40× 0.247 59,399 × 50,399
Cross section of sublingual gland II 40× 0.247 52,199 × 50,928
Cross section of sublingual gland III 40× 0.247 52,199 × 51,262
Submandibular gland
Cross section of submandibular gland I 40× 0.247 46,800 × 40,366
Cross section of submandibular gland II 40× 0.247 50,399 × 52,758
Cross section of submandibular gland III 40× 0.247 55,800 × 46,282
Temporomandibular joint (TMJ)
Cross section of adult TMJ I 20× 0.497 39,573 × 38,056
Cross section of adult TMJ II 20× 0.497 41,372 × 40,021
Cross section of adult TMJ III 20× 0.497 46,768 × 37,196
Cross section of adult TMJ IV 20× 0.497 44,969 × 39,758
Tongue
Cross section of tongue I 20× 0.497 23,384 × 28,673
Cross section of tongue II 20× 0.497 23,384 × 29,572
Cross section of tongue III 20× 0.497 26,981 × 25,530
Cross section of tongue IV 20× 0.497 25,183 × 21,910
Cross section of tongue V 20× 0.497 23,384 × 28,255
Cross section of tongue VI 40× 0.247 48,600 × 57,230
Cross section of tongue VII 20× 0.497 35,975 × 18,656
Cross section of tongue VIII 20× 0.497 34,167 × 16,192
Cross section of tongue IX 20× 0.497 34,167 × 22,859
3. Design and Layout of the Website
We aimed for a simple, responsive design with a minimum number of tabs and minimal text for easy navigation. For structural consistency, the title “Histoscope” and the back- ground frame are kept visible on all pages (Figure 1A, 1B).
The colors of the headings, tabs, and background were cho- sen for aesthetic harmony. The contents of the website are organized under six tabs. Digital slides are arranged in fif- teen groups under the Slide Gallery tab (Figure 1A, 1B, Table 1). The Self-Assessment tab guides users to a series of ques- tions to test their oral histology knowledge. The website also has an option for users to contact the authors and provide feedback for further improvement (Figure 1A).
4. Incorporation of Interactive Components
We designed Histoscope as an interactive microscopy tool.
This interface’s primary goal is to mimic the experience of viewing slides through a real light microscope with the abil-
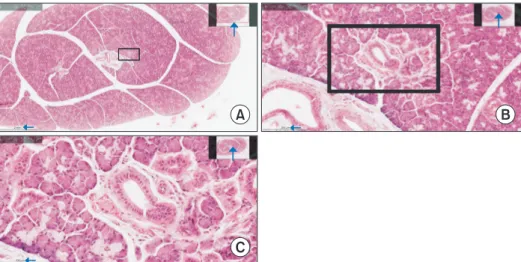
ity to manipulate and view various areas of the histologi- cal section, which is rare in the existing online histology databases. Our website was programmed with the Python programming language and uses Flask as a web framework, resulting in a dynamic platform capable of processing user requests and interacting with them accordingly. Users can load a digital slide of their choice in high resolution, rotate the slides as needed, toggle to full screen, and change the magnification in any mouse-pointed location. The digital slides on our website were scanned using the z-stacking technique to provide continuous z-axis information. Z- stacking allows for a greater depth of field and a unique abil- ity to magnify a digital image at any given area and maintain a perfectly focused, high-resolution field-of-view (Figure 2).
The slide viewer of the website provides an inset telescope box on the upper-right corner of the screen. When zoom- ing in on fields of view, the inset shows a box outlined in red, delineating the exact position of the area being viewed Table 1. Continued 2
Digital slides
Properties Scanning
magnification
Resolution (MPP)
Pixel dimension Tooth development
Developing tooth germ I 20× 0.497 19,786 × 28,606
Developing tooth germ II 20× 0.497 21,585 × 30,655
Bell stage of tooth development I 20× 0.497 21,585 × 42,668
Bell stage of tooth development II 20× 0.497 43,170 × 24,872
Bell stage of tooth development III 20× 0.497 23,384 × 39,290
Bell stage of tooth development IV 20× 0.497 26,981 × 44,779
Bell stage of tooth development V 20× 0.497 23,384 × 41,182
Bell stage of tooth development VI 20× 0.497 19,786 × 29,511
Tooth eruption
Cross section of erupting tooth I 20× 0.497 26,981 × 27,831
Cross section of erupting tooth II 20× 0.497 30,579 × 26,829
Cross section of erupting tooth III 20× 0.497 30,579 × 24,025
Cross section of erupting tooth IV 20× 0.497 30,579 × 26,253
Cross section of erupting tooth V 20× 0.497 41,372 × 27,757
Cross section of erupting tooth VI 20× 0.497 41,372 × 27,758
Cross section of erupting tooth VII 20× 0.497 39,573 × 29,828
Cross section of erupting tooth VIII 20× 0.497 39,573 × 29,826
Cross section of erupting tooth IX 20× 0.497 37,774 × 21,687
Cross section of erupting tooth X 20× 0.497 35,975 × 22,846
Cross section of erupting tooth XI 20× 0.497 39,573 × 34,683
Cross section of erupting tooth XII 20× 0.497 41,372 × 32,695
on-screen with respect to the entire viewable field (Figure 2). After magnification, the user can navigate the magni- fied slide by grabbing the slide with a hand tool or by simply moving the red box in the inset (Figure 3). The slides are an- notated by content experts to identify major structural com- ponents within a tissue section. Users can either “show” or
“hide” the annotations, which allows them to self-test their learning (Figures 1C, 3).
III. Results
The completed website includes 76 high-quality and rare sections of the tooth, oral structures, and development of tooth and facial regions, which are not readily available in any public online databases. A complete list of all the digital slides incorporated into our slide gallery is shown in Table 1.
The digital images were scanned using a focus stacking tech- nology to mimic the experience of focusing through a real light microscope (Figure 2). We have included an option to show or hide annotations to enable users to perform active memory recall (Figure 3). Self-assessment questions on our website allow learners to self-test their knowledge on oral histology (Figure 1).
IV. Discussion
Computer-based technologies to teach histology have in-
creased over the years [3,12,13]. Virtual microscopy has improved learners’ performance in many training programs [3,5,14]. Some known limitations of this technology are low graphics resolution and lack of z-axis information [9,10].
With Histoscope, we aimed to overcome the shortcomings of previous virtual histology databases and to create an interac- tive and dynamic platform to mimic the experience of using an actual light microscope. The incorporation of our web- based microscope will stimulate active learning and student
A B
C
100 m 100 m
200 m 200 m 2 mm
2 mm
Figure 2. Application of z-stacking to provide in-focus images in high magnification. The slide collection of Histoscope was scanned using the z-stacking technique to allow the ability to magnify the digital slides and still get an entirely focused, high-reso- lution field-of-view. (A–C) A tissue section of a salivary gland, gradually magnified from low (A) to higher (B, C) magnifica- tion. The red box in the inset of each slide indicates the viewing area (arrow) and the scale bar at the bottom left shows the degree of magnification of the slide (arrow). The black box in the middle indicates the area that was being magnified. As the slides are viewed under higher magnification, the scale bar changes (from 2 mm to 100 μm), and the red box in the in- set becomes smaller. Z-stacking enables the user to observe structural details under a higher magnification, mimicking the experience of using a light microscope.
500 m 500 m
Inset box Inset box Control bar
Control bar
Options to show and hide
annotations Options to show and hide
annotations
Show labels Hide labels
Figure 3. Snapshot from the slide viewer of Histoscope. The user can activate the inset box on the upper-right corner of the slide viewer simply by the mouse pointer’s mo- tion. While zooming in, the inset shows a box outlined in red, delineating the exact position of the area being viewed on-screen with respect to the entire viewable field. The control bar in the upper-left corner allows the user the zoom in, zoom out, rotate, and toggle to full-screen mood. “Show Labels” and “Hide Labels” al- low users to show or hide the slide annotations.
engagement. Educational theories suggest that adults learn proficiently when they are fully engaged in learning [15].
Active engagement also helps develop critical thinking skills in adults [16]. The use of web-based microscopy in conjunc- tion with an actual light microscope is supported by Mayer’s cognitive theory of multimedia learning, which states that using two or more of each of the modalities of delivery, pre- sentation, and sensory systems will support effective learn- ing [17]. We believe that Histoscope will complement tradi- tional teaching with the light microscope and allow students to study histology at their own pace.
Conflict of Interest
No potential conflict of interest relevant to this article was reported.
Acknowledgments
The authors sincerely thank Rehabilitation Robotics Lab, University of Alberta for developing our website, Histoscope.
ORCID
Nazlee Sharmin (https://orcid.org/0000-0002-2408-2333) Ava K. Chow (https://orcid.org/0000-0002-1972-0310) Alice S. Dong (https://orcid.org/0000-0002-2620-033X) Nadine C. Milos (https://orcid.org/0000-0001-5006-3411)
References
1. Garcia M, Victory N, Navarro-Sempere A, Segovia Y.
Students’ views on difficulties in learning histology.
Anat Sci Educ 2019;12(5):541-9.
2. Capela e Silva F, Rato LM, Lopes OS. Learning and teaching histology: traditional and computational meth- ods. Proceedings of International Conference “Learning and Teaching in Higher Education”; 2010 Apr 15-16;
Evora, Portugal.
3. Blake CA, Lavoie HA, Millette CF. Teaching medical histology at the University of South Carolina School of Medicine: transition to virtual slides and virtual micro- scopes. Anat Rec B New Anat 2003;275(1):196-206.
4. Pantanowitz L, Szymas J, Yagi Y, Wilbur D. Whole slide imaging for educational purposes. J Pathol Inform 2012;
3:46.
5. Kumar RK, Velan GM, Korell SO, Kandara M, Dee FR, Wakefield D. Virtual microscopy for learning and as- sessment in pathology. J Pathol 2004;204(5):613-8.
6. Helle L, Nivala M, Kronqvist P. More technology, better learning resources, better learning? Lessons from adopt- ing virtual microscopy in undergraduate medical educa- tion. Anat Sci Educ 2013;6(2):73-80.
7. Hortsch M. The SecondLook [Internet]. Ann Arbor (MI): University of Michigan; c2019 [cited at 2021 Apr 5]. Available from: https://secondlook.med.umich.edu/
histology.
8. MacPherson BR, Tieman JG. Oral histology: a digital laboratory and atlas [Internet]. Lexington (KY): Uni- versity of Kentucky; n.d. [cited at 2021 Apr 5]. Available from: http://www.uky.edu/~brmacp/oralhist/index.htm.
9. Rinaldi VD, Lorr NA, Williams K. Evaluating a technol- ogy supported interactive response system during the laboratory section of a histology course. Anat Sci Educ 2017;10(4):328-38.
10. Van Es SL, Pryor WM, Belinson Z, Salisbury EL, Velan GM. Cytopathology whole slide images and virtual microscopy adaptive tutorials: a software pilot. J Pathol Inform 2015;6:54.
11. Ray SF. Applied photographic optics: lenses and optical systems for photography, film, video, electronic imaging and digital imaging. 3rd ed. Oxford, UK: Focal Press;
2002.
12. Bloodgood RA, Ogilvie RW. Trends in histology labora- tory teaching in United States medical schools. Anat Rec B New Anat 2006;289(5):169-75.
13. Cotter JR. Laboratory instruction in histology at the University at Buffalo: recent replacement of microscope exercises with computer applications. Anat Rec 2001;
265(5):212-21.
14. McBride JM, Drake RL. National survey on anatomi- cal sciences in medical education. Anat Sci Educ 2018;
11(1):7-14.
15. Vella J. On teaching and learning: putting the principles and practices of dialogue education into action. San Francisco (CA): Jossey-Bass; 2008.
16. Karge BD, Phillips KM, Jessee T, McCabe M. Effective strategies for engaging adult learners. J Coll Teach Learn 2011;8(12):53-6.
17. Mayer RE. Multimedia learning. 2nd ed. Cambridge, UK: Cambridge University Press; 2009.