Assessment of Right Ventricular Function by Tissue Doppler Imaging in Pulmonary Arterial Hypertensive Rat
Jae Eun Hong, Kwan Chang Kim
1, Young Mi Hong
Departments of Pediatrics and 1Thorax and Cardiovascular Surgery, Ewha Womans University College of Medicine, Seoul, Korea
Objectives: Elevated pulmonary pressure and right ventricular (RV) dysfunction are the hallmarks of pulmonary vascular disease in animal models and human patients with pulmonary arterial hypertension (PAH). Monocrotaline models of PAH are widely used to study the pathophysiology of PAH. The purpose of this study was to evaluate the severity of PAH rat model by tissue Doppler imaging (TDI).
Methods: PAH was induced in Sprague-Dawley rats by monocrotaline (M) group. The peak systolic (s’), early diastolic (e’), and late diastolic myocardial velocities (a’) were measured using TDI at basal segments. Tricuspid annular plane systolic excursion (TAPSE) was measured in the 4-chamber view. Velocity of a tricuspid regurgitation (TR) jet was measured to estimate the pulmonary artery pressure to assess the severity of PAH.
Results: Decrease in the RV shortening fraction and ejection fraction were observed in the M group compared with the control (C) group. RV e’ velocity and s’ velocity were significantly lower in the M group compared with the C group. The TAPSE was signifi- cantly lower in the M group compared with the C group (1.26±0.22 mm vs. 2.83±0.34 mm). The TR velocity was significantly higher in the M group compared with the C group (4.48±0.34 m/sec vs. 1.23±0.02 m/sec).
Conclusion: TAPSE is an easily obtainable, widely recognized and clinically useful echocardiographic parameter of global RV function in the PAH rat model. We recom- mend that TDI would be a helpful diagnostic tool to evaluate the RV function in PAH rat model. (Ewha Med J 2019;42(3):39-45)
Received December 10, 2018 Revised July 3, 2019 Accepted July 4, 2019 Corresponding author Young Mi Hong
Department of Pediatrics, Ewha Womans University College of Medicine, 1071 Anyangcheon-ro, Yangcheon-gu, Seoul 07985, Korea
Tel: 82-2-2650-2841, Fax: 82-2-2653-3718 E-mail: ymhong@ewha.ac.kr
Key Words
Hypertension, pulmonary; Monocrotaline;
Echocardiography; Right ventricular dysfunction
This is an Open Access article distributed under the terms of the Creative Commons Attribution Non-Commercial License (http://creativecommons.org/licenses/by-nc/4.0) which permits unrestricted non-commercial use, distribution, and reproduction in any medium, provided the original work is properly cited.
Introduction
Pulmonary vascular remodeling and the right ventricle (RV) dysfunction both are important in the pathophysiology of pul- monary arterial hypertension (PAH) [1]. High pulmonary vas- cular resistance leads to RV overload, which triggers functional and morphological changes in the RV, which ultimately impairs the capacity of patients [2]. Recently, clinicians and researchers have been interested in the role of the RV in PAH patients. RV
dysfunction and elevated pulmonary pressure are the hallmarks of pulmonary vascular disease in human patients and animal models with PAH [2].
RV performance is one of the most important predictor of cardiovascular mortality and morbidity. Nevertheless, estimation of RV contractility by echocardiography is challenging due to its complex anatomy and physiology.
Difficulties in evaluating the RV with echocardiography arises from several causes. First, the RV has a complex geometry.
Second, visualization of the RV inflow-outflow tract is not easily obtained by echocardiograms. Third, it is difficult to ad- equately visualize all segments of the RV because the RV is lo- cated behind the sternum. Finally, there are no clear landmarks to standardize several views [3].
Echocardiography is one of the most important and conve- nient diagnostic tool for evaluating RV function and hemody- namics of pulmonary circulation [4,5]. Several echocardio- graphic parameters such as RV myocardial performance index (MPI) [2], RV fractional area changes (RVFAC), tricuspid annular plane systolic excursion (TAPSE) [6] and tricuspid an- nular systolic velocity (s’) [7-9] have been previously studied.
However, the potential of these parameters to assess RV func- tion and severity has not been well examined in patients with PAH [2].
In contrast to MPI, RVFAC, TAPSE, and s’ myocardial ve- locity, parameters of RV function such as RV ejection fraction (EF) and RVFAC have limited values because of suboptimal RV endocardial definition [9].
TAPSE is especially an excellent parameter to assess RV global function and predict poor prognosis [8]. It is also known to be both highly specific and easy to estimate RV function.
Despite recent interest in the RV function in PAH, stan- dardization of RV assessment remains in its initial stages [9].
Echocardiographic assessment provides essential diagnostic and therapeutic data to the clinician and yields many important in- formation regarding the response of the RV to elevated pulmo- nary pressures [10]. These echocardiographic parameters may also give important information about RV function for evaluation and prognostic stratification of patients with heart failure [8].
Monocrotaline (MCT) models of PAH are widely used to study the pathophysiology of PAH and to investigate potential therapies. Among several preclinical models of PAH, the MCT animal model offers an advantage of closely mimicking several key aspects of human PAH, including endothelial dysfunction, proliferation of smooth muscle cells, vascular remodeling, up- regulation of inflammatory cytokines and RV failure [11,12].
MCT induced PAH is severe with endothelial apoptosis, prominent medial hypertrophy and inflammatory adventitial re- modeling [13]. Noninvasive assessment of PAH severity without sacrificing an animal also allows researchers to serially investi- gate the therapeutic effects [14].
The purpose of this study was to assess the potential of tissue
Doppler imaging (TDI) in evaluating the severity of PAH in an MCT induced PAH rat model.
Methods
1. Animals
Six-week-old male Sprague-Dawley rats were kept in 12- hour light/12-hour dark cycle with climate-controlled condi- tions and were provided with full access to food and water.
The rats were separated into two groups: the control (C) group (n=12), which received single subcutaneous injection of saline;
and the monocrotaline (M) group (n=12), which received single subcutaneous injection of 60 mg/kg MCT (Sigma Chemicals, St. Louis, MO, USA) dissolved in 0.5 N hydrogen chloride solution, which induces PAH. We sacrificed the rats at week 4, and extracted tissues were immediately frozen at -70℃. All ex- perimental procedures were approved by the Institutional Animal Care and Use Committee of Ewha Womans University College of Medicine (Approval No. 13-0125).
2. Echocardiographic parameters
Echocardiographic studies were performed under sedation us- ing Vivid E96 (GE Healthcare, Milwaukee, WI, USA) at week 4. The rats were anesthetized with intraperitoneal administration of Zoletil (Virbac, Carros, France) and Rompun (Bayer Korea, Seoul, Korea). After the thorax was shaved and the rats were in dorsal decubitus position, sonographic images were obtained us- ing a 12 transducer probe with high temporal and spatial resolu- tion: complete 2-dimensional, M-mode (at papillary muscle levels), Doppler (pulse wave), and TDI echocardiograms. Dop- pler imaging at the mitral and aortic valves was obtained from the apical 3- and 4-chamber views. All acquired images were digitally stored for further analysis.
M-mode echocardiography was performed to assess following parameters: interventricular septal wall thickness, posterior wall thickness, and left ventricle (LV) end diastolic dimension at the chordae tendineae level. EF was estimated with biplane Simpson formula, and shortening fraction was calculated from LV internal dimensions.
Parameters of diastolic function were measured from pulsed Doppler mode from the apical window: early diastolic (E), late atrial (A) peak velocities, E/A ratios, and deceleration time.
Myocardial velocities were estimated at the basal septum from
the 4-chamber views by TDI: the peak systolic (s’), early dia- stolic (e’), and late diastolic longitudinal myocardial velocities (a’).
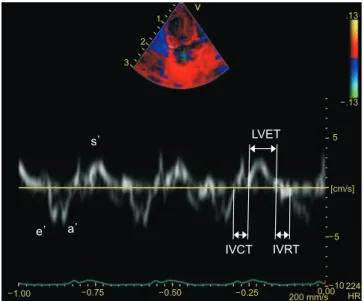
The isovolumetric contraction time (IVCT) was determined as the time that has passed between the end of the a’ wave to the onset of the next s’ wave, and the isovolumetric relaxation time (IVRT) was determined as the time that has passed be- tween the end of the s’ wave to the onset of the next e’ wave (Fig. 1). Ejection time (ET) was also measured. The Tei index was then calculated from the TDI using the following formula:
IVRT+IVCT/ET (Fig. 1).
Using an apical 4-chamber view to trace the right ventricular endocardial border to estimate end-diastolic and end-systolic RV area, RVFAC was calculated using the following formula:
(RV end-diastolic area–RV end-systolic area)/RV end-diastolic area x 100%. TAPSE was also determined from an apical 4-chamber view by using an M-mode cursor through the lat- eral tricuspid annulus. Tricuspid inflow was recorded from an apical 4-chamber view, and the peak early (E) and late (A)
diastolic velocities, their ratio (E/A), and the tricuspid E-wave deceleration time were measured. The ratio between E and e′
was calculated (E/e′).
The tricuspid regurgitation (TR) was measured from the ter- mination of TR to the onset of the subsequent TR tracing (Fig.
2). The highest TR velocity was measured in single view, and pulmonary arterial pressure was calculated with the following formula: 4V2+estimated right atrial pressure [15].
To measure pulmonary acceleration time, the time from the onset of flow to peak velocity, and RV ET, the time from the onset to the termination of pulmonary flow, PW doppler re- cording of the pulmonary blood flow was obtained by using parasternal short axis view at the pulmonic valve level.
All of the parameters were measured over three to five con- secutive cardiac cycles, and the mean was calculated. To avoid interobserver variability, the echocardiographic measurements were made by one investigator.
3. Statistical analyses
SPSS ver. 14.0 (SPSS Inc., Chicago, IL, USA) was used for all statistical analysis. Unpaired Student t-test was used to com- pare group data, and all data are presented as mean±standard deviation. The statistically significant cutoff for P-value was
<0.05.
Fig. 1. Tissue Doppler imaging at basal portion of right ventricle (RV) in pulmonary arterial hypertension (PAH) rat model. The isovolumetric contraction time (IVCT) was determined as the time that has passed between the end of the a’ wave to the onset of the next s’ wave, and the isovolumetric relaxation time (IVRT) was determined as the time that has passed between the end of the s’ wave to the onset of the next e’ wave. Ejection time (ET) was also measured. The Tei index was then calculated from the tissue Doppler imaging using the following formula: IVRT+IVCT/ET. s’, systolic myocardial velocity; e’, early dia- stolic myocardial velocity; a’, late diastolic myocardial velocity; LVET, left ventricle ejection time.
Fig. 2. Tricuspid regurgitation (TR) by echocardiography in pulmonary arterial hypertension rat model. The TR was measured from the ter- mination of TR to the onset of the subsequent TR tracing. TR velocity was significantly higher in the monocrotaline group group (4.48±0.34 m/sec ∆P 80.81±12.12 mmHg). Heart rate was 265/min.
Results
1. Left ventricular parameters
Stroke volume was significantly decreased in the M group compared to the C group (0.39±0.24 mL vs. 0.83±0.11 mL;
P=0.041).
LV shortening fraction (FS; 37.6%±7.0% vs. 47.1%±
3.9%) and EF (73.1%±8.9% vs. 83.1%±3.6%) were de- creased in the M group compared to the C group, but the dif- ference was not statistically significant.
LV e’ myocardial velocity was significantly lower in the M group compared to the C group (3.88±0.85 cm/sec vs. 6.96
±1.23 cm/sec, respectively; P=0.023). LV a’ myocardial velocity was not significantly different between two groups (3.21±1.79 cm/sec vs. 6.30±3.09 cm/sec, respectively;
P=0.208). LV s’ myocardial velocity was significantly lower in the M group compared to the C group (2.93±0.69 cm/sec vs.
4.89±0.43 cm/sec, respectively; P=0.014) (Table 1).
2. Right ventricular parameters
Right ventricular diastolic area was significantly increased in the in the M group compared to the C group (0.72±0.10 cm2 vs. 0.37±0.05 cm2, respectively; P=0.005). Right ventricular systolic area was significantly increased in the in the M group compared to the C group (0.50±0.15 cm2 vs. 0.25±0.03 cm2, respectively; P=0.044). FAC was not significantly differ- ent between the two groups.
RV e’ myocardial velocity was significantly lower in the M group compared to the C group (3.77±1.02 cm/sec vs. 6.33±
1.01 cm/sec, respectively; P=0.036). RV s’ myocardial veloc- ity was lower in the M group compared to the C group (3.15±
0.79 cm/sec vs. 5.32±1.46 cm/sec, respectively; P=0.047) (Table 2).
TAPSE was significantly lower in the M group compared with the C group (1.26±0.22 mm vs. 2.83±0.34 mm, respec- tively; P=0.002) (Table 2).
Tricuspid regurgitant velocity was significantly higher in the M group compared to the C group (4.48±0.34 m/sec vs. 1.23
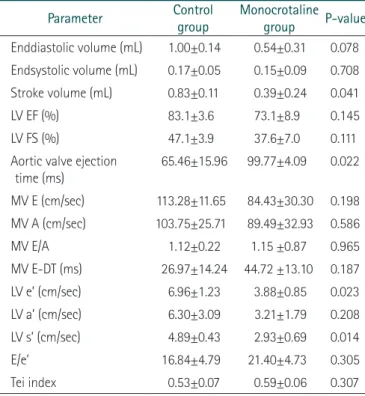
Table 1. Comparison of left ventricular parameters by echocardio- graphy between two groups
Parameter Control
group Monocrotaline group P-value Enddiastolic volume (mL) 1.00±0.14 0.54±0.31 0.078 Endsystolic volume (mL) 0.17±0.05 0.15±0.09 0.708 Stroke volume (mL) 0.83±0.11 0.39±0.24 0.041
LV EF (%) 83.1±3.6 73.1±8.9 0.145
LV FS (%) 47.1±3.9 37.6±7.0 0.111
Aortic valve ejection time (ms)
65.46±15.96 99.77±4.09 0.022
MV E (cm/sec) 113.28±11.65 84.43±30.30 0.198 MV A (cm/sec) 103.75±25.71 89.49±32.93 0.586
MV E/A 1.12±0.22 1.15 ±0.87 0.965
MV E-DT (ms) 26.97±14.24 44.72 ±13.10 0.187
LV e’ (cm/sec) 6.96±1.23 3.88±0.85 0.023
LV a’ (cm/sec) 6.30±3.09 3.21±1.79 0.208
LV s’ (cm/sec) 4.89±0.43 2.93±0.69 0.014
E/e’ 16.84±4.79 21.40±4.73 0.305
Tei index 0.53±0.07 0.59±0.06 0.307
MV, mitral valve; E, early diastolic velocity; A, late atrial peak velocity;
DT, deceleration time; LV, left ventricle; EF, ejection fraction; FS, shortening fraction; e’, early diastolic myocardial velocity; a’, late diastolic myocardial velocity; s’, systolic myocardial velocity.
Table 2. Comparison of right ventricular parameters by echocardio- graphy between two groups
Parameter Control
group Monocrotaline group P-value RA diatolic area (cm2) 0.37±0.05 0.72±0.10 0.005 RA systolic area (cm2) 0.25±0.03 0.50±0.15 0.044 Fractional area change (%) 31.65±5.15 30.95±13.16 0.935 TV E (cm/sec) 79.22±33.40 82.42±16.96 0.889 TV A (cm/sec) 66.00±13.33 73.52±13.20 0.525
TV E/A 1.17±0.34 1.13±0.21 0.893
RV EF (%) 73.1±2.4 54.2±1.8 0.001
RV FS (%) 43.2±3.2 28.3±1.7 0.024
RV e’ (cm/sec) 6.33±1.01 3.77±1.02 0.036
RV a’ (cm/sec) 5.25±1.94 4.80±0.35 0.710
RV s’(cm/sec) 5.32 ±1.46 3.15±0.79 0.047
PV ET (msec) 60.8±5.7 106.6±5.7 <0.001
TAPSE (mm) 2.83±0.34 1.26±0.22 0.002
Tei index 0.54±0.07 0.50±0.15 0.706
RA, right atrium; FAC, fractional area change, TV, tricuspid valve; E, early diastolic velocity; A, late atrial peak velocity; RV, right ventricle;
EF, ejection fraction; FS, shortening fraction; e', early diastolic myocardial velocity; a', late diastolic myocardial velocity; s', systolic myocardial velocity; PV ET, pulmonic valve ejection time; TAPSE, tricuspid annular plane systolic excursion.
±0.02 m/sec, P=0.001) (Table 3, Fig. 2). Pulmonary ejec- tion time was significantly greater in the M group compared to the C group (106.6±5.7 ms vs. 60.8±5.7 ms, respectively;
P<0.001) (Table 2).
Discussion
We established that single subcutaneous injection (60 mg/kg) of MCT induced PAH and demonstrated that TDI is a feasible technique for assessing RV function noninvasively in animal model with PAH.
We demonstrated that MCT-induced PAH causes RV hyper- trophy in animal models. We observed that the RV e’ and s’
myocardial velocities were significantly lower in the M group as compared with the C group. TAPSE was also significantly lower in the M group compared to the C group. Taken together, these results confirm RV dysfunction.
Tricuspid regurgitant velocity and pulmonary ejection time were also significantly higher in the M group as compared to the C group. These findings suggest that the induction of PAH by MCT was successful. This is similar with observations re- ported from previous studies [16,17].
LV systolic and diastolic dysfunction were also noted in MCT induced PAH models in our study. LV e’ and s’ myocardial ve- locities were significantly lower in the M group compared to the C group. Also, although the LV EF and LV FS were reduced in the M group compared with the C group, the values were not significantly different.
Our study revealed that MCT treatment decreased stroke vol- ume, which characterizes the pump function of the LV. This finding is similar with other reports associated with MCT in- duced PAH [12,13] as right heart failure eventually leads to LV failure [18] in MCT-induced PAH [12], although we focused mainly on the RV function in this study.
Although there are some reports demonstrating that MCT
damages pulmonary endothelial cells, exactly how MCT initi- ates lung toxicity is still obscure. Several investigators doubt how relevant MCT-models are in imitating pathobiological process of the human PAH. Despite this, MCT-induced PAH is still the most favored model in preclinical research for evaluating novel therapies [12].
Echocardiography, as a noninvasive and widely accessible imaging modality, aids in investigating cardiac diseases such as PAH and other cardiovascular diseases [5,18,19]. Echocardiog- raphy estimates changes in the structure and function of the RV.
Echocardiographic assessment generates information about the response of the right heart to elevated pulmonary pressures and provides essential diagnostic and prognostic data to the clinician in PAH [10].
TAPSE is the RV longitudinal function of a complex 3D structure [6]. Because it is easily obtainable, reproducible, and relevant to use for both diagnostic and prognostic reasons in many disease states, TAPSE is the most frequently used index for evaluation of RV performance [20].
The advantages of TAPSE are that it is simple and less depen- dent on optimal image quality, intraobserver and interobserver reliability are relatively high [20], and it does not need clear endocardial definition. However, disadvantage of TAPSE is that it is angle and load dependent. There are still many controver- sies regarding the normal reference value.
Both TAPSE and s’ myocardial velocity reflect the longitudi- nal systolic function of the RV [20]. Wang et al. [21] reported that s’ myocardial velocity had a stronger correlation with RV EF measured by cardiac magnetic resonance imaging (CMRI).
In our study, the s’ myocardial velocity and TAPSE were sig- nificantly lower in the M group as compared to the C group.
Although RVFAC is a common parameter for assessing RV systolic function, it is difficult to completely reflect the three- dimensional RV EF. Moreover, the hypertrophied RV trabeculae is a hindrance in distinguishing the endocardium clearly in PAH patients, possibly leading to inaccurate assessment of RVFAC [4]. In our study, there was no significant difference between the two groups.
Furthermore, the RV is significantly affected in pulmonary diseases such as PAH and the RV is remarkably sensitive to car- diac pathologies, including LV dysfunction, valvular disease and RV dysfunction [22].
Although CMRI is the gold standard for noninvasive measure- Table 3. Comparison of TR V by echo car dio graphy between two
groups
Parameter Control
group Monocrotaline
group P-value TR Vmax (m/sec) 1.23±0.02 4.48±0.34 0.001
∆P (mmHg) 6.05±0.12 80.81±12.12 <0.001 TR V, tricuspid regurgitation velocity; TR Vmax, tricuspid regurgitation maximal velocity; ∆P, change in pressure.
ments of RV size and function [9,23], it is often not easy to use it in everyday clinical practice [24].
TAPSE is reported to significantly correlate with RV EF de- rived from radionuclide angiography [25]. Recently, Sato et al.
[25] reported that TAPSE and s’ significantly correlates with RV EF derived from CMRI.
Right Tei index can be obtained by TDI. The advantage is that it is reproducible and depends only on time intervals, which makes it possible to avoid the limitations arising from complex- ity of RV structure [23]. In our study, right Tei index was not statistically different between two groups.
Acknowledgments
The authors gratefully acknowledge the support provided by Basic Science Research Program through the National Research Foundation of Korea funded by Ministry of Education (NRF- 2013 R1A1A3004619 and NRF-2017 R1D1A1B03030831).
References
1. Galie N, Humbert M, Vachiery JL, Gibbs S, Lang I, Torbicki A, et al. 2015 ESC/ERS Guidelines for the diagnosis and treatment of pulmonary hypertension: The Joint Task Force for the Diagnosis and Treatment of Pulmonary Hypertension of the European So- ciety of Cardiology (ESC) and the European Respiratory Society (ERS): Endorsed by: Association for European Paediatric and Congenital Cardiology (AEPC), International Society for Heart and Lung Transplantation (ISHLT). Eur Heart J 2016;37:67-119.
2. Yang T, Liang Y, Zhang Y, Gu Q, Chen G, Ni XH, et al. Echocar- diographic parameters in patients with pulmonary arterial hy- pertension: correlations with right ventricular ejection fraction derived from cardiac magnetic resonance and hemodynamics.
PLoS One 2013;8:e71276.
3. Dutta T, Aronow WS. Echocardiographic evaluation of the right ventricle: clinical implications. Clin Cardiol 2017;40:542-548.
4. Sato T, Tsujino I, Ohira H, Oyama-Manabe N, Yamada A, Ito YM, et al. Validation study on the accuracy of echocardiographic measurements of right ventricular systolic function in pulmo- nary hypertension. J Am Soc Echocardiogr 2012;25:280-286.
5. Cheng HW, Fisch S, Cheng S, Bauer M, Ngoy S, Qiu Y, et al. As- sessment of right ventricular structure and function in mouse model of pulmonary artery constriction by transthoracic echo- cardiography. J Vis Exp 2014;84:e51041.
6. Aloia E, Cameli M, D'Ascenzi F, Sciaccaluga C, Mondillo S.
TAPSE: an old but useful tool in different diseases. Int J Cardiol 2016;225:177-183.
7. De Castro S, Cavarretta E, Milan A, Caselli S, Di Angelanto-
nio E, Vizza Carmine D, et al. Usefulness of tricuspid annular velocity in identifying global RV dysfunction in patients with primary pulmonary hypertension: a comparison with 3D echo- derived right ventricular ejection fraction. Echocardiography 2008;25:289-293.
8. Vizzardi E, Bonadei I, Sciatti E, Pezzali N, Farina D, D'Aloia A, et al. Quantitative analysis of right ventricular (RV) function with echocardiography in chronic heart failure with no or mild RV dysfunction: comparison with cardiac magnetic resonance im- aging. J Ultrasound Med 2015;34:247-255.
9. Thibault HB, Kurtz B, Raher MJ, Shaik RS, Waxman A, De- rumeaux G, et al. Noninvasive assessment of murine pulmonary arterial pressure: validation and application to models of pulmo- nary hypertension. Circ Cardiovasc Imaging 2010;3:157-163.
10. Pristera N, Musarra R, Schilz R, Hoit BD. The role of echocar- diography in the evaluation of pulmonary arterial hypertension.
Echocardiography 2016;33:105-116.
11. Sade LE, Gulmez O, Ozyer U, Ozgul E, Agildere M, Muderrisoglu H. Tissue Doppler study of the right ventricle with a multiseg- mental approach: comparison with cardiac magnetic resonance imaging. J Am Soc Echocardiogr 2009;22:361-368.
12. Nogueira-Ferreira R, Vitorino R, Ferreira R, Henriques-Coelho T. Exploring the monocrotaline animal model for the study of pulmonary arterial hypertension: a network approach. Pulm Pharmacol Ther 2015;35:8-16.
13. Gomez-Arroyo JG, Farkas L, Alhussaini AA, Farkas D, Kraskaus- kas D, Voelkel NF, et al. The monocrotaline model of pulmonary hypertension in perspective. Am J Physiol Lung Cell Mol Physiol 2012;302:L363-L369.
14. Naeije R, Dewachter L. Animal models of pulmonary arterial hypertension. Rev Mal Respir 2007;24(4 Pt 1):481-496.
15. Currie PJ, Seward JB, Chan KL, Fyfe DA, Hagler DJ, Mair DD, et al. Continuous wave Doppler determination of right ventricular pressure: a simultaneous Doppler-catheterization study in 127 patients. J Am Coll Cardiol 1985;6:750-756.
16. Lee MY, Tsai KB, Hsu JH, Shin SJ, Wu JR, Yeh JL. Liraglutide pre- vents and reverses monocrotaline-induced pulmonary arterial hypertension by suppressing ET-1 and enhancing eNOS/sGC/
PKG pathways. Sci Rep 2016;6:31788.
17. Dandel M, Hetzer R. Echocardiographic assessment of the right ventricle: impact of the distinctly load dependency of its size, geometry and performance. Int J Cardiol 2016;221:1132-1142.
18. Geva T, Powell AJ, Crawford EC, Chung T, Colan SD. Evaluation of regional differences in right ventricular systolic function by acoustic quantification echocardiography and cine magnetic resonance imaging. Circulation 1998;98:339-345.
19. Kind T, Mauritz GJ, Marcus JT, van de Veerdonk M, Westerhof N, Vonk-Noordegraaf A. Right ventricular ejection fraction is better reflected by transverse rather than longitudinal wall motion in pulmonary hypertension. J Cardiovasc Magn Reson 2010;12:35.
20. Ueti OM, Camargo EE, Ueti Ade A, de Lima-Filho EC, Nogueira EA. Assessment of right ventricular function with Doppler echo- cardiographic indices derived from tricuspid annular motion:
comparison with radionuclide angiography. Heart 2002;88:244- 248.
21. Wang Z, Yang Z, Wan Z, Yu T, Jia L, Du X, et al. Association between echocardiography derived right ventricular function parameters with cardiac magnetic resonance derived right ven- tricular ejection fraction and 6-minute walk distance in pulmo- nary hypertension patients. Zhonghua Xin Xue Guan Bing Za Zhi 2014;42:748-752.
22. Kaul S, Tei C, Hopkins JM, Shah PM. Assessment of right ven- tricular function using two-dimensional echocardiography. Am Heart J 1984;107:526-531.
23. Rudski LG, Lai WW, Afilalo J, Hua L, Handschumacher MD, Chandrasekaran K, et al. Guidelines for the echocardiographic
assessment of the right heart in adults: a report from the Ameri- can Society of Echocardiography endorsed by the European Association of Echocardiography, a registered branch of the European Society of Cardiology, and the Canadian Society of Echocardiography. J Am Soc Echocardiogr 2010;23:685-713.
24. Smolarek D, Gruchala M, Sobiczewski W. Echocardiographic evaluation of right ventricular systolic function: the traditional and innovative approach. Cardiol J 2017;24:563-572.
25. Sato T, Tsujino I, Ohira H, Oyama-Manabe N, Ito YM, Takashina C, et al. Accuracy of echocardiographic indices for serial moni- toring of right ventricular systolic function in patients with pre- capillary pulmonary hypertension. PLoS One 2017;12:e0187806.