D I A B E T E S & M E T A B O L I S M J O U R N A L
This is an Open Access article distributed under the terms of the Creative Commons Attribution Non-Commercial License (https://creativecommons.org/licenses/by-nc/4.0/) which permits unrestricted non-commercial use, distribution, and reproduction in any medium, provided the original work is properly cited.
Serum Levels of Adipocyte Fatty Acid-Binding Protein Are Associated with Rapid Renal Function Decline in Patients with Type 2 Diabetes Mellitus and Preserved Renal Function
Da Hea Seo1, Moonsuk Nam1, Mihye Jung1, Young Ju Suh2, Seong Hee Ahn1, Seongbin Hong1, So Hun Kim1
Departments of 1Internal Medicine, 2Biomedical Sciences, Inha University School of Medicine, Incheon, Korea
Background: Recent studies have demonstrated that the levels of adipocyte fatty acid-binding protein (A-FABP) are closely asso- ciated with diabetic kidney disease (DKD) in patients with type 2 diabetes mellitus (T2DM). This study aimed to examine the as- sociation between serum A-FABP level and rapid renal function decline in patients with T2DM and preserved renal function.
Methods: This was a prospective observational study of 452 patients with T2DM and preserved renal function who had serial measurements of estimated glomerular filtration rate (eGFR). Rapid renal function decline was defined as an eGFR decline of
>4% per year. The association between baseline serum A-FABP level and rapid renal function decline was investigated.
Results: Over a median follow-up of 7 years, 82 participants (18.1%) experienced rapid renal function decline. Median A-FABP levels were significantly higher in patients with rapid renal function decline, compared to non-decliners (20.2 ng/mL vs. 17.2 ng/
mL, P=0.005). A higher baseline level of A-FABP was associated with a greater risk of developing rapid renal function decline, in- dependent of age, sex, duration of diabetes, body mass index, systolic blood pressure, history of cardiovascular disease, baseline eGFR, urine albumin creatinine ratio, total cholesterol, glycosylated hemoglobin, high-sensitivity C-reactive protein and use of thiazolidinedione, insulin, angiotensin-converting-enzyme inhibitors and angiotensin II-receptor blockers and statin (odds ra- tio, 3.10; 95% confidence interval, 1.53 to 6.29; P=0.002).
Conclusion: A high level of serum A-FABP is associated with an increased risk of rapid renal function decline in patients with T2DM and preserved renal function. This suggests that A-FABP could play a role in the progression of DKD in the early stages.
Keywords: Diabetes mellitus, type 2; Diabetic nephropathies; FABP4 protein, human
Corresponding author: So Hun Kim https://orcid.org/0000-0002-2554-3664 Division of Endocrinology and Metabolism, Department of Internal Medicine, Inha University School of Medicine, 27 Inhang-ro, Jung-gu, Incheon 22332, Korea E-mail: shoney@inha.ac.kr
INTRODUCTION
The prevalence of diabetic kidney disease (DKD) continues to increase worldwide, leading to rising morbidity and premature mortality in patients with diabetes [1]. Despite significant ad- vances in identifying new mechanisms for DKD over the years, factors contributing to the natural course or progression of DKD in people with type 2 diabetes mellitus (T2DM) have re- mained unclear. DKD has been traditionally characterized by
albuminuria, followed by reduced glomerular filtration rate (GFR) [2]. However, recent studies on T2DM have shown that subjects can also develop non-albuminuric renal insufficiency, suggesting that albuminuria is not a prerequisite for the devel- opment of DKD [3,4].
The Joslin Kidney Study in patients with type 1 diabetes mel- litus explored the trajectories of estimated glomerular filtration rate (eGFR) decline over the years and found that most pa- tients had a linear eGFR decline. There was a subset of patients https://doi.org/10.4093/dmj.2019.0221
pISSN 2233-6079 · eISSN 2233-6087
who developed early rapid renal function decline, which oc- curred when they had normal renal function, and the decline in eGFR continued until they reached end stage renal disease (ESRD) [5]. It was suggested that rapid renal function decline is another strong predictor of progression to ESRD [5,6]. Simi- larly, studies in patients with T2DM also showed that most pa- tients have a linear eGFR decline starting at an early stage and the slope varies substantially among patients [4,7,8]. Similarly, patients with T2DM also had a subgroup of patients who had steeper renal function decline [9], which predicted ESRD and premature mortality [10]; however, the definitions of rapid de- cline were not uniform among these studies [6,11]. Clinical factors associated with rapid renal function decline in patients with T2DM have been explored in several studies, but the find- ings were inconsistent [12].
Adipocyte fatty acid-binding protein (A-FABP) is an adipo- kine that is preferentially expressed in adipocytes [13]. Recent studies in animal models have demonstrated that circulating A-FABP is associated with glucose homeostasis via direct in- duction of insulin resistance [14]. Moreover, several human studies have demonstrated that serum A-FABP levels predict the development of metabolic syndrome, T2DM, carotid ath- erosclerosis, and nonalcoholic fatty liver disease [15-17].
Cross-sectional studies in patients with T2DM have suggested that an association exists between serum A-FABP levels and DKD. Serum A-FABP levels were reported to have a negative correlation with eGFR but a positive correlation with microal- buminuria [18-20]. Furthermore, a recent prospective study in patients with T2DM demonstrated that higher levels of A- FABP independently predicted adverse renal outcomes [21].
However, to our knowledge, the role of the level of circulating A-FABP in significant renal function decline in patients with T2DM and preserved renal function has not yet been elucidat- ed. Therefore, we performed this prospective study to evaluate whether baseline serum A-FABP levels were independently as- sociated with the development of rapid renal function decline in patients with T2DM and preserved renal function. Other relevant adipokines and cytokines, including pentraxin-3 (PTX3), were also examined.
METHODS
Study population
The study population consisted of 452 subjects with T2DM and preserved renal function, defined by eGFR ≥60 mL/min/1.72 m2.
The patients were recruited from the outpatient clinic of the Di- abetes Center of Inha University Hospital in Incheon, Korea from March 2007 to December 2009. The inclusion criteria were;
patients older than 20 years of age, diagnosed with T2DM based on the American Diabetes Association criteria [22], and/or be- ing treated with oral hypoglycemic agents or insulin or lifestyle modification for known T2DM. The exclusion criteria were:
patients with congestive heart failure, severe infection, uncon- trolled hypertension, severe dyslipidemia (total cholesterol
>400 mg/dL), a medical condition requiring active manage- ment, diabetes duration <1 year, or an eGFR <60 mL/min/
1.73 m2 and <4 annual GFR measurements during the follow- up. The study protocol was approved by the Institutional Re- view Board of Inha University Hospital, and all participants provided written informed consent prior to participation (IRB No. 2006-67).
Demographic, physical, and laboratory measurements During interviews, trained personnel obtained medical history information from all patients. Height and weight were mea- sured to the nearest 0.1 cm and 0.1 kg, respectively. Body mass index (BMI) was defined as weight (kg) divided by height (m) squared. Waist circumference was measured at the midpoint between the lower borders of the rib cage and the iliac crest.
Blood pressure (BP) was measured after the subject had rested for at least 10 minutes in a sitting position. Diabetic retinopa- thy was diagnosed based on funduscopic examinations. Hy- pertension was defined as BP ≥140/90 mm Hg or treatment with any antihypertensive drug. Cardiovascular disease (CVD) was defined as the presence of ischemic heart disease, includ- ing stable angina, acute coronary syndrome, and myocardial infarction with ST-segment elevation.
Blood samples were collected after an overnight fast of at least 10 hours and stored at –70°C until subsequent assays.
Laboratory measurements, including fasting serum glucose, lipid subfractions, glycosylated hemoglobin (HbA1c), and 75 g oral glucose tolerance testing were conducted in a fasted state.
The level of high-sensitivity C-reactive protein (hs-CRP) was measured using a particle-enhanced immunoturbidimetric as- say (Hitachi High-Technologies Corp., Tokyo, Japan). Homeo- stasis model assessment of insulin resistance (HOMA-IR) lev- els were calculated by dividing the product of insulin (mi- crounits per milliliter) and glucose (millimoles per liter) con- centrations by 22.5 [23]. A random urine sample was obtained for albumin creatinine ratio (ACR) measurements. Albumin-
uria was classified into three stages: normoalbuminuria was defined as spot urine ACR (UACR) <30 μg/mg Cr, microalbu- minuria as UACR ≥30 μg/mg Cr and <299 μg/mg Cr, and macroalbuminuria as UACR ≥300 μg/mg Cr [24].
Renal function measurement
The eGFR values were calculated using the Chronic Kidney Disease Epidemiology Collaboration (CKD-EPI) creatinine equation [25], as follows: eGFR=141×min (Scr/κ, 1)α×max (Scr/κ, 1)−1.209×0.993Age×1.018 (if female); where, Scr is serum creatinine in mg/dL, κ is 0.7 for females and 0.9 for males, α is
−0.329 for females and −0.411 for males, min is the minimum value of Scr/κ or 1, and max is the maximum value of Scr/κ or 1. Annual eGFR decline was calculated as follows; for each pa- tient, a linear regression model of time on eGFR (least-squares method) was fitted, and the slope of the regression line was used to estimate the changes in patient’s eGFR over time. The eGFR slope was expressed as a percentage per year by dividing the slope with the baseline eGFR value [11]. Rapid renal func- tion decline was defined as eGFR decline >4% per year, in ac- cordance with previous studies [11]; this threshold represents an eGFR loss ≥3 mL/min/1.73 m2 per year, which is the cutoff value for representing a magnitude of change that is three times the rate of normal aging [26].
Measurement of cytokine levels
Enzyme-linked immunosorbent assays (ELISAs) were used to measure the serum concentration of A-FABP (Biovendor Lab- oratory Medicine, Modrice, Czech Republic), total adiponectin and high molecular weight (HMW) adiponectin (ALPCO Di- agnostics, Salem, NH, USA), tumor necrosis factor-α (TNF- α), interleukin 6 (IL-6), and PTX3 (R&D Systems, Minneapo- lis, MN, USA). The intra- and inter-assay coefficients of varia- tion (%) were 2.5% and 6.1% for A-FABP, 5.3% and 5.0% for total adiponectin, 3.3% and 5.7% for HMW adiponectin, 3.1%
and 7.4% for TNF-α, 6.9% and 6.5% for IL-6, and 7.3% and 3.4% for PTX3.
Statistical analysis
Data are presented as the mean±standard deviation, median (interquartile range [IQR]), or as numbers (percentages). Base- line characteristics of the participants were compared using Student’s t test or Wilcoxon rank-sum test for continuous vari- ables and Pearson’s chi-square test for categorical variables, as appropriate. Correlations between annual renal function de-
cline (%) and serum levels of various cytokines or adipokines after adjustment for age, sex, BMI, HbA1c, and baseline eGFR were analyzed using the partial Spearman correlation analysis.
To evaluate the difference in clinical characteristics based on the A-FABP tertiles, the cutoff level for each tertile was calcu- lated separately for men and women because A-FABP levels differ significantly by sex. P for trend was calculated using a contrast to test for linear trends in continuous variables and the Cochran-Armitage test for categorical variables.
Multivariable logistic regression models were built to test our hypothesis that high serum A-FABP level at baseline might be an independent risk factor for rapid renal function decline.
The fully adjusted model included clinical risk factors, such as age, sex, duration of diabetes, BMI, systolic blood pressure (SBP), history of cardiovascular disease, baseline eGFR, UACR, total cholesterol, HbA1c, hs-CRP and use of thiazolidinedione, insulin, angiotensin-converting-enzyme inhibitors and angio- tensin II-receptor blockers and statin. All analyses were done with 95% confidence interval (CI), and the level of significance was determined at P<0.05. Statistical analysis was performed with SPSS version 19.0 statistical package software (IBM Corp., Armonk, NY, USA).
RESULTS
Baseline characteristics of study participants
The mean age of the participants was 52.6±9.2 years, 69.2% of them were men, mean duration of diabetes was 5.6±5.1 years, mean HbA1c was 7.9%±1.7%, and baseline eGFR was 85.8±
14.9 mL/min/1.73 m2. Of all the participants, 314 (69.5%) had normoalbuminuria, 114 (25.2%) had microalbuminuria, and 11 (2.4%) had macroalbuminuria. In total, 181 (40.0%) partici- pants had hypertension and 17 (3.8%) had previous history of CVD. During a median follow-up of 7 years (range, 3 to 9 years), all the patients had at least four annual measurements of eGFR. Median annual eGFR decline (%) of the whole cohort was –2.0% per year. During the follow-up period, 82 patients (18.1%) developed rapid renal function decline (rapid declin- ers). Median annual eGFR decline (%) was –5.8% per year in rapid decliners and –0.9% per year in non-decliners (P<0.001).
Three patients developed ESRD at the end of the follow-up.
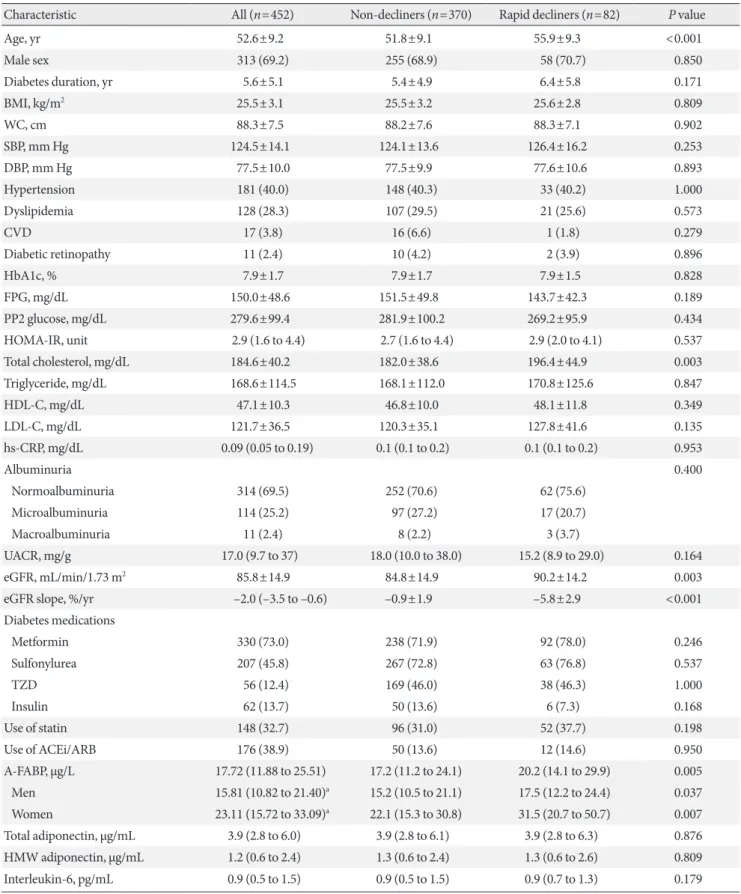
Baseline characteristics of rapid decliners (n=82) and non- decliners (n=370) are summarized in Table 1. Rapid decliners were significantly older and had higher levels of baseline eGFR and total cholesterol. No difference was noted in UACR at
Table 1. Baseline characteristics of the study population according to the presence of rapid renal function decline
Characteristic All (n=452) Non-decliners (n=370) Rapid decliners (n=82) P value
Age, yr 52.6±9.2 51.8±9.1 55.9±9.3 <0.001
Male sex 313 (69.2) 255 (68.9) 58 (70.7) 0.850
Diabetes duration, yr 5.6±5.1 5.4±4.9 6.4±5.8 0.171
BMI, kg/m2 25.5±3.1 25.5±3.2 25.6±2.8 0.809
WC, cm 88.3±7.5 88.2±7.6 88.3±7.1 0.902
SBP, mm Hg 124.5±14.1 124.1±13.6 126.4±16.2 0.253
DBP, mm Hg 77.5±10.0 77.5±9.9 77.6±10.6 0.893
Hypertension 181 (40.0) 148 (40.3) 33 (40.2) 1.000
Dyslipidemia 128 (28.3) 107 (29.5) 21 (25.6) 0.573
CVD 17 (3.8) 16 (6.6) 1 (1.8) 0.279
Diabetic retinopathy 11 (2.4) 10 (4.2) 2 (3.9) 0.896
HbA1c, % 7.9±1.7 7.9±1.7 7.9±1.5 0.828
FPG, mg/dL 150.0±48.6 151.5±49.8 143.7±42.3 0.189
PP2 glucose, mg/dL 279.6±99.4 281.9±100.2 269.2±95.9 0.434
HOMA-IR, unit 2.9 (1.6 to 4.4) 2.7 (1.6 to 4.4) 2.9 (2.0 to 4.1) 0.537
Total cholesterol, mg/dL 184.6±40.2 182.0±38.6 196.4±44.9 0.003
Triglyceride, mg/dL 168.6±114.5 168.1±112.0 170.8±125.6 0.847
HDL-C, mg/dL 47.1±10.3 46.8±10.0 48.1±11.8 0.349
LDL-C, mg/dL 121.7±36.5 120.3±35.1 127.8±41.6 0.135
hs-CRP, mg/dL 0.09 (0.05 to 0.19) 0.1 (0.1 to 0.2) 0.1 (0.1 to 0.2) 0.953
Albuminuria 0.400
Normoalbuminuria 314 (69.5) 252 (70.6) 62 (75.6)
Microalbuminuria 114 (25.2) 97 (27.2) 17 (20.7)
Macroalbuminuria 11 (2.4) 8 (2.2) 3 (3.7)
UACR, mg/g 17.0 (9.7 to 37) 18.0 (10.0 to 38.0) 15.2 (8.9 to 29.0) 0.164
eGFR, mL/min/1.73 m2 85.8±14.9 84.8±14.9 90.2±14.2 0.003
eGFR slope, %/yr –2.0 (–3.5 to –0.6) –0.9±1.9 –5.8±2.9 <0.001
Diabetes medications
Metformin 330 (73.0) 238 (71.9) 92 (78.0) 0.246
Sulfonylurea 207 (45.8) 267 (72.8) 63 (76.8) 0.537
TZD 56 (12.4) 169 (46.0) 38 (46.3) 1.000
Insulin 62 (13.7) 50 (13.6) 6 (7.3) 0.168
Use of statin 148 (32.7) 96 (31.0) 52 (37.7) 0.198
Use of ACEi/ARB 176 (38.9) 50 (13.6) 12 (14.6) 0.950
A-FABP, µg/L 17.72 (11.88 to 25.51) 17.2 (11.2 to 24.1) 20.2 (14.1 to 29.9) 0.005
Men 15.81 (10.82 to 21.40)a 15.2 (10.5 to 21.1) 17.5 (12.2 to 24.4) 0.037
Women 23.11 (15.72 to 33.09)a 22.1 (15.3 to 30.8) 31.5 (20.7 to 50.7) 0.007
Total adiponectin, µg/mL 3.9 (2.8 to 6.0) 3.9 (2.8 to 6.1) 3.9 (2.8 to 6.3) 0.876
HMW adiponectin, µg/mL 1.2 (0.6 to 2.4) 1.3 (0.6 to 2.4) 1.3 (0.6 to 2.6) 0.809
Interleukin-6, pg/mL 0.9 (0.5 to 1.5) 0.9 (0.5 to 1.5) 0.9 (0.7 to 1.3) 0.179
(Continued to the next page)
baseline between the groups. The majority of the rapid declin- ers had normoalbuminuria at baseline (75.6%), which was comparable with that of the non-decliners (70.6%).
Levels of serum A-FABP and other cytokines according to the presence of rapid renal function decline
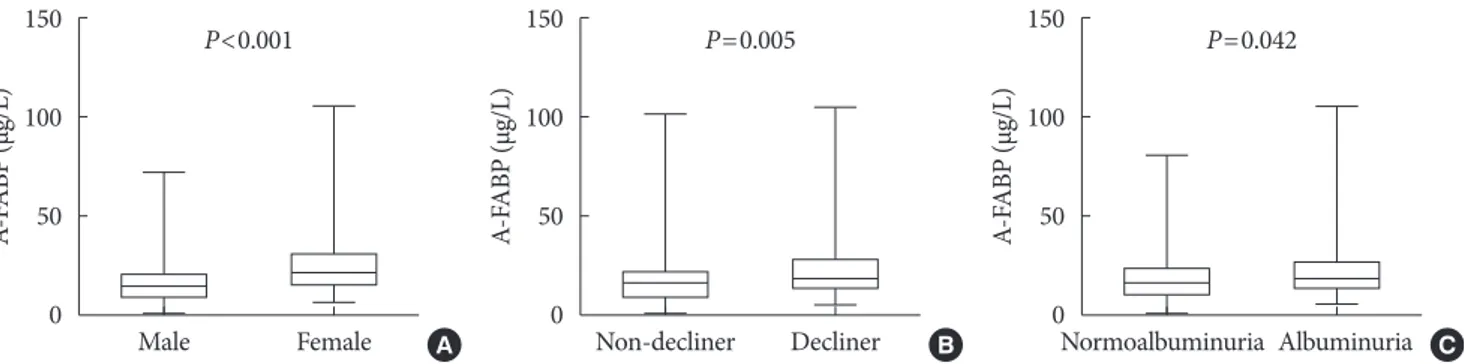
Baseline median serum A-FABP levels were significantly high- er in rapid decliners compared to non-decliners (20.2 µg/L vs.
17.2 µg/L, P=0.005) (Table 1, Fig. 1B). When stratified for sex, similar findings were noted for both men and women (Table 1). Serum A-FABP levels were significantly higher in women than in men (23.1 µg/L vs. 15.8 µg/L, P<0.001) (Fig. 1A). Con- sistent with previous reports [12,13], patients with micro or macroalbuminuria had significantly higher median serum A- FABP concentrations than those with normoalbuminuria (19.5 µg/L vs. 16.6 µg/L, P=0.042) (Fig. 1C). Median serum levels of total adiponectin, HMW, IL-6, TNF-α, and PTX3 showed no difference between rapid decliners and non-decliners.
Table 1. Continued
Characteristic All (n=452) Non-decliners (n=370) Rapid decliners (n=82) P value
TNF-α, pg/mL 1.2 (0.8 to 2.0) 1.3 (0.8 to 2.0) 1.2 (0.8 to 2.1) 0.480
PTX3, ng/mL 1.3 (0.8 to 2.1) 1.2 (0.8 to 2.2) 1.4 (0.9 to 2.1) 0.237
Values are presented as mean±standard deviation, number (%), or median (interquartile range). P values refer to the unpaired t test or the chi- square test (for categorical variables) between non-decliners and rapid decliners.
BMI, body mass index; WC, waist circumference; SBP, systolic blood pressure; DBP, diastolic blood pressure; CVD, cardiovascular disease;
HbA1c, glycosylated hemoglobin; FPG, fasting plasma glucose; PP2, 2-hour postprandial; HOMA-IR, homeostatic model assessment of insulin resistance; HDL-C, high-density lipoprotein cholesterol; LDL-C, low-density lipoprotein cholesterol; hs-CRP, high-sensitivity C-reactive pro- tein; UACR, urine albumin creatinine ratio; eGFR, estimated glomerular filtration rate; TZD, thiazolidinedione; ACEi, angiotensin-converting- enzyme inhibitor; ARB, angiotensin II-receptor blocker; A-FABP, adipocyte fatty acid-binding protein; HMW, high molecular weight adiponec- tin; TNF-α, tumor necrosis factor-α; PTX3, pentraxin-3.
aP<0.001 for A-FABP for men vs. women.
Fig. 1. Comparison of plasma adipocyte fatty acid–binding protein (A-FABP) levels (µg/L) based on sex (A), the presence of rapid renal function decline (B), or albuminuria (C). The bottom of the box plots indicates the 25th percentile and the top indicates the 75th percentile. The middle line of the box indicates the median. The lower and the upper ends of the whiskers indicate the mini- mum and the maximum observations below the upper fence (1.5 interquartile range above the 75th percentile), respectively.
150 100 50 0
150 100 50 0
150 100 50 0
A-FABP (µg/L) A-FABP (µg/L) A-FABP (µg/L)
Male Female Non-decliner Decliner Normoalbuminuria Albuminuria
P<0.001 P=0.005 P=0.042
A B C
Table 2. Association between annual renal function decline (%) and cytokines
Variable Unadjusted Adjusteda
r P value r P value
A-FABP, µg/L –0.055 0.24 –0.150 0.005
hs-CRP, mg/dL –0.013 0.78 0.001 0.99
Fibrinogen, mg/dL –0.064 0.23 –0.046 0.39 Total adiponectin, µg/mL –0.023 0.63 0.071 0.19 HMW adiponectin, µg/mL –0.039 0.40 0.055 0.31 Interleukin-6, pg/mL –0.043 0.36 0.051 0.35
TNF-α, pg/mL 0.037 0.43 –0.045 0.40
PTX3, ng/mL –0.042 0.37 –0.070 0.19
A-FABP, adipocyte fatty acid-binding protein; hs-CRP, high-sensitivi- ty C-reactive protein; HMW, high molecular weight adiponectin;
TNF-α, tumor necrosis factor-α; PTX3, pentraxin-3.
aPartial Spearman’s correlation coefficients (r) are presented after ad- justment for age, sex, body mass index, glycosylated hemoglobin, and baseline estimated glomerular filtration rate.
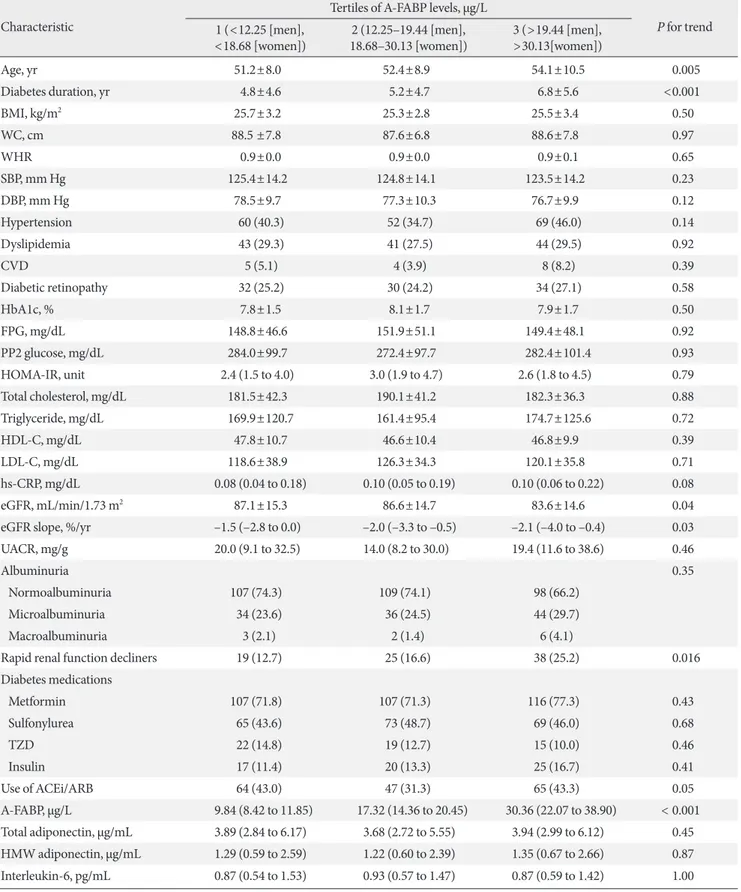
Table 3. Characteristics according to A-FABP tertile levels Characteristic
Tertiles of A-FABP levels, µg/L
P for trend 1 (<12.25 [men],
<18.68 [women]) 2 (12.25–19.44 [men],
18.68–30.13 [women]) 3 (>19.44 [men],
>30.13[women])
Age, yr 51.2±8.0 52.4±8.9 54.1±10.5 0.005
Diabetes duration, yr 4.8±4.6 5.2±4.7 6.8±5.6 <0.001
BMI, kg/m2 25.7±3.2 25.3±2.8 25.5±3.4 0.50
WC, cm 88.5 ±7.8 87.6±6.8 88.6±7.8 0.97
WHR 0.9±0.0 0.9±0.0 0.9±0.1 0.65
SBP, mm Hg 125.4±14.2 124.8±14.1 123.5±14.2 0.23
DBP, mm Hg 78.5±9.7 77.3±10.3 76.7±9.9 0.12
Hypertension 60 (40.3) 52 (34.7) 69 (46.0) 0.14
Dyslipidemia 43 (29.3) 41 (27.5) 44 (29.5) 0.92
CVD 5 (5.1) 4 (3.9) 8 (8.2) 0.39
Diabetic retinopathy 32 (25.2) 30 (24.2) 34 (27.1) 0.58
HbA1c, % 7.8±1.5 8.1±1.7 7.9±1.7 0.50
FPG, mg/dL 148.8±46.6 151.9±51.1 149.4±48.1 0.92
PP2 glucose, mg/dL 284.0±99.7 272.4±97.7 282.4±101.4 0.93
HOMA-IR, unit 2.4 (1.5 to 4.0) 3.0 (1.9 to 4.7) 2.6 (1.8 to 4.5) 0.79
Total cholesterol, mg/dL 181.5±42.3 190.1±41.2 182.3±36.3 0.88
Triglyceride, mg/dL 169.9±120.7 161.4±95.4 174.7±125.6 0.72
HDL-C, mg/dL 47.8±10.7 46.6±10.4 46.8±9.9 0.39
LDL-C, mg/dL 118.6±38.9 126.3±34.3 120.1±35.8 0.71
hs-CRP, mg/dL 0.08 (0.04 to 0.18) 0.10 (0.05 to 0.19) 0.10 (0.06 to 0.22) 0.08
eGFR, mL/min/1.73 m2 87.1±15.3 86.6±14.7 83.6±14.6 0.04
eGFR slope, %/yr –1.5 (–2.8 to 0.0) –2.0 (–3.3 to –0.5) –2.1 (–4.0 to –0.4) 0.03
UACR, mg/g 20.0 (9.1 to 32.5) 14.0 (8.2 to 30.0) 19.4 (11.6 to 38.6) 0.46
Albuminuria 0.35
Normoalbuminuria 107 (74.3) 109 (74.1) 98 (66.2)
Microalbuminuria 34 (23.6) 36 (24.5) 44 (29.7)
Macroalbuminuria 3 (2.1) 2 (1.4) 6 (4.1)
Rapid renal function decliners 19 (12.7) 25 (16.6) 38 (25.2) 0.016
Diabetes medications
Metformin 107 (71.8) 107 (71.3) 116 (77.3) 0.43
Sulfonylurea 65 (43.6) 73 (48.7) 69 (46.0) 0.68
TZD 22 (14.8) 19 (12.7) 15 (10.0) 0.46
Insulin 17 (11.4) 20 (13.3) 25 (16.7) 0.41
Use of ACEi/ARB 64 (43.0) 47 (31.3) 65 (43.3) 0.05
A-FABP, µg/L 9.84 (8.42 to 11.85) 17.32 (14.36 to 20.45) 30.36 (22.07 to 38.90) < 0.001 Total adiponectin, µg/mL 3.89 (2.84 to 6.17) 3.68 (2.72 to 5.55) 3.94 (2.99 to 6.12) 0.45 HMW adiponectin, µg/mL 1.29 (0.59 to 2.59) 1.22 (0.60 to 2.39) 1.35 (0.67 to 2.66) 0.87 Interleukin-6, pg/mL 0.87 (0.54 to 1.53) 0.93 (0.57 to 1.47) 0.87 (0.59 to 1.42) 1.00
(Continued to the next page)
Correlation between annual renal decline (%) and serum level of A-FABP and other adipocytokines
As shown in Table 2, partial Spearman’s correlation analyses was performed to investigate the correlations between annual renal function decline (%) and serum levels of adipokines or cytokines after adjusting for clinical risk factors, including age, sex, BMI, HbA1c, and baseline eGFR. Serum A-FABP showed a negative correlation with annual renal function decline (%) (r=–0.150, P=0.005). No significant correlation was observed between annual renal function decline (%) and other adipo- kines or cytokines.
Independent association between serum A-FABP level and rapid renal function decline
To assess the characteristics of the patients according to the A- FABP levels, the participants were subgrouped into tertiles based on serum A-FABP levels. The incidence of rapid renal function decline in the lowest (T1) to highest (T3) A-FABP tertiles was 12.7%, 16.6%, and 25.2%, respectively (Ptrend 0.016)
(Table 3). Participants in the higher tertiles were older, had a longer duration of diabetes, lower baseline eGFR, and faster eGFR decline per year (%), but no differences were found in baseline UACR. However, the A-FABP level was not signifi- cantly associated with other inflammatory markers. Multivari- able logistic regression analysis showed that baseline serum A- FABP level was independently associated with a greater risk of rapid renal function decline (Model 1; odds ratio [OR] , 1.81;
95% CI, 1.17 to 2.80) after adjustment for age (Table 4). This association remained significant after further adjustment for other factors, including sex, duration of diabetes, BMI, SBP, history of cardiovascular disease, baseline eGFR, UACR, total cholesterol, glycosylated hemoglobin, hs-CRP and use of thia- zolidinedione, insulin, angiotensin-converting-enzyme inhibi- tors and angiotensin II-receptor blockers and statin (OR, 3.10;
95% CI, 1.53 to 6.29; P=0.002). When the analysis was strati- fied by sex, this association remained robust in both men and women (OR, 2.65; 95% CI, 1.10 to 6.38 and OR, 5.65; 95% CI, 1.17 to 27.19 for males and females, respectively) (Table 4).
Characteristic
Tertiles of A-FABP levels, µg/L
P for trend 1 (<12.25 [men],
<18.68 [women]) 2 (12.25–19.44 [men],
18.68–30.13 [women]) 3 (>19.44 [men],
>30.13[women])
TNF-α, pg/mL 1.31 (0.87 to 2.07) 1.28 (0.83 to 1.94) 1.21 (0.76 to 2.16) 0.57
PTX3, ng/mL 1.31 (0.62 to 2.24) 1.22 (0.79 to 2.20) 1.37 (0.91 to 2.13) 0.25
Values are presented as mean±standard deviation, number (%), median (interquartile range).
A-FABP, adipocyte fatty acid-binding protein; BMI, body mass index; WC, waist circumference; WHR, waist hip ratio; SBP, systolic blood pres- sure; DBP, diastolic blood pressure; CVD, cardiovascular disease; HbA1c, glycosylated hemoglobin; FPG, fasting plasma glucose; PP2, 2-hour post prandial; HOMA-IR, homeostatic model assessment of insulin resistance; HDL-C, high-density lipoprotein cholesterol; LDL-C, low-densi- ty lipoprotein cholesterol; hs-CRP, high-sensitivity C-reactive protein; eGFR, estimated glomerular filtration rate; UACR, urine albumin creati- nine ratio; TZD, thiazolidinedione; ACEi, angiotensin-converting-enzyme inhibitor; ARB, angiotensin II-receptor blocker; HMW, high molec- ular weight adiponectin; TNF-α, tumor necrosis factor-α; PTX3, pentraxin-3.
Table 3. Continued
Table 4. OR for rapid renal function decline conferred to the A-FABP levels
Variable All Male Female
ORa (95% CI) P value ORa (95% CI) P value ORa (95% CI) P value
Model 1 1.81 (1.17–2.80) 0.002 1.68 (0.97–2.91) 0.063 3.27 (1.31–8.15) 0.011
Model 2 3.04 (1.53–6.06) 0.002 2.51 (1.08–5.86) 0.033 5.63 (1.33–23.88) 0.019
Model 3 3.10 (1.53–6.29) 0.002 2.65 (1.10–6.38) 0.030 5.65 (1.17–27.19) 0.031
All models were constructed by the logistic regression analysis. Model 1: adjusted for age. Model 2: model 1+adjustments for sex, duration of di- abetes, body mass index, systolic blood pressure, history of cardiovascular disease, baseline estimated glomerular filtration rate, log urine albu- min creatinine ratio, total cholesterol, glycosylated hemoglobin, and log high-sensitivity C-reactive protein. Model 3: model 2+adjustment for use of thiazolidinedione, insulin, angiotensin-converting-enzyme inhibitor/angiotensin II-receptor blocker and statin.
OR, odds ratio; A-FABP, adipocyte fatty acid-binding protein; CI, confidence interval.
aValues are presented adjusted OR of log-transformed A-FABP.
DISCUSSION
In this prospective study of patients with T2DM and preserved renal function, we demonstrated that the baseline serum A- FABP level was independently associated with the develop- ment of early rapid renal function decline during 7 years of fol- low-up. Higher baseline serum A-FABP level was associated with a greater risk of developing rapid renal function decline in patients with T2DM and preserved renal function, indepen- dent of other clinical risk factors.
A few studies have demonstrated that there is an indepen- dent association between A-FABP and diabetic nephropathy [18-20]. However, most of these published studies are limited by small sample sizes and cross-sectional settings. A prospec- tive study by the Hong Kong West Diabetes Registry was pub- lished while our manuscript was in preparation and showed that the level of circulating A-FABP was independently associ- ated with the development of adverse renal outcomes in pa- tients with T2DM, suggesting a significant role of serum A- FABP in DKD as seen in our study [21]. In the present study, we found that a higher baseline serum A-FABP level was inde- pendently associated with the development of early rapid renal function decline in individuals with T2DM and preserved re- nal function. As filtration through the kidneys is an important route of A-FABP clearance [27], we exclusively enrolled indi- viduals with preserved renal function whereas other studies had also included participants with impaired renal function.
Consistent with the results of previous studies on rapid renal function decline in patients with T2DM [7,11], the overall in- cidence of rapid renal function decline in the current study was 18.1% during the median follow-up of 7 years. Patients in the highest and lowest A-FABP tertiles had incidence rates of 25.2% and 16.6%, respectively.
Serum A-FABP levels were significantly higher in females than in males as previously reported [16,28]. Although the rea- son for this difference is not clearly understood it has been speculated that sex hormones, especially androgen, play criti- cal roles in the production and distribution of body fat [29], which regulates circulating A-FABP levels [30]. When analysis was done separately for males and females, serum levels of cir- culating A-FABP remained independently associated with rap- id renal function decline in both males and females.
Although the exact mechanisms underlying rapid renal function decline are unknown, our findings may implicate the potential role of A-FABP in the development and progression
of DKD, especially in the early stages. While the Hong Kong study examined the association between baseline serum A- FABP level and hard renal outcomes such as a sustained 40%
decline in eGFR, ESRD requiring renal replacement therapy or kidney transplantation, or death from renal causes [21], the primary endpoint in the present study was early rapid renal function decline, an outcome that can more sensitively identify patients that are at high risk during the early stages. Early rapid renal function decline is considered a unidirectional process that occurs while patients have normal kidney function and steadily progresses to ESRD [5]; yet, there is no effective prog- nostic tool or marker that identifies rapid decliners in clinical settings. While both albuminuria and reduced eGFR are inde- pendent risk factors of ESRD [31], they are of little value to distinguish non-decliners from rapid decliners during the early stages. Conversely, this study demonstrated the potential im- plication of serum A-FABP as a clinical marker for identifying rapid decliners among patients with T2DM and normal kidney function. It is particularly relevant, as, at present, a good prog- nostic test to identify rapid decliners while they have normal renal function is not available. Furthermore, there is emerging evidence suggesting an increase in the prevalence of DKD without accompanying albuminuria [3], and our study dem- onstrated that baseline serum A-FABP was significantly associ- ated with rapid renal function decline even after adjustment for baseline UACR. Collectively, these findings provide further evidence for the potential role of A-FABP in the pathogenesis of DKD during the earlier stages when no clinical manifesta- tion is present.
Although the exact role of A-FABP in the pathogenesis of rapid renal function decline is not fully understood and is be- yond the scope of the current study, there may be a few possi- ble mechanisms. Previous animal studies on A-FABP−/− mice showed that they were protected from the development of obesity-induced insulin resistance and diet-induced athero- sclerosis [32], and mice treated with an A-FABP inhibitor demonstrated improvement in metabolic profiles as well as marked reduction in atherosclerotic lesions [33]. Similar find- ings were also noted in humans; where, increased A-FABP synthesis in atherosclerotic plaques was associated with disease severity [32]. As atherosclerosis plays a critical role in the de- velopment of early DKD [34], A-FABP may promote athero- sclerotic disease, which, in turn, can lead to rapid renal func- tion decline in patients with T2DM. These findings are further supported by our recent study in patients with T2DM and pre-
served renal function; where, there was a strong association between carotid atherosclerosis and rapid renal function de- cline [35].
Secondly, increased levels of A-FABP may be an indicator of the abnormal angiogenesis that is involved in the pathogenesis of the early stages of DKD. A-FABP has been primarily regard- ed as an adipocyte and macrophage-specific intracellular lipid- binding protein [36]. However, recent studies have demon- strated that A-FABP is also expressed in microvascular endo- thelial cells, including peritubular capillaries of the kidney, in an angiogenesis-dependent manner in both mice and humans [36]. Previous studies on DKD indicated that abnormal angio- genesis is involved in the development of diabetic nephropa- thy, which is triggered by high glucose levels as well as glomer- ular hypertension [37]. Additionally, upregulation of vascular endothelial growth factor expression was also observed, which acts as a mediator of abnormal angiogenesis in diabetic ne- phropathy as well as a regulator of A-FABP in endothelial cells [36,37]. Thus, an elevated serum A-FABP level at baseline may indicate the increased expression of A-FABP in the renal tu- bules as well as endothelial cells of tubular capillaries, suggest- ing that abnormal angiogenesis and accumulation of macro- phages and proinflammatory cytokines occur in the kidneys prior to the impairment of renal function. Accordingly, mea- suring serum A-FABP levels may offer additive information to identify the patients at risk of developing early DKD.
Increasing evidence also points to the critical roles of proin- flammatory cytokines in the development and progression of DKD. Longitudinal studies have shown a positive relationship between hs-CRP, TNF-α, IL-6, and progression of DKD, which is often correlated with albuminuria [38,39]. Another study also demonstrated that both serum and urinary TNF-α levels were increased in diabetic patients with albuminuria, but no correlation was found in patients with normoalbuminuria [40]. Urine concentrations of cytokines, such as IL-6, were re- ported to be markedly elevated in rapid renal function declin- ers with albuminuria [5]. However, in the present study, no significant association was observed between baseline levels of inflammatory cytokines and rapid renal function decline; this may be due to differences in the study population, study end- points, and ethnicity. In fact, the majority of the subjects in our study had normoalbuminuria at baseline (69.5%) and the pro- portion of subjects with normoalbuminuria was similar be- tween rapid decliners and non-decliners. Regarding PTX3, a vascular inflammatory marker, inconsistent results have been
observed in patients with DKD [41]. In our study, no associa- tion was found between PTX3 levels and rapid renal function decline.
The strength of this study includes the prospective design with serial measurements of kidney function to accurately esti- mate the annual eGFR decline and examine the association be- tween rapid renal function decline and adipokines. We also confined the subjects to those with preserved renal function to assess the association between baseline serum A-FABP levels and early progressive renal disease. Moreover, our cohort con- sists of a large number of participants from a homogeneous population and the follow-up period was 7 years. We also mea- sured other proinflammatory cytokines and adipokines along with serum A-FABP. To our knowledge, this is the first pro- spective study showing that high A-FABP serum levels at base- line are associated with increased risk of rapid renal function decline in Asian patients with T2DM and preserved renal function.
The present study, however, has some limitations. First, be- cause our cohort comprised Korean patients with T2DM who were followed at a single, tertiary-level hospital, our results may not be directly applicable to the general population. Sec- ond, there was no direct measurement of GFR but we em- ployed CKD-EPI equations, which have been widely used by many studies. In addition, we measured serial values over time to identify the rate of decline in eGFR that was approximated using linear slopes; the use of such slopes likely smoothed out the variability in individual GFR estimates and measurements.
Third, the serum A-FABP level was determined from a single- point blood sample at baseline. Serial sampling during the nat- ural course of T2DM could help in further elucidating the role of A-FABP in the pathophysiological mechanisms of the devel- opment and progression of DKD. Lastly, renal biopsy was not performed in the majority of subjects in our study; hence, the histological diagnosis of DKD could not be confirmed.
In conclusion, higher levels of serum A-FABP are associated with increased risk of rapid renal function decline in patients with T2DM and preserved renal function. Along with its role as a metabolic risk marker, increased levels of serum A-FABP in diabetic patients may serve as a clinical marker for early progressive renal disease, which will allow early implementa- tion of an intensive treatment in diabetic patients with normal renal function. Further studies are warranted to elucidate the role of A-FABP in the pathophysiological mechanisms in- volved in the development and progression of DKD.
CONFLICTS OF INTEREST
No potential conflict of interest relevant to this article was re- ported.
AUTHOR CONTRIBUTIONS
Conception or design: D.H.S., S.H.K.
Acquisition, analysis, or interpretation of data: D.H.S., M.N., M.J., Y.J.S., S.H.A., S.H., S.H.K.
Drafting the work or revising: D.H.S., M.N., M.J., S.H.A., S.H., S.H.K.
Final approval of the manuscript: S.H.K.
ORCID
Da Hea Seo https://orcid.org/0000-0003-2767-0293 So Hun Kim https://orcid.org/0000-0002-2554-3664
ACKNOWLEDGMENTS
This work was supported by an Inha University Hospital Re- search Grant. No funding sources were involved in the study.
REFERENCES
1. Tuttle KR, Bakris GL, Bilous RW, Chiang JL, de Boer IH, Gold- stein-Fuchs J, Hirsch IB, Kalantar-Zadeh K, Narva AS, Nava- neethan SD, Neumiller JJ, Patel UD, Ratner RE, Whaley-Con- nell AT, Molitch ME. Diabetic kidney disease: a report from an ADA Consensus Conference. Diabetes Care 2014;37:2864-83.
2. de Boer IH, Steffes MW. Glomerular filtration rate and albu- minuria: twin manifestations of nephropathy in diabetes. J Am Soc Nephrol 2007;18:1036-7.
3. Retnakaran R, Cull CA, Thorne KI, Adler AI, Holman RR;
UKPDS Study Group. Risk factors for renal dysfunction in type 2 diabetes: U.K. Prospective Diabetes Study 74. Diabetes 2006;55:1832-9.
4. Vistisen D, Andersen GS, Hulman A, Persson F, Rossing P, Jor- gensen ME. Progressive decline in estimated glomerular filtra- tion rate in patients with diabetes after moderate loss in kidney function-even without albuminuria. Diabetes Care 2019;42:
1886-94.
5. Krolewski AS. Progressive renal decline: the new paradigm of diabetic nephropathy in type 1 diabetes. Diabetes Care 2015;
38:954-62.
6. Pavkov ME, Knowler WC, Lemley KV, Mason CC, Myers BD, Nelson RG. Early renal function decline in type 2 diabetes. Clin J Am Soc Nephrol 2012;7:78-84.
7. Krolewski AS, Skupien J, Rossing P, Warram JH. Fast renal de- cline to end-stage renal disease: an unrecognized feature of ne- phropathy in diabetes. Kidney Int 2017;91:1300-11.
8. Jiang G, Luk AOY, Tam CHT, Xie F, Carstensen B, Lau ESH, Lim CKP, Lee HM, Ng ACW, Ng MCY, Ozaki R, Kong APS, Chow CC, Yang X, Lan HY, Tsui SKW, Fan X, Szeto CC, So WY, Chan JCN, Ma RCW; Hong Kong Diabetes Register TRS Study Group. Progression of diabetic kidney disease and tra- jectory of kidney function decline in Chinese patients with type 2 diabetes. Kidney Int 2019;95:178-87.
9. Warren B, Rebholz CM, Sang Y, Lee AK, Coresh J, Selvin E, Grams ME. Diabetes and trajectories of estimated glomerular filtration rate: a prospective cohort analysis of the atherosclero- sis risk in communities study. Diabetes Care 2018;41:1646-53.
10. Coresh J, Turin TC, Matsushita K, Sang Y, Ballew SH, Appel LJ, Arima H, Chadban SJ, Cirillo M, Djurdjev O, Green JA, Heine GH, Inker LA, Irie F, Ishani A, Ix JH, Kovesdy CP, Marks A, Ohkubo T, Shalev V, Shankar A, Wen CP, de Jong PE, Iseki K, Stengel B, Gansevoort RT, Levey AS. Decline in estimated glo- merular filtration rate and subsequent risk of end-stage renal disease and mortality. JAMA 2014;311:2518-31.
11. Zoppini G, Targher G, Chonchol M, Ortalda V, Negri C, Stoico V, Bonora E. Predictors of estimated GFR decline in patients with type 2 diabetes and preserved kidney function. Clin J Am Soc Nephrol 2012;7:401-8.
12. Sheen YJ, Sheu WH. Risks of rapid decline renal function in patients with type 2 diabetes. World J Diabetes 2014;5:835-46.
13. Kralisch S, Fasshauer M. Adipocyte fatty acid binding protein:
a novel adipokine involved in the pathogenesis of metabolic and vascular disease? Diabetologia 2013;56:10-21.
14. Cao H, Sekiya M, Ertunc ME, Burak MF, Mayers JR, White A, Inouye K, Rickey LM, Ercal BC, Furuhashi M, Tuncman G, Hotamisligil GS. Adipocyte lipid chaperone AP2 is a secreted adipokine regulating hepatic glucose production. Cell Metab 2013;17:768-78.
15. Tso AW, Xu A, Sham PC, Wat NM, Wang Y, Fong CH, Cheung BM, Janus ED, Lam KS. Serum adipocyte fatty acid binding protein as a new biomarker predicting the development of type 2 diabetes: a 10-year prospective study in a Chinese cohort. Di- abetes Care 2007;30:2667-72.
16. Koh JH, Shin YG, Nam SM, Lee MY, Chung CH, Shin JY. Se-
rum adipocyte fatty acid-binding protein levels are associated with nonalcoholic fatty liver disease in type 2 diabetic patients.
Diabetes Care 2009;32:147-52.
17. Yeung DC, Xu A, Cheung CW, Wat NM, Yau MH, Fong CH, Chau MT, Lam KS. Serum adipocyte fatty acid-binding protein levels were independently associated with carotid atherosclero- sis. Arterioscler Thromb Vasc Biol 2007;27:1796-802.
18. Cabre A, Lazaro I, Girona J, Manzanares JM, Marimon F, Plana N, Heras M, Masana L. Plasma fatty acid-binding protein 4 in- creases with renal dysfunction in type 2 diabetic patients with- out microalbuminuria. Clin Chem 2008;54:181-7.
19. Yeung DC, Xu A, Tso AW, Chow WS, Wat NM, Fong CH, Tam S, Sham PC, Lam KS. Circulating levels of adipocyte and epi- dermal fatty acid-binding proteins in relation to nephropathy staging and macrovascular complications in type 2 diabetic pa- tients. Diabetes Care 2009;32:132-4.
20. Toruner F, Altinova AE, Akturk M, Kaya M, Arslan E, Bukan N, Kan E, Yetkin I, Arslan M. The relationship between adipo- cyte fatty acid binding protein-4, retinol binding protein-4 lev- els and early diabetic nephropathy in patients with type 2 dia- betes. Diabetes Res Clin Pract 2011;91:203-7.
21. Lee CH, Cheung CYY, Woo YC, Lui DTW, Yuen MMA, Fong CHY, Chow WS, Xu A, Lam KSL. Prospective associations of circulating adipocyte fatty acid-binding protein levels with risks of renal outcomes and mortality in type 2 diabetes. Dia- betologia 2019;62:169-77.
22. American Diabetes Association. Diagnosis and classification of diabetes mellitus. Diabetes Care 2004;27 Suppl 1:S5-10.
23. Matthews DR, Hosker JP, Rudenski AS, Naylor BA, Treacher DF, Turner RC. Homeostasis model assessment: insulin resis- tance and beta-cell function from fasting plasma glucose and insulin concentrations in man. Diabetologia 1985;28:412-9.
24. Inker LA, Astor BC, Fox CH, Isakova T, Lash JP, Peralta CA, Kurella Tamura M, Feldman HI. KDOQI US commentary on the 2012 KDIGO clinical practice guideline for the evaluation and management of CKD. Am J Kidney Dis 2014;63:713-35.
25. Levey AS, Stevens LA, Schmid CH, Zhang YL, Castro AF 3rd, Feldman HI, Kusek JW, Eggers P, Van Lente F, Greene T, Coresh J; CKD-EPI (Chronic Kidney Disease Epidemiology Collaboration). A new equation to estimate glomerular filtra- tion rate. Ann Intern Med 2009;150:604-12.
26. Rifkin DE, Shlipak MG, Katz R, Fried LF, Siscovick D, Chon- chol M, Newman AB, Sarnak MJ. Rapid kidney function de- cline and mortality risk in older adults. Arch Intern Med 2008;
168:2212-8.
27. Sommer G, Ziegelmeier M, Bachmann A, Kralisch S, Lossner U, Kratzsch J, Bluher M, Stumvoll M, Fasshauer M. Serum lev- els of adipocyte fatty acid-binding protein (AFABP) are in- creased in chronic haemodialysis (CD). Clin Endocrinol (Oxf) 2008;69:901-5.
28. Li JC, Wu DA, Hou JS, Subeq YM, Chen HD, Hsu BG. High serum adipocyte fatty acid binding protein is associated with metabolic syndrome in patients with type 2 diabetes. J Diabetes Res 2016;2016:8380279.
29. Mongraw-Chaffin ML, Anderson CA, Allison MA, Ouyang P, Szklo M, Vaidya D, Woodward M, Golden SH. Association be- tween sex hormones and adiposity: qualitative differences in women and men in the multi-ethnic study of atherosclerosis. J Clin Endocrinol Metab 2015;100:E596-600.
30. Xu A, Wang Y, Xu JY, Stejskal D, Tam S, Zhang J, Wat NM, Wong WK, Lam KS. Adipocyte fatty acid-binding protein is a plasma biomarker closely associated with obesity and metabol- ic syndrome. Clin Chem 2006;52:405-13.
31. Ninomiya T, Perkovic V, de Galan BE, Zoungas S, Pillai A, Jar- dine M, Patel A, Cass A, Neal B, Poulter N, Mogensen CE, Cooper M, Marre M, Williams B, Hamet P, Mancia G, Wood- ward M, Macmahon S, Chalmers J; ADVANCE Collaborative Group. Albuminuria and kidney function independently pre- dict cardiovascular and renal outcomes in diabetes. J Am Soc Nephrol 2009;20:1813-21.
32. Makowski L, Boord JB, Maeda K, Babaev VR, Uysal KT, Mor- gan MA, Parker RA, Suttles J, Fazio S, Hotamisligil GS, Linton MF. Lack of macrophage fatty-acid-binding protein aP2 pro- tects mice deficient in apolipoprotein E against atherosclerosis.
Nat Med 2001;7:699-705.
33. Furuhashi M, Tuncman G, Gorgun CZ, Makowski L, Atsumi G, Vaillancourt E, Kono K, Babaev VR, Fazio S, Linton MF, Sulsky R, Robl JA, Parker RA, Hotamisligil GS. Treatment of diabetes and atherosclerosis by inhibiting fatty-acid-binding protein aP2. Nature 2007;447:959-65.
34. Ohta Y, Fujii K, Arima H, Matsumura K, Tsuchihashi T, Toku- moto M, Tsuruya K, Kanai H, Iwase M, Hirakata H, Iida M. In- creased renal resistive index in atherosclerosis and diabetic ne- phropathy assessed by Doppler sonography. J Hypertens 2005;
23:1905-11.
35. Seo DH, Kim SH, Song JH, Hong S, Suh YJ, Ahn SH, Woo JT, Baik SH, Park Y, Lee KW, Kim YS, Nam M; KNDP Study Group. Presence of carotid plaque is associated with rapid renal function decline in patients with type 2 diabetes mellitus and normal renal function. Diabetes Metab J 2019;43:840-53.
36. Elmasri H, Karaaslan C, Teper Y, Ghelfi E, Weng M, Ince TA, Kozakewich H, Bischoff J, Cataltepe S. Fatty acid binding pro- tein 4 is a target of VEGF and a regulator of cell proliferation in endothelial cells. FASEB J 2009;23:3865-73.
37. Nakagawa T, Sato W, Kosugi T, Johnson RJ. Uncoupling of VEGF with endothelial NO as a potential mechanism for ab- normal angiogenesis in the diabetic nephropathy. J Diabetes Res 2013;2013:184539.
38. Navarro JF, Mora C, Maca M, Garca J. Inflammatory parame- ters are independently associated with urinary albumin in type 2 diabetes mellitus. Am J Kidney Dis 2003;42:53-61.
39. Stehouwer CD, Gall MA, Twisk JW, Knudsen E, Emeis JJ, Parv-
ing HH. Increased urinary albumin excretion, endothelial dys- function, and chronic low-grade inflammation in type 2 diabe- tes: progressive, interrelated, and independently associated with risk of death. Diabetes 2002;51:1157-65.
40. Navarro JF, Mora C, Muros M, Garcia J. Urinary tumour necro- sis factor-alpha excretion independently correlates with clinical markers of glomerular and tubulointerstitial injury in type 2 di- abetic patients. Nephrol Dial Transplant 2006;21:3428-34.
41. Uzun S, Ozari M, Gursu M, Karadag S, Behlul A, Sari S, Koldas M, Demir S, Karaali Z, Ozturk S. Changes in the inflammatory markers with advancing stages of diabetic nephropathy and the role of pentraxin-3. Ren Fail 2016;38:1193-8.