Elevated Serum Homocysteine Levels Were Not Correlated with Serum Uric Acid Levels, but with Decreased Renal Function in Gouty Patients
Hyperhomocysteinemia is one of the important factors of the cardiovascular disease, and gout is well known to be associated with cardiovascular disease. There are a few reports on the serum homocysteine (Hcy) levels in patients with gout, however, the results showed discrepancies. In this study, we measured Hcy levels in patients with gout and examined factors associated with the levels of serum Hcy. Ninety-one male patients with gout and 97 age-matched healthy male controls were enrolled in the study. Serum uric acid levels were not significantly different between gout and healthy control groups. However, serum Hcy levels were significantly higher in patients with gout compared to controls
(13.96 ± 4.05 μM/L vs 12.67 ± 3.52 μM/L, P = 0.035). In gout group, patients with 1-2 stages of chronic kidney disease (CKD) had significantly lower serum Hcy than those with 3-5 stages of CKD (13.15 ± 3.46 μM/L vs 17.45 ± 4.68 μM/L, P < 0.001). Multivariate linear analysis revealed an inverse association between serum Hcy and estimated glomerular filtration rate (eGFR) (β = -0.107, P < 0.001). In conclusion, serum Hcy was elevated in male patients with gout. Hyperhomocysteinemia was not correlated with serum uric acid, but it was inversely associated with impaired renal function.
Keywords: Homocysteine; Uric Acid; Gout; Glomerular Filtration Rate Sang Tae Choi, Jin Su Kim,
and Jung-Soo Song
Division of Rheumatology, Department of Internal Medicine, Chung-Ang University College of Medicine, Seoul, Korea
Received: 4 February 2014 Accepted: 20 March 2014 Address for Correspondence:
Jung-Soo Song, MD
Division of Rheumatology, Department of Internal Medicine, Chung-Ang University College of Medicine, 102 Heukseok-ro, Dongjak-gu, Seoul 156-755, Korea
Tel: +82.2-6299-1372, Fax: +82.2-6299-2017 E-mail: [email protected]
http://dx.doi.org/10.3346/jkms.2014.29.6.788 • J Korean Med Sci 2014; 29: 788-792
INTRODUCTION
Gout is a chronic, progressive illness, which is characterized by hyperuricemia, acute and chronic arthropathies, tophi, and urate urolithiasis (1). Metabolic syndrome with enhanced car- diovascular disease (CVD), chronic kidney disease (CKD), and obesity are associated with the course of gout (2, 3). Patients with chronic gout have a higher mortality rate due to cardiovas- cular comorbidities (4-6). Several mechanisms underlying links between hyperuricemia and CVD in gout have been suggested (7), but there are still many uncertainties.
Homocysteine (Hcy) is a non-essential amino acid formed by the conversion of methionine to cysteine (8). Clinical mani- festations of homocystinuria include developmental delays, os- teoporosis, ocular abnormalities, thromboembolic disease, and severe premature atherosclerosis. In animal studies, a metabol- ic pathway of cellular growth and intercellular matrix synthesis by Hcy derivatives is viewed in the context of the pathogenesis of arteriosclerosis (9). Likewise, hyperhomocysteinemia is be- lieved to be a risk factor of CVD in humans, possibly due to the endothelial cell damage (8, 10, 11).
Both hyperhomocysteinemia and gout are associated with CVD. However, the exact relationships between hyperhomo- cysteinemia and gout remain obscure. There are a few reports
on the serum Hcy levels in patients with gout, however, the re- sults showed discrepancies. Some studies revealed an elevation of serum Hcy in gout (11-13), which was not confirmed else- where (14). Factors confounding the levels of Hcy in gout have not been explored. In this study, we therefore aimed to examine the levels of Hcy and its potential confounders in patients with gout.
MATERIALS AND METHODS Study design and patient population
This cross-sectional, retrospective study included 91 male pa- tients with gout and 97 age-matched healthy male controls. Pa- tients with gout, diagnosed in accordance with the revised Amer- ican College of Rheumatology criteria (15), were randomly en- rolled from inpatient and outpatient clinics at Chung-Ang Uni- versity Hospital in Seoul, Korea from July 1, 2011 to June 30, 2012.
Age-matched healthy controls entered the study after medical examination.
Clinical and laboratory assessment
Age, sex, medication history, and duration of gout were record- ed. Clinical and laboratory data were collected at the blood sam- pling. Serum Hcy, glucose, uric acid (UA), blood urea nitrogen
(BUN), creatinine (Cr), cholesterol profile, and other laboratory investigations were performed in all participants. Serum Hcy levels were measured by a competitive immunoassay using di- rect chemiluminescent technology (Siemens Centaur Immu- noassay Systems, Las Vegas, NV, USA). The estimated glomeru- lar filtration rate (eGFR) was calculated using the modification of diet in renal disease (MDRD) formula (16): eGFR (mL/min/
1.73 m2) = 175 * serum creatinine (exp[-1.154]) * age (exp[-0.203])
* (0.742 if female) * (1.21 if black). Then the stages of CKD were determined according to eGFR levels as follows: stage 1, GFR more than 90 mL/min/1.73 m2; stage 2, GFR between 60-89 mL/min/1.73 m2; stage 3, GFR between 30-59 mL/min/1.73 m2; stage 4, GFR between 15-29 mL/min/1.73 m2; stage 5, GFR less than 15 mL/min/1.73 m2 (17).
Group analysis
All values, including serum Hcy levels in patients with gout, were compared to those in controls. Patients were divided into groups according to renal function and type of uric acid lower- ing drug; and thereafter serum Hcy levels in the formed two groups were compared. We performed correlation analyses be- tween serum Hcy and other clinical and laboratory parameters, including renal function, blood pressure, and cholesterol pro- file in patients with gout.
Statistical analysis
Distributions of all parameters were checked by the Kolmogo- rov-Smirnov test. All measurements with normal distribution were represented as mean ± standard deviation. For the non- normal distribution, median (interquartile range) expression was used. The Mann-Whitney test was employed to compare baseline demographic and clinical data, as well as differences between groups. Associations between serum Hcy levels and other parameters were analyzed by the Spearman’s correlation test. To evaluate relative contribution of hyperhomocysteinemia in gout, a multiple linear regression model was employed. All analyses were performed using SPSS version 13.0 (SPSS Inc., Chicago, IL, USA), and statistical significance was set at P = 0.05 level.
Ethics statement
This study was approved by the institutional review board (IRB) of the Chung-Ang University Hospital (IRB No. C2013170[1130]).
Informed consent requirement was waived by the IRB.
RESULTS
Patient characteristics
We collected data from 91 male patients with gout and 97 age- and sex-matched healthy controls. The disease duration in gout patients was 3.2 ± 1.4 yr. Twenty-one patients (23.1%) were on
antihypertensive drugs (calcium channel blockers 10/91 [11%];
angiotensin II receptor blockers 10/91 [11%]; beta-blockers 4/91 [4.4%]; diuretics 3/91 [3.3%]; low-dose acetylsalicylic acid 5/91 [5.5%]; statins 10/91 [11%]). Basic characteristics of the study participants are presented in Table 1.
Homocysteine in patients with gout
The serum uric acid was not significantly different between pa- tients and controls (6.15 ± 2.23 mg/dL vs 5.82 ± 1.22 mg/dL, P = 0.956). However, patients presented with significantly high- er levels of serum Hcy than controls (13.96 ± 4.05 μM/L vs 12.67
± 3.52 μM/L, P = 0.035) (Fig. 1). The gout group had higher se- rum BUN level compared to the control group (16.44 ± 5.62 mg/dL vs 14.42 ± 3.63 mg/dL, P = 0.015), however there was no significant difference in serum Cr level and eGFR between these two groups (Table 1).
In gout group, patients with 1-2 stages of CKD (n = 74) had significantly lower serum Hcy levels than those with 3-5 stages of CKD (n = 17) (13.15 ± 3.46 μM/L vs 17.45 ± 4.68 μM/L, P <
0.001) (Table 2). However, there were no significant differences in serum Hcy, uric acid, BUN and Cr levels between 1-2 stages of CKD and healthy control (13.15 ± 3.46 μM/L vs 12.67 ± 3.52 μM/L, P = 0.371; 6.07 ± 2.29 mg/dL vs 5.82 ± 1.22 mg/dL, P = 0.360; 14.97 ± 3.75 mg/dL vs 14.42 ± 3.63 mg/dL, P = 0.336; 1.05
± 0.15 mg/dL vs 1.06 ± 0.16 mg/dL, P = 0.496, respectively). Se- rum Hcy levels were not different between patients treated with allopurinol (n=26) and those treated with benzbromarone (n=63).
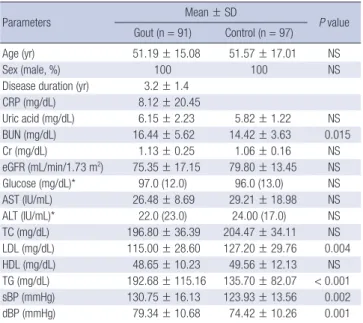
Table 1. Basic characteristics of study participants
Parameters Mean ± SD
P value Gout (n = 91) Control (n = 97)
Age (yr) 51.19 ± 15.08 51.57 ± 17.01 NS
Sex (male, %) 100 100 NS
Disease duration (yr) 3.2 ± 1.4
CRP (mg/dL) 8.12 ± 20.45
Uric acid (mg/dL) 6.15 ± 2.23 5.82 ± 1.22 NS
BUN (mg/dL) 16.44 ± 5.62 14.42 ± 3.63 0.015
Cr (mg/dL) 1.13 ± 0.25 1.06 ± 0.16 NS
eGFR (mL/min/1.73 m2) 75.35 ± 17.15 79.80 ± 13.45 NS
Glucose (mg/dL)* 97.0 (12.0) 96.0 (13.0) NS
AST (IU/mL) 26.48 ± 8.69 29.21 ± 18.98 NS
ALT (IU/mL)* 22.0 (23.0) 24.00 (17.0) NS
TC (mg/dL) 196.80 ± 36.39 204.47 ± 34.11 NS
LDL (mg/dL) 115.00 ± 28.60 127.20 ± 29.76 0.004
HDL (mg/dL) 48.65 ± 10.23 49.56 ± 12.13 NS
TG (mg/dL) 192.68 ± 115.16 135.70 ± 82.07 < 0.001 sBP (mmHg) 130.75 ± 16.13 123.93 ± 13.56 0.002
dBP (mmHg) 79.34 ± 10.68 74.42 ± 10.26 0.001
Normally distributed values were represented as mean ± standard deviation (SD).
*For the non-normal distribution, median (interquartile range) expression was used.
CRP, C-reactive protein; BUN, blood urea nitrogen; Cr, creatinine; eGFR, estimated Glomerular filtration rate; AST, aspartate aminotransferase; ALT, alanine aminotrans- ferase; TC, total cholesterol; LDL, low density lipoprotein; HDL, high density lipopro- tein; TG, triglyceride; sBP, systolic blood pressure; dBP, diastolic blood pressure; NS, not significant.
Correlations between serum homocysteine and other parameters
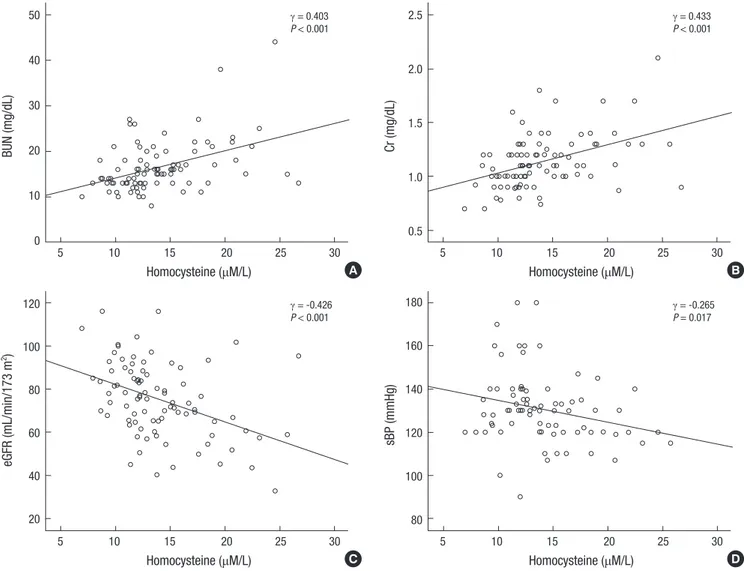
In patients with gout, serum Hcy positively correlated with se- rum BUN and Cr (γ = 0.403, P < 0.001; γ = 0.433, P < 0.001, re- spectively) (Fig. 2A and B). Serum Hcy showed a negative cor- relation with eGFR and sBP (γ = -0.426, P < 0.001; γ = -0.265, P = 0.017, respectively) in gout group (Fig. 2C and D). However, there were no correlations between serum Hcy and uric acid (γ = -0.002, P = 0.988) or lipid profile. In multivariate linear re- gression analysis, serum Hcy was associated with eGFR (β = -0.107, P < 0.001; adjusted R2= 0.272), whereas it was not cor- related with other parameters (Table 3).
DISCUSSION
In this study, serum Hcy was significantly higher in patients with gout compared with healthy controls. However, there was no difference in serum uric acid levels between these two groups.
There are some studies of serum Hcy in gout, suggesting that this marker is not elevated in gout (11-14). Unlike previous stud- ies, uric acid in gout group was not high in our case-control study, possibly because most of the enrolled patients were treated with uric-acid-lowering agents (disease duration 3.2 ± 1.4 yr).
Gout is associated with several comorbidities such as meta- bolic syndrome and CVD (2); however, mechanisms of the as- sociation have not been fully explored. Serum uric acid has been considered as one of the independent predictors of CVD in chronic gout (3, 18). Higher serum Hcy levels in chronic gout along with relatively well-controlled serum uric acid levels sug- gest that Hcy may be a key factor of the increased CVD risk. Hcy has atherogenic and prothrombotic properties. Hcy triggers the production of reactive oxygen species and impairs endothelial
function (4). Hcy-induced vascular injuries lead to the intimal thickening, elastic lamina disruption, smooth muscle hypertro- phy, marked platelet dysfunction, and formation of platelet-rich occlusive thrombi (19, 20), which are all associated with CVD.
Serum Hcy is increased in CKD due to decreased renal clear- ance and impaired metabolism (21). In this study, elevated se- rum Hcy was not correlated with uric acid. There was an in- verse correlation between serum Hcy and renal function (Fig.
2). In gout group, patients with early stages of CKD had signifi- cantly lower serum Hcy levels than those with advanced CKD (Table 2). Serum Hcy and renal function correlations depicted in Fig. 2A-C. Multivariate linear regression analysis showed that decreased eGFR was the only factor associated with hyperho- mocysteinemia (Table 3).
Cheug et al. reported that serum Hcy was elevated in gout, but there were no significant differences in BUN and Cr levels between gout and control groups (13). A major limitation of that study was its small sample size (gout group, n = 51). In an- other study with a larger cohort of gout patients, no significant differences in serum Hcy were observed between disease cases and controls, and creatinine clearance was also not significant- ly different (14), similarly to our results. Considering that gout is associated with CKD (22, 23), we can suggest that decreased re- nal function confounds the elevated serum Hcy in gout. Hyper- homocysteinemia can be one of the possible triggers of increased CVD in the course of chronic gout. Hcy may be an important risk factor for CVD in chronic gout with impaired renal func- tion, despite well-controlled serum uric acid levels.
In this study, there were significant differences in low-density lipoprotein (LDL) and triglyceride (TG) levels between gout and control groups. Hyperhomocysteinemia may have an addi- Fig. 1. Serum homocysteine in gout and control groups. Patients with gout have sig-
nificantly higher serum Hcy levels than healthy controls.
Homocysteine (μM/L)
Gout group Control group
30
20
10
0
P = 0.035 Table 2. Comparisons between groups according to eGFR
Parameters Stages 1-2 CKD
(n = 74) Stages 3-5 CKD
(n = 17) P value Homocysteine (μM/L) 13.15 ± 3.46 17.45 ± 4.68 < 0.001 Uric acid (mg/dL) 6.07 ± 2.29 6.46 ± 1.98 NS BUN (mg/dL) 14.97 ± 3.75 22.82 ± 7.89 < 0.001 Cr (mg/dL) 1.05 ± 0.15 1.50 ± 0.23 < 0.001 eGFR (mL/min/1.73 m2) 81.14 ± 13.05 50.49 ± 7.67 < 0.001 Glucose (mg/dL) 100.88 ± 12.91 96.24 ± 11.35 NS
AST (IU/mL) 26.35 ± 8.87 27.06 ± 8.11 NS
ALT (IU/mL) 30.45 ± 20.99 25.65 ± 13.96 NS
TC (mg/dL) 197.73 ± 38.09 192.76 ± 28.43 NS
LDL (mg/dL) 113.96 ± 29.02 119.53 ± 27.01 NS
HDL (mg/dL) 50.01 ± 10.30 42.71 ± 7.65 0.005 TG (mg/dL) 200.20 ± 122.85 159.64 ± 65.84 NS
sBP (mmHg) 132.36 ± 17.17 124.31 ± 8.83 NS
dBP (mmHg) 80.48 ± 10.84 74.75 ± 8.93 0.033 Values represent the mean ± standard deviation. BUN, blood urea nitrogen; Cr, cre- atinine; eGFR, estimated Glomerular filtration rate; AST, aspartate aminotransferase;
ALT, alanine aminotransferase; TC, total cholesterol; LDL, low density lipoprotein; HDL, high density lipoprotein; TG, triglyceride; sBP, systolic blood pressure; dBP, diastolic blood pressure; NS, not significant.
Fig. 2. Correlations between plasma concentrations of homocysteine and (A) BUN, (B) serum creatinine (Cr), (C) estimated glomerular filtration rate (eGFR), and (D) s ystolic blood pressure (sBP). Plasma concentrations of homocysteine are positively correlated with BUN and Cr, and negatively correlated with eGFR and sBP.
BUN (mg/dL)
Homocysteine (μM/L)
5 10 15 20 25 30
50 40 30 20 10 0
γ = 0.403 P < 0.001
Cr (mg/dL)
Homocysteine (μM/L)
5 10 15 20 25 30
2.5
2.0
1.5
1.0
0.5
γ = 0.433 P < 0.001
eGFR (mL/min/173 m2)
Homocysteine (μM/L)
5 10 15 20 25 30
120 100 80 60 40 20
γ = -0.426 P < 0.001
sBP (mmHg)
Homocysteine (μM/L)
5 10 15 20 25 30
180 160 140 120 100 80
γ = -0.265 P = 0.017 A
C
B
D
Table 3. Multivariate linear regression analysis model including eGFR and sBP
Variable β P value Adjusted R2
Homocysteine Constant 28.076 0.272
eGFR -0.107 < 0.001
sBP -0.047 NS
eGFR, estimated glomerular filtration rate; sBP, systolic blood pressure; NS, not sig- nificant.
tive atherogenic effect on the background of elevated LDL and TG (24, 25). Conversely, hyperlipidemia may lead to hyperho- mocysteinemia. Triple complex of hyperlipidemia, hyperurice- mia, and hyperhomocysteinemia in gout may additively influ- ence the CVD risk increase.
Our study has several limitations. First, only male patients were included in this study. However, one should bear in mind that gout is much more common in men than in women (26, 27).
We could exclude the role of sex hormones in our study by en- rolling only male patients. Second, we did not record data on folate and cobalamin use, which could influence the levels of
serum Hcy. Third, this was a relatively small cross-sectional study, and we did not investigate the incidence of CVD in rela- tion to serum Hcy in gout. A prospective study is warranted to assess the relationships between Hcy and gout-related CVD.
In conclusion, serum Hcy was higher in patients with gout compared with healthy controls. Hyperhomocysteinemia was not correlated with serum uric acid in patients with gout, but there was an inverse association between Hcy and renal func- tion. Our results suggest that hyperhomocysteinemia can be one of the potential triggers of increased CVD risk in patients with chronic gout, especially if their uric acid levels are not elevated.
DISCLOSURE
The authors declare no conflicts of interest.
ORCID
Sang Tae Choi http://orcid.org/0000-0002-2074-1733
Jung-Soo Song http://orcid.org/0000-0001-8651-5125
REFERENCES
1. Rakieh C, Conaghan PG. Diagnosis and treatment of gout in primary care. Practitioner 2011; 255: 17-20.
2. Choi HK, Curhan G. Independent impact of gout on mortality and risk for coronary heart disease. Circulation 2007; 116: 894-900.
3. Krishnan E, Svendsen K, Neaton JD, Grandits G, Kuller LH; MRFIT Re- search Group. Long-term cardiovascular mortality among middle-aged men with gout. Arch Intern Med 2008; 168: 1104-10.
4. Krishnan E. Inflammation, oxidative stress and lipids: the risk triad for atherosclerosis in gout. Rheumatology (Oxford) 2010; 49: 1229-38.
5. Tomita M, Mizuno S, Yamanaka H, Hosoda Y, Sakuma K, Matuoka Y, Odaka M, Yamaguchi M, Yosida H, Morisawa H, et al. Does hyperurice- mia affect mortality? a prospective cohort study of Japanese male work- ers. J Epidemiol 2000; 10: 403-9.
6. Fessel WJ. High uric acid as an indicator of cardiovascular disease: in- dependence from obesity. Am J Med 1980; 68: 401-4.
7. Niskanen LK, Laaksonen DE, Nyyssönen K, Alfthan G, Lakka HM, Lak- ka TA, Salonen JT. Uric acid level as a risk factor for cardiovascular and all-cause mortality in middle-aged men: a prospective cohort study. Arch Intern Med 2004; 164: 1546-51.
8. Petri M, Roubenoff R, Dallal GE, Nadeau MR, Selhub J, Rosenberg IH.
Plasma homocysteine as a risk factor for atherothrombotic events in sys- temic lupus erythematosus. Lancet 1996; 348: 1120-4.
9. McCully KS, Wilson RB. Homocysteine theory of arteriosclerosis. Athero- sclerosis 1975; 22: 215-27.
10. Eikelboom JW, Hankey GJ. Associations of homocysteine, C-reactive pro- tein and cardiovascular disease in patients with renal disease. Curr Opin Nephrol Hypertens 2001; 10: 377-83.
11. Slot O. Homocysteine, a marker of cardiovascular disease risk, is mark- edly elevated in patients with gout. Ann Rheum Dis 2013; 72: 457.
12. Istok R, Kovalancík M, Rovenský J. Total plasma homocysteine in pa- tients with gout. J Rheumatol 1999; 26: 2068-9.
13. Cheng TT, Lai HM, Chang HW, Luo SF. Elevated serum homocysteine levels for gouty patients. Clin Rheumatol 2005; 24: 103-6.
14. Tsutsumi Z, Moriwaki Y, Yamamoto T, Takahashi S, Hada T, Fukuchi M.
Total plasma homocysteine is not increased in Japanese patients with gout. J Rheumatol 2002; 29: 1805-6.
15. Wallace SL, Robinson H, Masi AT, Decker JL, McCarty DJ, Yü TF. Pre- liminary criteria for the classification of the acute arthritis of primary gout. Arthritis Rheum 1977; 20: 895-900.
16. Levey AS, Bosch JP, Lewis JB, Greene T, Rogers N, Roth D. A more accu- rate method to estimate glomerular filtration rate from serum creatinine:
a new prediction equation: Modification of Diet in Renal Disease Study Group. Ann Intern Med 1999; 130: 461-70.
17. Levey AS, de Jong PE, Coresh J, El Nahas M, Astor BC, Matsushita K, Gansevoort RT, Kasiske BL, Eckardt KU. The definition, classification, and prognosis of chronic kidney disease: a KDIGO Controversies Confer- ence report. Kidney Int 2011; 80: 17-28.
18. Petriş A, Cimpoeşu D, Petriş O, Costache I. Uric acid, cardiovascular events and renal dysfunction: a circumstantial connection? Rev Med Chir Soc Med Nat Iasi 2012; 116: 407-12.
19. Rolland PH, Friggi A, Barlatier A, Piquet P, Latrille V, Faye MM, Guillou J, Charpiot P, Bodard H, Ghiringhelli O, et al. Hyperhomocysteinemia-in- duced vascular damage in the minipig: captopril-hydrochlorothiazide combination prevents elastic alterations. Circulation 1995; 91: 1161-74.
20. Tsai JC, Perrella MA, Yoshizumi M, Hsieh CM, Haber E, Schlegel R, Lee ME. Promotion of vascular smooth muscle cell growth by homocysteine:
a link to atherosclerosis. Proc Natl Acad Sci U S A 1994; 91: 6369-73.
21. Ferechide D, Radulescu D. Hyperhomocysteinemia in renal diseases. J Med Life 2009; 2: 53-9.
22. Nashar K, Fried LF. Hyperuricemia and the progression of chronic kid- ney disease: is uric acid a marker or an independent risk factor? Adv Chronic Kidney Dis 2012; 19: 386-91.
23. Marwah RK. Comorbidities in gouty arthritis. J Investig Med 2011; 59:
1211-20.
24. Feng SQ, Ye P, Luo LM, Xiao WK, Xu RY, Wu HM. Relationship between serum homocysteine and metabolic syndrome: a cross-sectional study.
Zhonghua Liu Xing Bing Xue Za Zhi 2012; 33: 256-9.
25. Daly C, Fitzgerald AP, O’Callaghan P, Collins P, Cooney MT, Graham IM; COMAC Group. Homocysteine increases the risk associated with hy- perlipidaemia. Eur J Cardiovasc Prev Rehabil 2009; 16: 150-5.
26. Mikuls TR, Farrar JT, Bilker WB, Fernandes S, Schumacher HR Jr, Saag KG. Gout epidemiology: results from the UK General Practice Research Database, 1990-1999. Ann Rheum Dis 2005; 64: 267-72.
27. Hak AE, Curhan GC, Grodstein F, Choi HK. Menopause, postmenopausal hormone use and risk of incident gout. Ann Rheum Dis 2010; 69: 1305-9.