Image Enhancement for Sub-Harmonic Phased Array by Removing Surface Wave Interference with Spatial Frequency Filter
Choon-Su Park*†, Jun-Woo Kim*, Seung Hyun Cho* and Dae-Cheol Seo*
Abstract Closed cracks are difficult to detect using conventional ultrasonic testing because most incident ultrasound passes completely through these cracks. Nonlinear ultrasound inspection using sub-harmonic frequencies a promising method for detecting closed cracks. To implement this method, a sub-harmonic phased array (PA) is proposed to visualize the length of closed cracks in solids. A sub-harmonic PA generally consists of a single transmitter and an array receiver, which detects sub-harmonic waves generated from closed cracks. The PA images are obtained using the total focusing method (TFM), which (with a transmitter and receiving array) employs a full matrix in the observation region to achieve fine image resolution. In particular, the receiving signals are measured using a laser Doppler vibrometer (LDV) to collect PA images for both fundamental and sub-harmonic frequencies.
Oblique incidence, which is used to boost sub-harmonic generation, inevitably produces various surface waves that contaminate the signals measured in the receiving transducer. Surface wave interference often degrades PA images severely, and it becomes difficult to read the closed crack’s position from the images. Various methods to prevent or eliminate this interference are possible. In particular, enhancing images with signal processing could be a highly cost-effective method. Because periodic patterns distributed in a PA image are the most frequent interference induced by surface waves, spatial frequency filtering is applicable for removing these waves. Experiments clearly demonstrate that the spatial frequency filter improves PA images.
Keywords: Sub-Harmonic Phased Array, Image Enhancement, 2-D Fourier Transform, Spatial Frequency Filter, Surface Wave Interference, Total Focusing Method (TFM)
[Received: February 10, 2014, Revised: May 8, 2014, Accepted: May 14, 2014] *Center for Safety Measurements, Division of Metrology for Quality of Life, Korea Research Institute of Standards and Science, 267 Gajeong-Ro, Yuseong-Gu, Daejeon 305-340, Korea ✝Corresponding Author: [email protected]
ⓒ 2014, Korean Society for Nondestructive Testing
1. Introduction
It commonly happens that the length of cracks in structures is underestimated due to crack closure around crack tips. This is because ultrasonic waves for conventional ultrasonic inspections transmit the closed part as if it has never opened before [1]. Nonlinear ultrasound has been introduced and developed to see what linear ultrasound cannot detect for more than half a century. Particularly, harmonic generation at un-bonded interface subjected to a sufficiently intense incident ultrasonic wave is theoretically developed and experimentally observed [2,3]. In addition, sub-harmonic frequency generation at closed crack was theoretically formulated [1,4],
and Akino et al. [5] observed experimentally sub- harmonic frequency generation with an alumi- num alloy that has fatigue cracks.
How far closed cracks are extended is cer- tainly more practical than simply whether the closed crack is or not. sub-harmonic phased array (PA) was proposed to image where closed cracks are by Ohara et al. [6]. The sub-harmonic PA system is composed of a receiving array for imaging and a single crystal transmitter that is known to have less nonlinearity than other con- ventional ultrasound transmitters. Incident ultra- sounds from the single crystal transmitter are recommended to put into a specimen not only with an optimum power but also with an oblique angle for ensuring sub-harmonic frequency gen-
eration[5,7].
A properly designed wedge is generally used to put the waves into a specimen obliquely, and various waves are also generated from the interface between the wedge and the specimen.
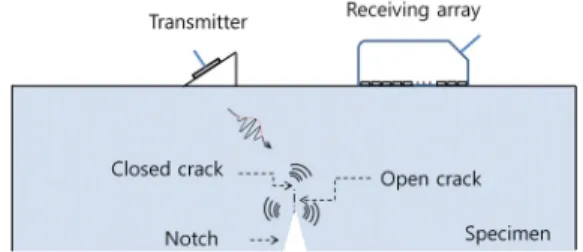
Some of the waves might be able to develop into surface waves that propagate along the surface of the specimen. It is inevitable of the surface wave to be measured with the longitu- dinal waves scattered from cracks, since the receiver is placed on the same surface with the wedge (See Fig. 2). This causes that surface waves contaminate the signal of interest to some extent, and the interference eventually degrades PA image quality.
The objective is to enhance sub-harmonic PA images corrupted by unwanted interference with spatial frequency filtering. To show how effective the proposed way is, at first, PA imaging is briefly explained, and what makes the sub-harmonic PA to be distinguished from the conventional PA is delineated in Ch. 2. The sub-harmonic PA system that inevitably induces surface waves is explained in detail, and a PA image contaminated by the interferences is shown in Ch. 3. Next, basic concept of spatial frequency filtering based on 2-D Fourier transform is given in Ch. 4. In Ch. 5, experimental setup and signal processing parameters to enhance images are explained, and an enhanced image is finally given.
2. Sub-Harmonic Phased Array Imaging 2.1 Phased Array Imaging Technique
Phased array imaging is a way to make images with sensor arrays. Phased array means an array that can control the phase of outgoing signals (for a transmitter array), incoming signals (for a sensor array), or both of them of each element in the array. Phase control could be done by delaying (or shifting) signals. PA images
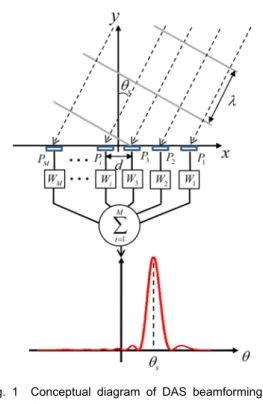
Fig. 1 Conceptual diagram of DAS beamforming; a linear sensor array that has M sensor elements and its beam power distribution with respect to bearing angle.
are made from summing the delayed signals.
The delay and sum (DAS) is the oldest and the simplest array signal processing algorithm to form and steer beams [8].
Fig. 1 conceptually describes the DAS beam- forming algorithm to estimate direction of arrival (DOA) with a linear array. For simplicity, a plane wave with a wavelength, , is incident into the array that has sensors with an angle of . The incident waves are measured at each sensor element ( ⋯). The signals contain time delays with respect to the position of the elements, and the signals are put into a series of scan vector ( ⋯) that have information on time delays corres- ponding to whole angle of interest. Then, the signals are calculated with the scan vectors; the calculation means time shift in time domain or multiplication in frequency domain. (See Refs.
[9,10] in details)
Fig. 2 A sub-harmonic PA measurement setup;
a single transmitter and a receiving array
2.2 Sub-Harmonic Phased Array
sub-harmonic PA is composed of a single transmitter and a receiving array. The transmitter is recommended to use single crystal type piezo- materials to exclude nonlinearity which might be in transmitter. The receiver is an array to make images from signals measured with time delays.
In addition, the input waves are suggested to be incident into the solid obliquely to generate clear sub-harmonic frequency. It is noteworthy that frequency spectra for normal incidence and oblique incidence in Ref. [5] show clear differ- ence at sub-harmonic frequency. This might be related with radiation pattern of closed cracks.
Fig. 2 shows a typical sub-harmonic PA system setup. The center frequency of the receiving array, , is recommended to be
, ,
3
r c 4 i c
f = f (1)
where is center frequency of the transmitter.
That is, the receiver center frequency should be slightly lower than the transmitter, since the receiver has to pick up not only the input frequency () but also sub-harmonic frequency () with similar sensitivity. The signals received are, then, delayed and summed with respect to possible source location, and two images are obtained by passing through digital filters; one is for the input frequency and the other is for its sub-harmonic frequency. Detail procedure is given and explained in Ref. [11]
3. Surface Wave Interference
As mentioned in Ch. 2, the input waves should be incident obliquely, and wedges are generally adopted to put the input waves with some inclined angle. Moreover, the intensity of input waves should be sufficiently large to generate sub-harmonic frequency. Yamanaka et al. [4] use a 2 kV signal generator with gated
amplifier, and it assures that the vibration displacement level putting directly into closed cracks is larger than 20 nm for fatigue cracks in aluminum alloys.
Although an inclined angle of a wedge is carefully designed by Snell’s law, the broad and intense signal generated from transmitter could induce various surface waves at the interface between the wedge and the specimen due to mode conversion (for example, see Ref. [12]) at the interface, irregular contact condition, and so on. Then, the surface waves are propagating into the receiving array, and they might be able to contaminate longitudinal waves scattered from cracks to some extent.
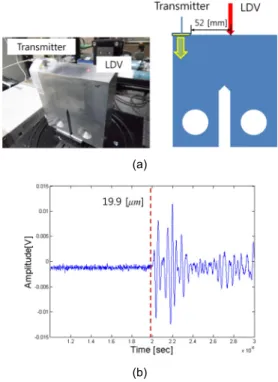
Fig. 3 shows how surface waves are easily made with no intention of generating. A com- mercial transducer with 5 MHz center frequency was put on the top of a specimen that generates longitudinal waves into the specimen as shown in Fig. 3(a). Then, the vibration displacement was measured at 52 mm apart from the trans- mitter by a laser Doppler vibrometer (LDV).
Fig. 3(b) shows that a clear oscillation is ob- served around 19.9 μs, which is the exact arrival time of surface wave when the surface wave velocity is 2899 m/s for the given aluminum specimen. The velocity is experimentally obtained from a pre-experiment for the specimen with a laser interferometer.
In practice, let us see a PA image which was corrupted by surface wave interference. For example, Fig. 4 shows a corrupted PA image
that should show a crack location around (0,55) in x and z direction, respectively. (Detail experi- mental setup will be shown in Ch.5.) As can be seen in Fig. 4, there are lots of noises that is induced from surface waves and contaminate the image, and it is hard to recognize where the crack is located.
(a)
(b)
Fig. 3 An experimental example with no intention of generating surface wave; (a) an experi- mental setup, (b) measured signal by LDV that shows clear oscillation at the exact arrival time of surface wave.
Fig. 4 A corrupted PA image that should show a crack position at (0, 55).
4. 2-D Signal Processing for Image Enhancement 4.1 Spatial Frequency Analysis
Phased array images are a spatial distribution of beamformer’s output signal. In other words, they show what we want to see with a color map distribution like photograph. This means that well-developed image signal processing techniques could be applied to the PA images.
Many techniques in spatial frequency domain have been developed and they are based on 2-D Fourier transform [13].
2-D (spatial) Fourier transform is nothing but a linear superposition of 1-D (temporal) Fourier transform. To be concrete, let us take a basic spatial frequency spectrum into account. a simple model might be a periodically distributed sinusoids centered at a point (, ), which is a basic model that can consists of any general distribution. It can be formulated as
( )
( , ) c s
j k R
x y e
R
ϕ
⋅ +
=
P , (2)
where
and is an arbitrary spatial phase. The spatial frequency spectrum is given by( )
2 2 2
ˆ ( , ) 2
p x p y s j x k y k j
x y
c x y
e e
k k j
k k k
π ϕ ⋅ +
= − −
P
, (3)
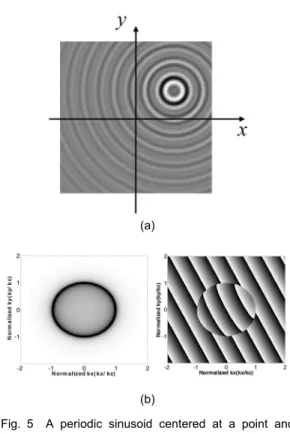
which is obtained from 2-D Fourier transform pair in Appendix. Fig. 5 shows a typical distribution of a point source at off-center in space and its spatial frequency spectrum. The spectrum has a circle at the characteristic spatial frequency, , which is in the denominator in Eq. (3). That is, the spectrum has theoretically infinite at . (for example, see Ref. [13]) This means that the spatial distribution has most energy at . Another interest thing is observed in phase variation of the spectrum: periodic
(a)
(b)
Fig. 5 A periodic sinusoid centered at a point and the spatial frequency spectrum; (a) a periodic oscillation centered at (, ) with a spatial frequency, (b) magnitude (LHS) and phase (RHS) of the spatial frequency spectrum normalized by .
(a)
(b)
Fig. 6 Spatial frequency filters; (a) a low pass filter, (b) a band pass filter
variation with an incline. This is associated with the point source location, which is in the numerator in Eq. (3). It is noteworthy that a point in space becomes periodic variation in spatial frequency domain.
4.2 Spatial Frequency Filtering
As discussed in Ch. 4.1, any specific spatial distribution has its own spatial frequency spectrum. This leads us that we could enhance images (i.e. spatially distributed intensity) properly in spatial frequency domain if noises are characterized in advance. Spatial frequency filtering might be the most prevalent and simple way for enhancing images in spatial frequency domain. The spatial frequency filtering could be understood along the same line with frequency
filtering for time signals.
The frequency filters are classified by the frequency region of interest: low, high, and band-pass filters. The spatial frequency filters are also divided into the same category with the frequency filter (e.g., see Ref. [14]). Fig. 6 shows a low pass filter and a band-pass filter.
Spatial frequency spectrum has an origin at the center on a plane, since the spatial data con- verted by 2-D Fourier transform has real-value and they are conjugate-even in spatial frequency domain [15].
When an image has some noises that are distributed periodically, the image could be enhanced by properly designed spatial frequency filtering. At first, the characteristics of noises should be identified by observing in not only space but spatial frequency domain. Then, how the noises are distributed in spectrum and which spatial frequency components they have should be identified. The information let us design spatial frequency filter appropriately. The spatial
(a)
(b)
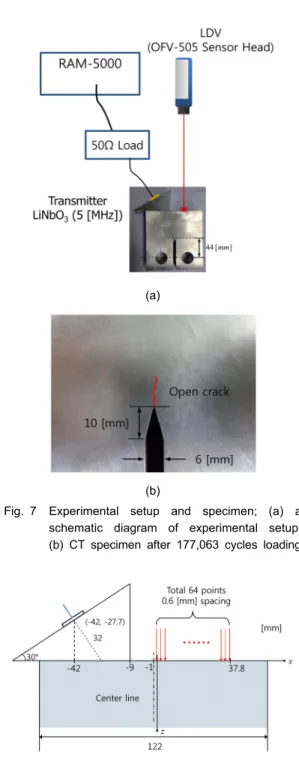
Fig. 7 Experimental setup and specimen; (a) a schematic diagram of experimental setup, (b) CT specimen after 177,063 cycles loading
Fig. 8 A coordinate setup for sub-harmonic PA imaging
frequency spectrum of an image of interest is multiplied by the designed spatial frequency filter, and then the filtered spectrum is trans- formed into space domain again by inverse 2-D Fourier transform. Finally, the images enhanced by removing noises are obtained.
5. Image Enhancement by Removing Interference 5.1 Experimental Set-Up
Fig. 7 shows the experimental setup for not only obtaining sub-harmonic PA images but also observing surface wave interference already shown in Fig. 4. The input signals are generated from high voltage signal generator (RAM-5000) and pass through only a 50 Ohm load to trans- fer as much voltage as it can into a transmitter as well as to match impedance between the generator and the transmitter. The transmitter used is single crystal lithium-Niobate (LiNbO3), which is known to be free from its own non- linearity as a transmitter. The signal put into the transmitter is a 10-cycle tone burst signal at 5 MHz frequency.
The CT (compact tension) specimen was an aluminum alloy (A7075) and designed based on ASTM E-399. To make closed cracks, fatigue test condition was set to be along the same line as what Ohara et al. have done [16]. That is, the final stress intensity factor was set to be 317.19 MPa·m1/2 and number of cycles to be 177,063 cycles considering specimen size, 122× 125×51 (W×H×D) mm. The signals passed through the specimen are measured with LDV (DD-300 displacement decoder and OFV-505 sensor head), which has a flat frequency response (50 nm/V for 30 kHz~24 MHz with 0.1 pm minimum detectable displacement) in the region of interest, step by step. LDV measured the signals at 64 points, which is equally spaced with 0.6 mm, on the top of the specimen as shown in Fig. 8.
The images are colored by total focusing method(TFM) that constructs images using all sets of transmitters and receivers with respect to every scan point in the region of interest[17].
The coordinate set-up and sensor positions for imaging are shown in Fig. 8.
(a)
(b)
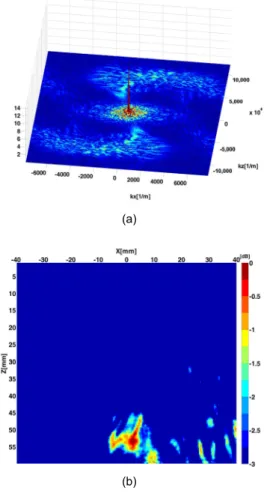
Fig. 9 Noise characteristics in spatial frequency domain and an enhanced PA image; (a) spatial frequency spectrum, (b) a PA image enhanced by spatial frequency filtering
5.2 PA Image Enhancement
To observe PA image for a specific fre- quency component, the measured signals should be passed through a band-pass filter. Butterworth FIR band-pass filter of 5th order is used for frequency filtering. Bandwidth is set to be 1 MHz not to overlap between fundamental frequency image and sub-harmonic frequency image.
The PA image firstly obtained is already shown in Fig. 4. There are too much noisy to see crack location. After frequency filtering, it leads to observe spatial frequency spectrum to identify noise characteristics. Fig. 9(a) is a spatial frequency spectrum of 5 MHz center frequency band signal, which shows clearly separated features between signals of interest and noise. Beam output shape obtained by TFM usually has low spatial frequency around zero, since shape could be regarded as slowly varying signals. As shown in Fig. 9(a), there is a high peak around zero spatial frequency, and a broad distribution within 2000 [1/m] that is likely to be related with beam output shape.
On the other hand, above 2000 [1/m] spatial frequency, there are sparsely distributed noises like swirling blades.
To remove the high spatial frequency noises, low spatial frequency filter that has 2000[1/m]
cut-off spatial frequency. As a result, Fig. 9(b) shows the enhanced image after passing the low spatial frequency filter. Comparing with the raw PA image in Fig. 4, the enhanced image clearly shows the maximum peak point around (0, 55) [mm]. With the maximum peak, some low peaks are distributed around on the right part as shown in Fig. 9(b). The maximum peak is the most important in beam-forming images, because it represents a possible source location [10].
Peaks with similar magnitude are able to appear when there are other incoherent sources (namely, other cracks), but there assured to be no cracks in the specimen used for experiments. Therefore,
the peaks might be from noise within the cutoff spatial frequency, which could not be removed by the spatial filtering.
6. Conclusions
It frequently happens that unwanted inter- ference degrades PA images. In particular, sub- harmonic PA seems unlikely to have surface wave interference owing to receiver position nearby a transmitting wedge. A cost-effective solution to erase the interference seems to filter it out with appropriately designed filters, since the surface wave interference usually has
distinguished feature from beamformer’s output which shows crack positions. The beamformer’s output commonly has low spatial frequency, but the interference gets relatively high spatial fre- quency components. This definitely leads us to enhance PA images with low spatial frequency filtering.
PA images corrupted by the interference were continuously acquired during experiments, and they were too noisy to identify where cracks are. Spatial frequency spectrum of the corrupted image showed where and how the noises are distributed, and an adequate filter could be designed with respect to the cut-off spatial frequency. Finally, the contaminated images proved to become enhanced enough to clearly show crack position.
The experimental results show a clear validation on the effect of spatial filtering for the fundamental frequency images. It would be also expected to successfully apply to PA images for sub-harmonic frequency.
Acknowledgment
This work was partly supported by Korea Research Institute of Standards and Science (KRISS) under the project “Development of Advanced Measurement Technology for Public Safety” (KRISS-2014-14011055) and also partly supported by Radiation Technology R&D program through the National Research Foun- dation of Korea funded by the Ministry of Science, ICT & Future Planning (NRF-2013M 2A2A9043274).
References
[1] K. Yamanaka, T. Mihara and T. Tsuji,
"Evaluation of closed cracks by model an- alysis of sub-harmonic ultrasound," Japanese Journal of Applied Physics, Vol. 43, No.
5B, pp. 3082-3087 (2003)
[2] O. Buck, W. L. Morris and J. M.
Richardson, "Acoustic harmonic generation at unbonded interfaces and fatigue cracks,"
Applied Physics Letters, Vol. 33, No. 5, pp. 371-373 (1978)
[3] J. M. Richardson, "Harmonic generation at an unbonded interface-I. Planar interface between semi-infinite elastic media,"
International Journal of Engineering Science, Vol. 17, No. 1, pp. 73-85 (1979) [4] K. Yamanaka, T. Mihara and T. Tsuji,
"Evaluation of nanoscale cracks by lowpass filter effect in nonlinear ultrasound," Proc.
2003 IEEE Ultrasonics Symposium, Honolulu, Hawaii, USA, pp. 972-977 (2003)
[5] M. Akino, T. Mihara and K. Yamanaka,
"Fatigue crack closure analysis using non- linear ultrasound," Review of Quantitative Nondestructive Evaluation, Green Bay, Wisconsin, USA, pp. 1256 (2004)
[6] Y. Ohara, T. Mihara, R. Sasaki, T. Ogata, S. Yamamoto, Y. Kishimoto and K.
Yamanaka, "Imaging of closed cracks using nonlinear response of elastic waves at sub-harmonic frequency," Applied Physics Letters, Vol. 90, 011902 (2007)
[7] Y. Ohara, S. Yamamoto, T. Mihara and K. Yamanaka, "Ultrasonic evaluation of closed cracks using sub-harmonic phased array," Japanese Journal of Applied Physics, Vol. 47, No. 5, pp. 3908-3915 (2008) [8] D. Johnson and D. E. Dudgeon, "Array
Signal Processing: Concepts and Techniques,"
PTR Prentice Hall, Englewood Cliffs, Ch.
4 (1993)
[9] C.-S. Park, J.-H. Jeon, Y.-H. Kim and Y.-K. Kim, "Display problem on acoustic source identification using beamforming method," Proc. of Inter-Noise 2009, Ottawa, Canada (2009)
[10] C.-S. Park, J.-H. Jeon and J.-H. Park,
"Leakage localization with an acoustic array that covers a wide area for pipeline
leakage monitoring in a closed space,"
Journal of the Korean Society for Nondestructive Testing, Vol. 33, No. 5, pp. 422-429 (2013)
[11] Y. Ohara, H. Endo, T. Mihara and K.
Yamanaka, "Ultrasonic measurement of closed stress corrosion crack depth using sub-harmonic phased array," Japanese Journal of Applied Physics, Vol. 48, 07GD01 (2009)
[12] J. L. Rose, "Ultrasonic Waves in Solid Media," Cambridge University Press, Cambridge, United Kingdom, pp. 44-51 (1999)
[13] C.-S. Park and Y.-H. Kim, "Space domain complex envelopes: definition and a spatial modulation method," Journal of the Acoustical Society of America, Vol. 125, No. 1, pp. 206-211 (2009)
[14] R. C. Gonzalez and R. E. Woods, "Digital Image Processing-2nd Ed.," Prentice-Hall, Inc., New Jersey, USA, Ch. 4 (2001) [15] R. N. Bracewell, "The Fourier Transform
and Its Applications," McGraw-Hill Books Co., Boston, USA, pp. 329-340 (2000) [16] Y. Ohara, H. Endo, Y. Shintaku and K.
Yamanaka, "Monitoring growth of closed fatigue crack using sub-harmonic phased array," Review of Quantitative Nondestruc- tive Evaluation, Vol. 29 (2011)
[17] C. Holmes, B. W. Drinkwater and P. D.
Wilcox, "Post-processing of the full matrix of ultrasonic transmit-receiver array data for non-destructive evaluation," NDT&E International, Vol. 38, No. 8, pp. 701-711 (2005)
Appendix: 2-D spatial Fourier transforms pair
( )
( ,k k z fx y, ; ) ( , , ; )x y z f e j k x k yx y dxdy
∞ ∞ − +
−∞ −∞
= ∫ ∫
P p (A.1)
( )2 ( )
( , , ; ) 1 ( , , ; ) 2
x y
j k x k y
x y x y
x y z f k k z f e dk dk
π
∞ ∞ +
−∞ −∞
= ∫ ∫
p P
(A.2)