환경영향평가의 훼손수목량 추정을 위한 드론영상 분석법과 방형구법의 정확성 비교
박민규 (주)현대이앤씨
Comparison of Accuracy between Analysis Tree Detection in UAV Aerial Image Analysis and Quadrat Method
for Estimating the Number of Trees to be Removed in the Environmental Impact Assessment
Minkyu Park
Hyundai Environment & Consultant Co., LTD
요약 : 환경영향평가의 훼손수목량은 온실가스 배출량, 임목폐기물 산정 등 다양한 부분에 활용되는 환경 지표이다. 지금까지 훼손수목량은 식생조사표의 임목밀도에 의존하였고, 이에 따른 표본편향으로 훼손수 목량 추정의 불확실성이 가중되었다. 훼손수목량 추정의 정확성을 높이려면 전수조사를 대안으로 제시할 수 있으나 불가능한 것이 현실이다. 대안으로 드론영상을 이용한 개별 수목 탐지 방법이 있으며, 이 연구 는 개별 수목 탐지 방법론으로 표본조사(방형구법)와 드론영상 분석법으로 추정된 훼손수목량을 전수조사 결과와 비교하였다. 연구 결과 전수조사 기준으로 드론 영상 분석법은 25주 과대추정 하였고 방형구법(평 균)은 58주 과대 추정하였다. 그러나 기존 환경영향평가에서 시행하는 방형구법은 방형구의 개수, 방형구 의 위치에 따른 표본편향의 영향을 많이 받을 것으로 예상된다.
주요어 : 수목 개체 탐지, 식생, 입목밀도, 임목폐기, 표본조사, 수관높이모형
Abstract: The number of trees to be removed trees (ART) in the environmental impact assessment
is an environmental indicator used in various parts such as greenhouse gas emissions and waste of forest trees calculation. Until now, the ART has depended on the forest tree density of the vegetation survey, and the uncertainty of estimating the amount of removed trees has increased due to the sampling bias. A full-scale survey can be offered as an alternative to improve the accuracy of ART, but the reality is that it is impossible. As an alternative, there is an individual tree detection using aerial image (ITD), and in this study, we compared the ARTs estimated by full-scale survey, sample survey, and ITD. According to the research results, compared to the result of full-scale survey, the result of ITD was overestimated by 25. While 58 were overestimated byResearch Paper
https://doi.org/10.14249/eia.2021.30.3.155
First & Corresponding Author: Minkyu Park, Tel: +82-31-524-2047, E-mail: [email protected], ORCID: 0000-0002-2501-9934
Received: 3 March, 2021. Revised: 13 May, 2021. Accepted: 18 May, 2021.
I. 서론
환경영향평가서의 훼손수목량은 온실가스 흡수 및 배출 평가, 임목폐기물 산정, 훼손지 생태복원을 위 한 가이식 수목량 산정 등 다양한 분야에 연계된 항목 이다(Hwang and Park 2011). 훼손수목량은 토지이 용계획상 훼손지를 대상으로 추정하게 되며 식생평가 를 위해 작성되는 식생조사표의 입목밀도에 의존하고 있다(이 과정을 논문에서는 방형구법으로 정의함).
그러나 환경영향평가 실무에서 식생형마다 하나의 식 생조사표를 취득하기 때문에 소수 표본에 의한 수목량 추정은 표본편향이 발생할 수밖에 없다(Duncanson et al. 2015).
훼손수목량 추정에 사용되는 입목밀도는 산림 생 체량 추정이나 산림 인벤토리 관련 연구에서 중요한 인자이다(Scott et al. 2005; Lei et al. 2009; Gray et al. 2012; Tomppo et al. 2014). 이에 따라 방형 구의 모양, 크기에 따라 수목량 추정의 불확실성에 대 한 연구도 다양하게 진행되었다(Comas et al. 2011;
McRoberts et al. 2015; Paul et al. 2019). 이러한 연구들의 목적은 산림인벤토리나 생체량 추정의 정확 성 향상을 목적으로 한다. 반면에 국내 방형구에 관 한 논의는 부족하다. 방형구 모양이나 크기에 대한 연 구가 미진하며 관례적으로 사각형의 10m×10m 또는 20m×20m 방형구를 사용한다. 물론 식물사회학구 조를 위한 방형구라면 상관 없지만, 밀도 추정을 위 한 방형구라면 면적대비 방형구 개수, 면적 등에 관 한 연구가 필요할 것이다(Paul et al. 2019).
훼손수목량 추정의 정확성을 향상시키기 위해서는 전수조사가 대안이나 환경영향평가 실무 체계에서 물 리적, 시간적으로 불가능하며, 이 연구에서는 드론 영상 분석을 통한 수목 탐지(이하 드론영상 분석법) 를 대안으로 제시하고자 한다.
드론영상 분석법에서 수목량을 산정하는 기본 개 념을 개별수목탐지(Individual tree detection)라고 한다(Pitkänen et al. 2004). 개별 수목 탐지는 주로 산림 인벤토리를 위해 개발된 방법론으로 최초 항공 라이다에서 취득한 점군(Point cloud) 분석으로 시작 되었고(Wang et al. 2008; Li et al. 2012; Wallace et al. 2014; Itakura and Hosoi 2018), 드론 영상 을 이용한 사진측량 기술이 발달하면서 드론 영상만 으로 개별 수목 탐지에 충분한 자료를 확보할 수 있게 되었다(Mohan et al. 2017; Fujimoto et al. 2019;
Quiroz et al. 2019; Selim et al. 2019; Kentsch et al. 2020).
이 연구는 환경영향평가 실무에서 항공촬영용으로 활용하고 있는 상업용 드론을 활용하고 개별 수목 탐 지 알고리듬을 적용하여 특정 구역의 수목 탐지 가능 성과 정확성을 측정하고 실제 환경영향평가에서 적용 하는 방형구법으로 추정한 수목량과 비교하였다. 이 연구를 통해 환경영향평가의 방형구법에 의한 훼손수 목량 추정의 부정확성과 이를 개선하기 위한 계기가 마련되기를 바란다.
II. 연구방법
1. 연구지역
이 연구는 드론영상 분석을 위한 예비연구로 다음 조건을 만족하는 대상지를 선정하였다.
1) 정확도 비교를 위해 수목량 전수조사가 가능한 지역
2) 단일 수종이 우점하여 수종별 형태에 따른 탐색 변이 발생 가능성이 낮은 지역.
이러한 조건을 만족하는 지역으로 충청남도 태안 군 원북면 신두리 일대의 방풍림을 선정하였고 면
the sample survey (average). However, as the sample survey is an estimate based on random samples, ART will be overestimated or underestimated depending on the number and size of quadrats.Keywords: Individual tree detection, Vegetation, Tree density, Waste of forest trees, Sampling, Canopy height model
적은 7,056m
2, 식생의 상관 우점종은 곰솔(Pinus thunbergii)이다(Figure 1).
2. 드론영상 촬영 및 전처리
이 연구를 위해 사용한 드론은 DJI Mavic Pro2
TM이며, 정사영상 및 DSM 분석을 위한 자동비행 시스템 은 Pix4dcpature
TM를 사용하였다. 촬영은 고도 60m, 종횡중복도 80%, GSD(Ground Sample Distance) 2.5cm 조건으로 233장의 영상을 취득하였다(촬영시 기는 2020년 5월 26일). 취득된 영상은 오픈드론맵 (Toffanin, 2019)을 이용하여 정사영상(Orthophoto) 과 수치표면모델(Digital surface model, 이하 DSM) 을 생성하였다(Figure 1).
3. 수목량 측정
수목량 추정 방법에 따른 정확성 비교를 위해 환경 영향평가에서 활용하고 있는 방형구법과 본 연구에서 시도한 드론 영상 분석법을 비교하였으며, 정확성 기
준이 필요하기 때문에 전수조사를 통해 연구지역의 총 수목량을 확인하였다. 전수조사를 통해 확인한 수 목량은 682주였으며, 모두 곰솔이었다.
방형구법에 의한 수목량 추정은 연구지역에 30개 방형구(Quadrat, 10m×10m)에서 입목밀도를 조사 하고 (식 1)으로 수목량을 추정하였다(Figure 1의 A).
방형구 개수를 30개로 정한 이유는 중심극한정리 (Central limit theorem)에 따른 최소 표본수를 반영 한 것이다(Chang et al. 2006a).
EvT = × DT (식 1) Where:
EvT = Estimated number of trees in the analysis area TA = Area of estimated area
QA = Quadrat area
DT = Number of trees in the quadrat
4. 드론영상을 이용한 수목량 분석
드론영상을 이용한 수목량 분석은 수목 개체탐지 QA TA
Figure 1. Orthophoto (A) and DSM (B) of the study area. In the orthophoto, a plot (quadrat) for estimated number of trees was marked.
(A) (B)
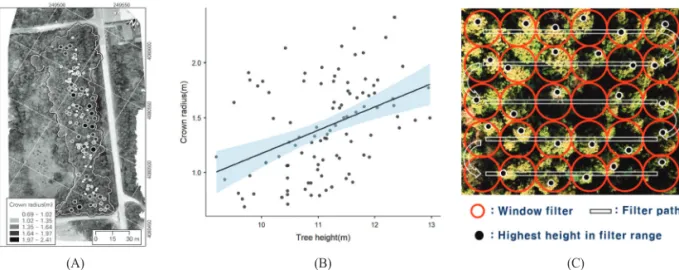
에 자주 사용하는 임관높이모형(Canopy Height Model, 이하 CHM)의 가변 윈도우 크기(Variable Window Size, 이하 VWS)를 활용하였다(Popescu and Wynne 2004). VWS는 CHM에 서 수 관 폭 (Crown)과 CHM 최고값을 이용한 선형 회귀식으로 수목탐지(Tree detecting)를 위한 함수로 활용된다 (Figure 2의 C). 이 연구에서는 정사영상을 육안 판 독하여 무작위로 100개의 수관폭을 생성(Figure 2의 A)하고 VWS 회귀식(Figure 2의 B)을 결정하였다.
분석지역은 경사가 없는 평지이기 때문에 VWS에 필요한 CHM은 DSM을 그대로 사용하였으며 CHM에 서 VWS는 R(R Core Team 2020) 환경에서 Forest Tools package(Plowright and Roussel 2020)로 구 현하였다.
5. 수목량 정확성 비교
수목량 추정의 정확성 비교는 절대 비교치인 전수 조사 결과(곰솔 682주)를 기준으로 하였다. 드론영상 분석은 VWS 알고리듬에서 예측한 분류결과를 오차 행렬(Confusion Matrix)로 분석하고 실제 수목을 수목으로 분류한 정밀도(Precision)를 평가하였다
(Powers 2008). 오차행렬과 정밀도는 MLmetrics package(Yachen 2016)로 분석하였고, 30개의 방형 구에서 추정된 수목량은 상자그림(boxplot)으로 분석 하였다.
III. 결과
1. 방형구법에 의한 수목량 추정
환경영형평가의 훼손수목량 추정은 식생조사표의 교목층 입목밀도를 기준으로 한다. 이 기준에 따라 30개 방형구의 입목밀도를 조사한 결과 평균 입목 밀 도는 10.5주, 최고 18.0주, 최소 4.0주였으며, 표본표 준편차는 3.40으로 나타났다.
입목밀도를 기준으로 수목량을 추정한 결과 평균 740.40주, 최고 1,270주, 최소 282주로 나타났으며 표본표준편차가 240.01이었다. 입목밀도가 균질하지 않기 때문에 수목량 추정량도 편차가 큰 것을 알 수 있었다(Table 1). 따라서 기존 환경영향평가에서 시행 하는 방형구법에 따른 훼손수목량은 방형구의 위치, 개수에 따라 훼손수목량 추정치의 편차가 클 것으로 판단된다.
Figure 2. Linear regression of crown radius and tree height for VWS.
(A) (B) (C)
Table 1. Descriptive statistics of the number of trees estimated by the quadrat method.
Item Mean Median Max Min Standard deviation
Number of trees in the quadrat 10.50 10.50 18.00 4.00 3.40
Number of trees 740.40 740.50 1270.00 282.00 240.01
Figure 3. The result of detection trees using aerial image.
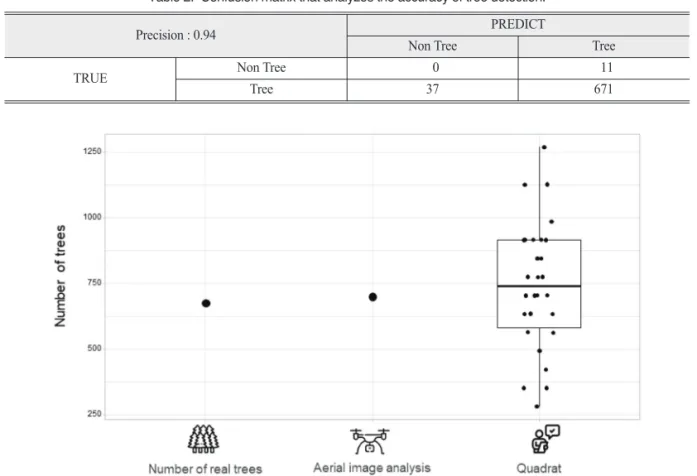
Table 2. Confusion matrix that analyzes the accuracy of tree detection.
Precision : 0.94 PREDICT
Non Tree Tree
TRUE Non Tree 0 11
Tree 37 671
Figure 4. Results of comparing the number of trees by three analysis methods.
2. 드론영상 분석에 의한 수목량 및 정확성
VWS을 이용하여 수목 최고점(tree tops)과 수목 경계(Crown)를 분석한 결과는 Figure 3과 같으며, 탐지된 수목은 707주로 나타났다. 정밀도(Precision) 는 0.94였으며 수목이 분포하지 않지만 수목으로 탐 지한 것은 707건 중 11건, 37건은 수목임에도 수목으 로 탐지하지 못하였다(Table 2).
3. 수목량 비교
드론영상 분석법, 방형구법으로 추정된 수목량을 전수조사와 비교한 결과 전수조사 결과는 682주였 으며, 드론영상분석을 통한 수목량은 707주로 전수 조사 결과보다 25주 과대 추정하였다. 반면 방형구법 의 평균 수목량은 740.40으로 전수조사 결과보다 약 58주 과대 추정하였다(Figure 4). 그러나 일반적으로 환경영향평가에서 식생조사는 양호한 식생을 대상으 로 하며, 양호한 식생은 입목밀도가 상대적으로 높은 지역을 선정하게 된다. 또한 환경영향평가에서 하나 의 식생에서 하나의 식생조사표를 취득하기 때문에 이러한 조건에 의하여 환경영향평가서의 훼손수목량 은 과대 추정할 것으로 예상된다.
IV. 고찰
드론 영상이나 항공 라이다(LiDAR)를 이용한 수목 탐지 기술은 15년 전부터 다양한 분야에 활용되고 있 다. 특히 국내에서는 수목개체 및 수고측정, 가로수 정보 추출, 도시지역의 변화탐지 등 산림이나 도시 공 간정보 분석에 활용되고 있다(Chang et al. 2006b;
Choi and Lee 2008; Cho and Kim 2012; Hwang et al. 2012; Yan et al. 2015).
국내에 선행연구가 고가 장비인 라이다를 이용하 는 경우가 많아 실제 환경영형평가에서 적용할 수 없 는 한계가 있으나 수목 개체 탐지가 목적인 경우 상업 용 드론 영상에서 취득한 CHM, DSM으로 충분한 결 과를 도출할 수 있다(Ni et al. 2015).
선행연구에서 개별 수목탐지의 정확성을 다양한 방법으로 측정하였기에 이 연구와 직접적으로 비교할 수 없으나 평균적으로 80% 이상의 정확도를 보였고
(Wallace et al. 2014; Birdal et al. 2017; Mohan et al. 2017; Wu et al. 2019), 본 연구에서도 정밀도 (실제 수목을 수목으로 탐지한 비율)가 90% 이상으로 높은 정확성을 보였다. 다만 이 연구가 환경영향평가 적용을 위한 예비 연구로 평지, 단일수종 식생을 대 상으로 했기 때문에 혼효림, 활엽수 그리고 다양한 경 사를 적용한 후속 연구가 필요하다. 이 연구에서 VWS 알고리듬을 적용한 이유도 산림식생을 구성하 는 수종 및 경사에 따른 수관폭의 변화를 적용하기 위 함이었다.
무엇보다 중요한 것은 환경영향평가에서 적용하는 방형구법으로는 수목량 추정에 한계가 있다는 것을 실험적으로 증명한 것이다. 현실적으로 수목량 추정 을 위한 다표본을 확보하지 못한다면, 훼손수목량은 실제보다 과소 또는 과대 추정된다. 따라서 드론 영 상분석법을 발전시켜 환경영향평가에 적용하는 것이 환경영향평가의 정확성 및 실효성을 위해서도 바람직 한 과정일 것이다.
또한 딥러닝, 머신러닝 등의 기술발달로 항공영상 에서 수목 개체 탐지 및 수종 탐지까지 가능하기 때문 에 드론영상을 활용한 생태조사 및 분석에 활용할 수 있다(Morales et al. 2018; Safonova et al. 2019)
최근 환경부에서 추진하고 있는 환경영향평가의 건 축정보모델(Building Information Modeling, BIM), 디지털 트윈(Digital Twin)에도 드론영상을 활용한 기술(KEI 2019)이 적용되고 있으므로 환경영향평가 실무에서도 드론을 단순촬영용이 아니라 다방면의 분 석을 위해 활용할 필요가 있다.
V. 결론
환경영향평가의 훼손수목량 추정을 위한 입목밀도 조사결과는 온실가스 흡수원 평가, 생태복원을 위한 이식 수목량 결정, 임목폐기물량 산정 등 다양한 부 분에 연계된 항목이다. 그러나 환경영향평가의 훼손 수목량은 식생 평가를 위해 작성된 식생조사표의 입 목밀도를 기준으로 추정되기 때문에 과대 또는 과소 추정될 수밖에 없다.
본 연구에서 적용한 드론영상 분석법의 결과는 실제
수목량과 유사하고 방형구법의 표본편향을 회피하며, 전수조사를 대체할 수 있는 장점이 있다. 또한 대부 분의 환경영향평가 용역사가 드론을 운용하기 때문에 기존의 장비를 활용할 수 있고, 분석에 사용된 프로 그램이 오픈 소스(Open source)이기 때문에 프로그 램 구매에 대한 부담도 없다.
그러나, 상관 우점종 및 지형 경사 다양성에 의한 VWS가 달라져야 하는 것이 본 연구의 한계성이며 산림 상관(침엽수, 활엽수, 침활혼효림) 및 지형 경사 에 따른 다양한 VWS 회귀식에 관한 후속 연구가 필 요하다.
또한 본 연구 방법론을 수행할 수 있는 GIS 프로그 램의 도구상자(Toolbox) 또는 독자적(Stand-alone) 프로그램을 개발한다면 환경영향평가 실무에 활용 가 능할 것으로 판단된다.
References
Birdal AC, Avdan U, Türk T. 2017. Estimating tree heights with images from an unmanned aerial vehicle. Geomatics, Natural Hazards and Risk 8: 1144-1156.
Chang H, Huang K, Wu C. 2006a. Determination of sample size in using central limit theorem for weibull distribution. International Journal of Information and Management Sciences 17: 31. [Korean Literature]
Chang AJ, Kim YI, Lee BK, Yu KY. 2006b.
Estimation of individual tree and tree height using color aerial photograph and LiDAR data. Korean Journal of Remote Sensing 22: 543-551. [Korean Literature]
Cho DY, Kim EM. 2012. Extraction of street tree Information using airborne LiDAR data.
Spatial Information Research 20: 45-57.
[Korean Literature]
Choi KA, Lee IP. 2008. Automatic change detection of urban areas using LIDAR data. Journal
of the Korean Society of Surveying, Geodesy, Photogrammetry and Cartography 26: 341- 350. [Korean Literature]
Comas C, Mateu J, Delicado P. 2011. On tree intensity estimation for forest inventories:
Some statistical issues. Biometrical Journal 53: 994-1010.
Duncanson L, Rourke O, Dubayah R. 2015. Small Sample Sizes Yield Biased Allometric Equations in Temperate Forests. Scientific Reports 5: 17153.
Fujimoto A, Haga C, Matsui T, Machimura T, Hayashi K, Sugita S, Takagi H. 2019. An end to end process development for UAV- SfM based forest monitoring: Individual tree detection, species classification and carbon dynamics simulation. Forests 10:
680.
Gray AN, Brandeis TJ, Shaw JD, McWilliams WH, Miles P. 2012. Forest inventory and analysis database of the United States of America (FIA). In: Dengler J, Oldeland J, Jansen F, Chytry M, Ewald J, Finckh M, Glockler F, Lopez-Gonzalez G, Peet RK, Schaminee J, HJ, editors. Vegetation databases for the 21st century. Biodiversity and Ecology 4: 225-231.
Hwang SR, Lee MJ, Lee IP. 2012. Detection of Individual Trees and Estimation of Mean Tree Height using Airborne LIDAR Data.
Spatial Information Research 20: 27-38.
[Korean Literature]
Hwang SI, Park SH. 2011. A Comparative Study on Estimation Methodologies of Carbon Sequestration Amount by Vegetation for Environmental Impact Assessment on Development Projects. Journal of Environmental Impact Assessment 20:
477-487. [Korean Literature]
Itakura K, Hosoi F. 2018. Automatic individual tree detection and canopy segmentation from three-dimensional point cloud images obtained from ground-based lidar. Journal of Agricultural Meteorology 74: 109-113.
Kentsch S, Lopez Caceres ML, Serrano D, Roure F, Diez Y. 2020. Computer vision and deep learning techniques for the analysis of drone-acquired forest images, a transfer learning study. Remote Sensing 12: 1287.
KEI. 2019. Reviewing Feasibility of Applying of Drones and BIM in Environment Impact Assessment. Korea Environment Institute.
Lei XD, Tang MP, Lu YC, Hong LX, Tian DL.
2009. Forest inventory in China: status and challenges. International Forestry Review 11: 52-63.
Li W, Guo Q, Jakubowski MK, Kelly M. 2012.
A new method for segmenting individual trees from the lidar point cloud.
Photogrammetric Engineering & Remote Sensing 78: 75-84.
McRoberts RE, Tomppo EO, Czaplewski RL.
2015. Sampling designs for national forest assessments. Knowledge Reference for National Forest Assessments; FAO: Rome, Italy, 23-40.
Morales G, Kemper G, Sevillano G, Arteaga D, Ortega I, Telles J. 2018. Automatic segmentation of Mauritia flexuosa in unmanned aerial vehicle (UAV) imagery using deep learning. Forests 9: 736.
Mohan M, Silva CA, Klauberg C, Jat P, Catts G, Cardil A, Hudak AT, Dia M. 2017.
Individual tree detection from unmanned aerial vehicle (UAV) derived canopy height model in an open canopy mixed conifer forest. Forests 8: 340.
Ni W, Liu J, Zhang Z, Sun G, Yang A. 2015.
Evaluation of UAV-based forest inventory system compared with LiDAR data. In 2015 IEEE International Geoscience and Remote Sensing Symposium (IGARSS), pp. 3874-3877.
Paul TSH, Kimberley MO, Beets PN. 2019.
Thinking outside the square: Evidence that plot shape and layout in forest inventories can bias estimates of stand metrics. Methods in Ecology and Evolution 10: 381-388.
Pitkänen J, Maltamo M, Hyyppä J, Yu X. 2004.
Adaptive methods for individual tree detection on airborne laser based canopy height model. International Archives of Photogrammetry, Remote Sensing and Spatial Information Sciences 36: 187-191.
Plowright A, Roussel JR. 2020. ForestTools:
Analyzing Remotely Sensed Forest Data. R package version 0.2.1. https://CRAN.R- project.org/package=ForestTools.
Popescu SC, Wynne RH. 2004. Seeing the Trees in the Forest. Photogrammetric Engineering
& Remote Sensing 70: 589-604.
Powers D. 2008. Evaluation: From Precision, Recall and F-Factor to ROC, Informedness, Markedness & Correlation. Mach. Learn.
Technol. 2.
Quiroz RAA, Guidotti FP, Bedoya AE. 2019.
A method for automatic identification of crop lines in drone images from a mango tree plantation using segmentation over YCrCb color space and Hough transform.
In 2019 XXII Symposium on Image, Signal Processing and Artificial Vision (STSIVA), pp. 1-5.
R Core Team. 2020. R: A language and environment for statistical computing. R Foundation for Statistical Computing, Vienna, Austria. URL https://www.R-
project.org/.
Safonova A, Tabik S, Alcaraz-Segura D, Rubtsov A, Maglinets Y, Herrera F. 2019. Detection of fir trees (Abies sibirica) damaged by the bark beetle in unmanned aerial vehicle images with deep learning. Remote Sensing 11: 643.
Scott CT, Bechtold WA, Reams GA, Smith WD, Westfall JA, Hansen MH, Moisen GG.
2005. Sample-based estimators used by the forest inventory and analysis national information management system. Gen.
Tech. Rep. SRS-80. Asheville, NC: US Department of Agriculture, Forest Service, Southern Research Station, pp. 53-77.
Selim S, Sonmez NK, Coslu M, Onur I. 2019.
Semi-automatic tree detection from images of unmanned aerial vehicle using object- based image analysis method. Journal of the Indian Society of Remote Sensing 47:
193-200.
Toffanin P. 2019. OpenDroneMap: The Missing Guide (1st ed.)
Tomppo E, Malimbwi R, Katila M, Mäkisara K, Henttonen HM, Chamuya N, Zahabu E, Otieno J. 2014. A sampling design for a large area forest inventory: case Tanzania.
Canadian Journal of Forest Research 44:
931-948.
Wallace L, Lucieer A, Watson CS. 2014. Evaluating tree detection and segmentation routines on very high resolution UAV LiDAR data.
IEEE Transactions on Geoscience and Remote Sensing 52: 7619-7628.
Wang Y, Weinacker H, Koch B. 2008. A lidar point cloud based procedure for vertical canopy structure analysis and 3D single tree modelling in forest. Sensors 8: 3938- 3951.
Wu X, Shen X, Cao L, Wang G, Cao F. 2019.
Assessment of individual tree detection and canopy cover estimation using unmanned aerial vehicle based light detection and ranging (UAV-LiDAR) data in planted forests. Remote Sensing 11: 908.
Yachen Y. 2016. MLmetrics: Machine Learning Evaluation Metrics. R package version 1.1.1. https://CRAN.R-project.org/package
=MLmetrics.
Yan WY, Shaker A, El-Ashmawy N. 2015. Urban land cover classification using airborne LiDAR data: A review. Remote Sensing of Environment 158: 295-310.