Print ISSN: 2288-4637 / Online ISSN 2288-4645 doi:10.13106/jafeb.2021.vol8.no3.0139
The Role of Remittances in Financial Development: Evidence from Nonlinear ARDL and Asymmetric Causality*
Ahmed Muneeb MEHTA1, Md. QAMRUZZAMAN2, Ayesha SERFRAZ3, Asad ALI4
Received: November 20, 2020 Revised: January 25, 2021 Accepted: February 03, 2021
Abstract
This study’s impetus is to explore fresh evidence to answer the question, i.e., whether remittances asymmetrically influence financial development in Bangladesh from 1975 to 2019. The study employs several tests, i.e., nonlinear unit root test, Autoregressive Distributed Lagged (ARDL), NARDL, and asymmetric causality test for establishing the pattern of association. Nonlinear unit root tests confirm that variables follow a nonlinear system of being stationary after the first difference. nonlinearity among variables is investigated by performing the BDS test and nonlinear OLS. Directional causality is investigated through both linear and nonlinear effects of remittance inflows by following the non-granger casualty test. The test statistics of Fpass and tBDM showed the Long-run cointegration in the empirical model and positive effect running from remittances inflow to financial development both in the long-run and short-run. Furthermore, the results of a standard Wald test divulge the presence of long-run and short-run asymmetry. Asymmetry causality test established unidirectional causality due to positive and negative shocks in remittances inflows to Bank-based financial development and feedback hypothesis hold for explaining causality between positive and negative shocks in remittance inflows and Stock-based financial development.
Keywords: Remittances, Financial Development, ARDL, NARDL, Asymmetry Causality JEL Classification Code: C32, F24, G00
Remittance flows have grown in the world economy over the longer-term as the scale of migration between countries has grown. Remittances were once viewed by many economists as a secondary issue for developing economies behind FDI and equity investments. Yet because of their sheer volume and consistent and resilient nature, these flows are now the most important when it comes to financing development.
The positive impact of remittances on financial development in developing countries fosters long-run growth and reduces poverty. With financial development, remittances are becoming more common across countries and can be a source of economic development. There is a positive and significant link between financial development and remittances. According to Posso (2015), remittances inflow from developed to developing countries provide liquidity for the domestic financial institutions that aid in the financial development process. As such, strengthening financial institutions in developing countries is needed.
Remittance inflow in the financial system allows financial institutions to provide liquidity to the economy and permit a higher level of economic activity than would otherwise be possible (Ambrosius & Cuecuecha, 2016). Financial institutions offer financial services to remittance recipients’
by offering innovative financial products and services.
1. Introduction
Remittances are the second-largest source of foreign capital flow in the economy. Remittances are transfers of money across national boundaries by migrant workers.
*Acknowledgements:
[1] Funding: no financial assistance received from any organization and person
[2] The author confirms no conflict of interest
1 First Author. Assistant Professor, Hailey College of Banking and Finance, University of the Punjab, Lahore, Pakistan [Postal Address:
Canal Road, Quaid-i-Azam Campus, Lahore, Punjab, Pakistan]
Email: [email protected]
2 Corresponding Author. Associate Professor, School of Business and Economics, United International University, Bangladesh [Postal Address: Madani Avenue, United City, Dhaka, 1212, Bangladesh]
Email: [email protected] ; [email protected]
3 Assistant Professor, Institute of Administrative Sciences, University of the Punjab, Lahore, Pakistan. Email: [email protected]
4 Hailey College of Banking and Finance, University of the Punjab, Lahore, Pakistan. Email: [email protected]
© Copyright: The Author(s)
This is an Open Access article distributed under the terms of the Creative Commons Attribution Non-Commercial License (https://creativecommons.org/licenses/by-nc/4.0/) which permits unrestricted non-commercial use, distribution, and reproduction in any medium, provided the original work is properly cited.
Financial institutions, especially bank-based institutions, can predominantly expand their services in areas where most remittance recipients are located. Remittances provide a key source of foreign savings for low-income countries.
According to Orozco (2009), remittance is one way to expand domestic capital accumulation by encouraging saving propensity with innovative investment opportunities
According to Acosta et al. (2009), for developing countries, remittances are an important and expanding source of capital, equivalent to two-thirds of overall foreign direct investment (FDI) and nearly 2 percent of gross domestic product (GDP). As a developing nation, for Bangladesh, remittance is one of the most important economic variables in recent times as it helps in balancing the balance of payments, increasing foreign exchange reserves, enhancing national savings, and increasing the velocity of money. For about two decades remittance has been contributing around 35%
of export earnings (Buchenau, 2008; Hatemi & Uddin, 2014;
Traverso, 2016). Bangladesh, the eighth biggest remittance recipient country in the world, relies on such inflows to drive consumer spending, which accounts for nearly 80 percent of domestic GDP (Pradhan & Khan, 2015; Raihan et al., 2009). Moreover, remittance has an effective role in rural infrastructural development. The migrant workers, who send money from foreign countries, are accelerating economic growth and development (Al Mamun et al., 2016).
Thus, remittance has been turned into the second largest financial inflow to our country. (Khan & Islam, 2013;
Masuduzzaman, 2014).
However, a growing number of researchers investigated the nexus between remittance-led financial development considering time series and panel data from the empirical perspective. But, little evidence is available pertinent to remittance-led financial development in Bangladesh.
This study’s motivation lies in assessing the future effects of remittance on the financial sector in Bangladesh under a nonlinear environment. The effects of positive and negative shocks will be addressed and their possible magnitudes as well. The empirical investigation performed several nonlinear econometric tests for assessing the nexus. First, over the conventional stationarity test, this study performed a nonlinear unit root test following Kruse (2011) and Kapetanios et al. (2006). Second, nonlinearity among variables is investigated by performing the BDS test proposed by Brock et al. (1987) and nonlinear OLS.
Third, the long-run asymmetric relationship is investigated by following nonlinear ARDL proposed by Shin et al.
(2014). Third, directional causality is investigated through both linear and nonlinear effects of remittance inflows by following the non-granger casualty test proposed by Toda and Yamamoto (1995).
The study findings are: research variables follow a nonlinear stationary process. Furthermore, the nonlinearity
test following Nonlinear OLS and BDS test statistics ascertain the nonlinear relationship between remittance inflows and financial development. Considering linear and nonlinear investigation, study findings established a long–
run association between remittance inflows and financial development. [REM+ ¨ SMD; REMР¨ SMD] and composite financial development index [REM+ ¨
Furthermore, the results of a standard Wald test divulge the presence of long-run and short-run asymmetry. Asymmetry causality test established unidirectional causality due to positive and negative shocks in remittances inflows to bank–based financial development [REM+ ¬® BSD;
REM– ¬® BSD] and feedback hypothesis hold for explaining causality between positive and negative shocks in remittance inflows and Stock–based financial development FD;
REMР¨ FD].
The structure of the paper follows apart from Section 1, dealing with the Background of the study. Section 2 exhibits a survey of pertinent literature. Detailed variable definitions and econometric methodology are explained in Section 3. Section 4 contains the empirical model result and interpretation, and finally, the conclusion is reported in Section 5.
2. Literature Review
2.1. Remittance and Financial Development Empirical literature focusing on remittance-led financial development did not establish conclusive evidence and had different outcomes. This was due to differences in data composition, sample selection, and application of different econometric tools. The first body of the literature examines the link between financial sector development and economic growth. In this regard, all evidence supports the “supply- lending hypothesis” that is a unidirectional causality running from remittance inflows to financial development.
The supply-leading hypothesis suggests that causality flows from finance to economic growth with no feedback response from economic growth. A well-developed financial sector is a pre-condition for economic growth (Chowdhury, 2011; Demirguc-Kunt & Peria, 2010; Esteves & Khoudour- Castéras, 2011; Fayissa & Nsiah, 2012; Fromentin, 2017;
Gupta et al., 2009; Shahzad et al., 2014). These findings suggested that remittance assists in financial development in multifold ways. First, remittance’s transaction fee is a significant source of income for commercial banks and its motive to open branches in the rural area (since most remittance recipients are from rural areas). Second, migrants’
families have excess cash for a while, so they need banking service for mostly deposits since banks offer those families a safe place for storing this temporary excess cash. Third, finical institutions act as financial intermediaries who move
funds from parties with excess capital to parties needing funds, especially those excluded from the formal financial system. Offering remittance services to people who do not have a bank account creates the opportunity to offer them financial services and products and include them in the formal channel. Fourth, migrant families’ deposits might reduce the need for external financing by financial institutions. As a result, getting a loan might be easier for people in developing countries. Fifth, banks can gather information on recipient households’ income through processing remittances flow (Lee & Zhao, 2014).
In contrast to the “supply-lending view,” several empirical studies established a “demand lending hypothesis”
that is the country’s financial development encourage inflows of remittance in the economy see, for instance (Faheem et al., 2019) (Posso, 2015). Faheem et al. (2019) investigated the effects of financial development on remittance inflows in Pakistan by applying ARDL and nonlinear ARDL of 1976–2018. Study findings unveiled the asymmetry relationship between remittance and financial development and significant effects on remittance inflows from financial development. Furthermore, Nguyen (2020) and Posso (2015) found that microfinance stimulates migrants’ remittance.
This is perhaps the presence of microfinance institutions that allow easy access to financial services and substantially reduce transaction costs.
The second line of thought available regarding the remittance-financial development nexus is a negative association. Calderon et al. (2007) established an inverse relationship between the growth of remittance and financial depth in Latin America. Brown et al. (2013) showed neutral effects running from remittance inflows to financial development, that is, inflows of remittance do not influence the financial sector of the country (Abdul Majeed, 2019; Motelle, 2011; Coulibaly, 2015;
Chowdhury (2016).
2.2. Remittance and Bangladesh Economy
Many studies have been conducted to assess the micro and macro economy remittance impact on developing nations. Ahmed and Uddin (2009) assessed the potential influence of remittance on economic growth. They established that remittance accelerates economic growth by promoting export, especially in the short-run. Siddique et al. (2012) investigated the causal link between remittances and economic growth in three countries, Bangladesh, India, and Sri Lanka, by employing the Granger causality test under a Vector Autoregression (VAR) framework. Using time-series data over a 25 year period, they found that growth in remittances does lead to economic growth in Bangladesh. Hasan et al. (2019) advocated that remittance induces economic growth, promoting industrial output;
nonetheless, adverse consequences are also experienced by the economy, such as brain drain and social inequality in the rural area.
Muktadir-Al-Mukit et al. (2013) investigates the relationship between remittance and import for Bangladesh.
The study used different econometric techniques for measuring the long and short-term relationships between variables.
The Johansen Cointegration test is used to determine the existence of long term relationships between study variables. The normalized Cointegrating coefficients are found statistically significant and show a stable and positive relationship between study variables. Our Granger causality analysis suggests the existence of unidirectional causality running from import to remittance. This confirms that remittances have no significant impact on the demand for imported goods rather import exerts a positive shock on the remittance of Bangladesh.
Masuduzzaman (2014) analyzed the role of remittance on economic growth and to investigate the interaction of remittance with the financed development of Bangladesh using annual data, relatively liberalized regime spanning from 1981 to 2013. This study employed the mostly used Johansen co-integration test along with the vector error correction model to reveal both the short-run and the long-run association between remittance-growth and remittance-financed development. Granger Causality tests are also used to explore the possible endogenous relationship between remittance-growth and remittance- financed development. This study found a long-run positive relationship between inflow of remittance and gross domestic products (GDP) indicating that remittance will be more likely to contribute to longer-term growth in Bangladesh. It is also revealed that remittances have a significant positive effect on financial development. Therefore, this study posits that the inflow of workers’ remittance matters for countries like Bangladesh, which has a relatively growing economy and a developing financial sector.
Pradhan and Khan (2015) analyzed the contribution of remittance earning on the quality of life in Bangladesh.
For the quality of life, the HDI index, an extensively accepted index consisting of income, education and life expectancy, is used. This study covers the data for HDI and remittance earnings from 1981 to 2011. The study employed the VEC (Vector Error Correction) model to analyze the desired relation between the variables. The estimated result shows the long-run causality running from remittance to HDI. This result implies that the remittance influences the quality of living in long run. To improve the quality of life, the government has the better choice to emphasize on the bottom level people for emigration after suitable training so that they can earn more; consequently, send more remittances to their home country.
3. Methodology 3.1. Variable Definition
In the empirical literature, it is advocated that financial development is such a broader aspect; therefore, using a single proxy may not reflect the real situation. Hence, in this study, financial development effects are investigated by considering both bank-based financial development and market based financial development.
Several proxy variables were used in measuring bank- based financial sector development. Bank-based financial development is the outcome of several intricate and
interrelated processes and activities. Therefore, capturing meaningful insights with a single proxy might not be useful due to complicated process involvement (Abu-Bader &
Abu-Qarn, 2008). Therefore, following Pradhan et al. (2014), in this study, bank-based financial development is measured by constructing an index considering a widely used proxy.
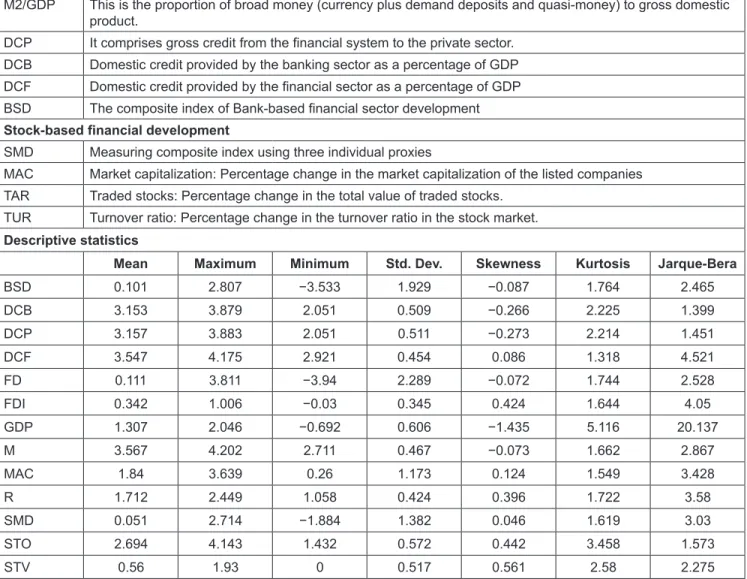
The principal components analysis (PCA) technique is used for constructing the financial development index. PCA is a dimensionality-reduction method that is often used to reduce the dimensionality of large data sets, by transforming a large set of variables into a smaller one that still contains most of the information in the large set. The definition of bank-based financial development is exhibited in Table 1.
Table 1: Definition of Variables and Descriptive Statistics Bank-based Financial development
M2/GDP This is the proportion of broad money (currency plus demand deposits and quasi-money) to gross domestic product.
DCP It comprises gross credit from the financial system to the private sector.
DCB Domestic credit provided by the banking sector as a percentage of GDP DCF Domestic credit provided by the financial sector as a percentage of GDP BSD The composite index of Bank-based financial sector development Stock-based financial development
SMD Measuring composite index using three individual proxies
MAC Market capitalization: Percentage change in the market capitalization of the listed companies TAR Traded stocks: Percentage change in the total value of traded stocks.
TUR Turnover ratio: Percentage change in the turnover ratio in the stock market.
Descriptive statistics
Mean Maximum Minimum Std. Dev. Skewness Kurtosis Jarque-Bera
BSD 0.101 2.807 −3.533 1.929 −0.087 1.764 2.465
DCB 3.153 3.879 2.051 0.509 −0.266 2.225 1.399
DCP 3.157 3.883 2.051 0.511 −0.273 2.214 1.451
DCF 3.547 4.175 2.921 0.454 0.086 1.318 4.521
FD 0.111 3.811 −3.94 2.289 −0.072 1.744 2.528
FDI 0.342 1.006 −0.03 0.345 0.424 1.644 4.05
GDP 1.307 2.046 −0.692 0.606 −1.435 5.116 20.137
M 3.567 4.202 2.711 0.467 −0.073 1.662 2.867
MAC 1.84 3.639 0.26 1.173 0.124 1.549 3.428
R 1.712 2.449 1.058 0.424 0.396 1.722 3.58
SMD 0.051 2.714 −1.884 1.382 0.046 1.619 3.03
STO 2.694 4.143 1.432 0.572 0.442 3.458 1.573
STV 0.56 1.93 0 0.517 0.561 2.58 2.275
The stock market is an indicator of an economy’s financial health. It indicates the mood of investors in a country.
As such, stock market development is an important ingredient for growth. The interplay between the stock market and the real economy is crucial in the various channels through which financial markets drive economic growth. It is not impossible to do so using a single indicator. Empirical literature shows three common indicators widely used by researchers, (Adjasi & Biekpe, 2006; Nyasha & Odhiambo, 2016;
Qamruzzaman & Wei, 2018). The present study also deploys commonly used three indicators. The first indicator is the stock market size is measured by stock market capitalization, and in empirical studies, it has appeared that risk diversification opportunity is positively linked to market size. Hence, the effect of market size on stock market development is imminent. The second indicator is the proxy measuring the relationship trading impact on market size, captured by the total value of stock trade in the market.
The third indicator is the state of liquidity concern, i.e., measured by turnover ratio. The definition of stock market-based financial development is exhibited in Table 1.
Finally, the comprehensive financial development index is prepared by considering all the proxy indicators, including bank-based financial development and stock-based financial development. The motivation for constructing this comprehensive index is to construct a composite financial development index (Ang, 2009; Batuo et al., 2010;
Bong & Premaratne, 2019; Mendoza et al., 2009; Menyah et al., 2014; Qamruzzaman & Wei, 2019; Sobiech, 2019).
3.2. Estimation Techniques
In the study, we perform several econometric techniques for unveiling certain types of information. Investigating variables in the order of integration, we applied both traditional unit root tests, namely, the ADF test introduced by Dickey and Fuller (1979), the P-P test familiarized by Phillips and Perron (1988), and the KPSS test projected by Kwiatkowski et al. (1992). Furthermore, we followed Galadima & Aminu (2020), Nguyen et al. (2020), Qamruzzaman et al. (2020), and Qamruzzaman & Karim, (2020b), for testing the possible presence of nonlinear stationarity (Kapetanios et al., 2003;
Kruse, 2011). Furthermore, the nonlinearity test by Brock et al. (1996) and the nonlinear ordinary least squares (NOLS) estimation techniques were also engaged, endorsing the existence of a nonlinear relationship between remittance inflows and the proxy of financial development in Bangladesh.
The coefficient of nonlinear effects that are positive and negative shocks in remittance inflows financial development will be estimated by applying nonlinear ARDL proposed by Shin et al. (2014). Finally, we investigate the directional causal relationships with symmetric and asymmetric effects from remittance inflows by following Granger non-causality test projected by Toda and Yamamoto (1995).
3.3. Autoregressive Distributed Lagged (ARDL) For testing the long-run association in empirical studies, Autoregressive distribute Lagged (ARDL) is used in this study (Adams Jr, 2006; Md & Salma, 2020; Qamruzzaman, 2017;
Qamruzzaman & Wei Jianguo, 2018; Md Qamruzzaman
& Wei Jianguo, 2018b; Qamruzzaman & Karim, 2020a, 2020b; Qamruzzaman & Wei, 2018). ADRL offers unique benefits over the existing conventional test of cointegration.
According to Ghatak and Siddiki (2001), ARDL has a more adaptive capacity for establishing relationships between variables, i.e., regardless of sample size, it can make either a small size or a finite size, consisting of 30 to 80 observations.
Second, the issue pertinent to a mixed order of integration is fully accommodated in ARDL. Third, Pesaran et al. (2001) advocated that serial correlation and the problem of indignity can be resolved by selecting appropriate lags. And finally, empirical model estimation with ARDL can produce long- run and short-run coefficients simultaneously (Pesaran et al., 2001). A basic ARDL model (Paul, 2014) for these variables X, Y, and Z can be expressed as;
∆ = + + + + ∆
+ ∆ + ∆
− − − −
=
= −
∑
∑
y y x z y
x z
t t t t t
i n
i t n
Ø1 1 1 2 1 3 1 1 1
1
2 1
1
3
g g g q
q q tt
i n
t
= −
∑
1+1
e1 (1)
Where, g1, g2, g3 are long-run coefficients whose sum is equivalent to the error correction term at the VECM model and θ1, θ2, θ3 are short-run coefficients. The study performed linear ARDL following Pesaran et al. (2001). The long-run elasticity is investigated by performing the following equations.
InBSD In In REM
In FDI In GDP
t t t
t
= + +
+ +
− −
−
b b b
b b
0 1 1 2 1
3 1 4
(BSD) ( )
( ) ( )tt
t k t k
−
= −
= −
=
+ ∆ + ∆
+ ∆
∑ ∑
∑
1
1 0
0
J g
d
k k n
k k n
k k n
In In REM
In FDI
(BSD) ( )
( )tt k− t k
= −
+ ∆
+ +
∑
mw e
k k n
0
In
t t
(GDP) (2)
InSMD In SMD In REM
In FDI In GDP
t t t
t t
= + +
+ +
+
− −
− −
g g g
g g
0 1 1 2 1
3 1 4 1
bb g
d
k k
n
k k
n
k k n
= −
= −
= −
∑ ∑
∑
∆ + ∆
+ ∆ +
1 0
0
In SMD In REM
In FDI
( ) ( )
( )
t k t k
t k mm
w e
k k n
= −
∑ ∆
+
0
In(GDP)t k
t t
(3)
InFD In FD In REM In FDI In GDP
t t t
t t
= + +
+ +
+
− −
− −
m m m
m m
b
0 1 1 2 1
2 1 2 1
kk k n
k k n
k k n
k
= ⋅ −
= −
= −
∑ ∑
∑
∆ + ∆
+ ∆ +
1 0
0
In FD In REM
In FDI
( ) ( )
( )
t k t k
t k
g
d m
kk n
= −
∑
∆+
0
In(GDP)t k w et t
(4)
Any of the following three statistics can test the occurrence of long-run relations. First, the modified F-test (FPSS) advanced by Pesaran et al. (2001), which tests the joint null hypothesis of no cointegration [β1 = β2 = β3 = β4=0;
γ1 = γ2 = γ3 = γ4= 0; μ1 = μ2 = μ3 = μ4 = 0]. Second, a Wald-test (WPSS), which also tests the above joint null. Third, a t-test (tBDM) proposed by Banerjee et al. (1998), which tests the null of no cointegration [β1 = 0; γ1 = 0; μ1 = 0] against [β1 ≠ 0;
γ1 ≠ 0; μ1 ≠ 0]. The testing procedure uses two critical bounds:
upper and lower. The null hypothesis of no-cointegration can be rejected at conventional significance levels by either the F-test, W-test or tBDM-test statistic, or both.
3.4. Nonlinear Autoregressive Distributed Lagged In recent times, nonlinearity assessment in empirical literature has become one of the focus areas using either form of data, i.e., time series and panel data, especially after the inception of the nonlinear framework by Shin et al. (2014).
Under the nonlinear framework, it is possible to detect the positive and negative shocks in the explanatory variable on the dependent variable both in the short run and long-run, (Ali et al., 2018; Qamruzzaman & Wei Jianguo, 2018; Qamruzzaman
& Wei Jianguo, 2018a, 2018b). The decomposition of remittances is executed by performing Equation (5).
POS(REM) InREM
MAX InREM
NEG (REM) InREM
t k
k t
K k T
t k
=
= ∆
=
+
=
=
∑
∑
1
1
0
( , )
−−
=
=
∑
∑
= ∆
k t
K k T 1
1
0 MIN( InREM , )
(5)
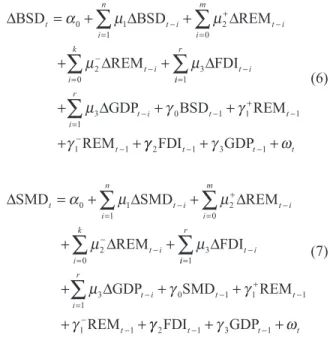
Following Shin et al. (2014), we formulate the standard ARDL integrating the asymmetry effects of remittance in equations 10 and 11. Here, two asymmetric equations are developed for assessing potential effects on financial development, i.e., Bank-based and market-based financial development, respectively.
∆ = + ∆ + ∆
+ ∆ +
= − +
= −
−
= −
∑ ∑
∑
BSD
REM
t i
n
t i i
m
t i
i k
t i
a m m
m m
0 1
1
2 0
2 0
3
BSD REM
ii r
t i
i r
t i t t
t
= −
= − − +
−
−
−
∑
∑
∆
+ ∆ + +
+ +
1
3 1
0 1 1 1
1 1
FDI
GDP BSD REM
REM
m g g
g gg2FDIt−1+g3GDPt−1+wt (6)
∆ = + ∆ + ∆
+ ∆ +
= − +
= −
−
= −
∑ ∑
∑
SMD SMD REM
REM
t i
n
t i i
m
t i
i k
t i
a m m
m m
0 1
1
2 0
2 0
3 ii
r
t i
i r
t i t t
t
= −
= − − +
−
−
−
∑
∑
∆
+ ∆ + +
+ +
1
3 1
0 1 1 1
1 1
FDI
GDP SMD REM
REM
m g g
g gg2FDIt−1+g3GDPt−1+wt (7)
In the long-run and short-run, the presence of asymmetry is investigated in the following ways.
First, the empirical model to be estimated by applying OLS.
Second, three cointegration tests are to be performed for long-run asymmetry, i.e., the F-test by Pesaran et al. (2001), which involves the testing of hypothesis “no cointegration”
[H0 : γ0 = γ1+ = γ1– = γ2 = γ3 = 0] against the alternative hypothesis [H1 : γ0 ≠γ1+ ≠ γ1– ≠ γ2 ≠ γ3 ≠ 0] or using tBDM-test of Banerjee et al. (1998), involving the test of the null hypothesis of “no cointegration” [H0 : γ0 = 0] against the alternative of cointegration [H0 : γ0 < 0].
In the third step, the presence of long-run and short-run asymmetries are investigated, long-run symmetry is evaluated by the null hypothesis of “long-run symmetry”
(H0 = (β1+ = β1–), where b g g
+ +
=- 1 0
and b g g
- -
=- 1 0
, respectively, and short-run additive symmetry is investigated by testing the null hypothesis i 0a2i 0a2
m
i i + k
=
−
∑
+∑
=4. Empirical Model Estimation and Interpretation
4.1. Unit Root Test Results
Table 2 exhibited the results of the commonly used unit root test, namely the Augmented Dickey-Fuller test (ADF) (Dickey & Fuller, 1979); Phillips-Perron test (P–P) (Phillips
& Perron, 1988) where the null hypothesis of the variable has a unit root; KPSS test (Kwiatkowski et al., 1992) where the null hypothesis of variables has no unit root, including the assumption of a constant trend. Study results unveiled a mixed order of integration, implying variables are stationary either at a level or/and after the first difference.
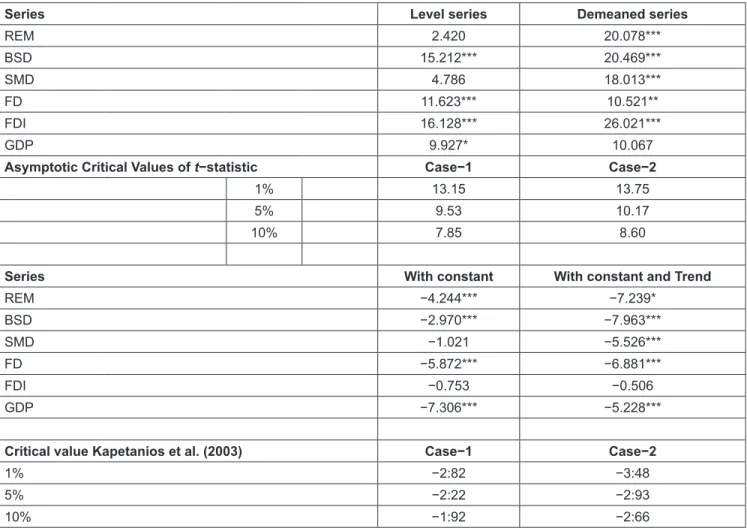
The nonlinear unit test results following Kapetanios et al. (2003) are shown in Table 3. To ascertain the presence of a nonlinear process study, we performed a case – 1 for the intercept in the equation and case-2 for both intercept and trend. Observing the p-value of associated test statistics, it is apparent that variables follow the nonlinear process of becoming stationary. Furthermore, the nonlinear unit root test results following Kruse (2011), and the null hypothesis of linearity is rejected at a 1% significance level. These findings denote that the research variables, namely remittance inflows, financial development, foreign direct investment, and economic growth, follow a nonlinear stationary process.
4.2. Nonlinearity Test
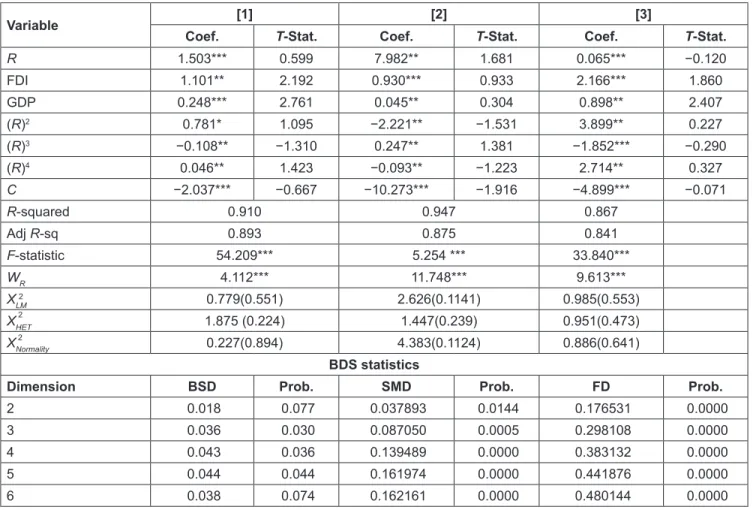
The results of the nonlinearity test with Nonlinear OLS are exhibited in Table 4. Referring to the associated P-value of test statistics, all the values are statistically significant at a 1% level of significance. Furthermore, the Wald test results with the null hypothesis, i.e., presence of linear relationships, are rejected, implying the existence of a nonlinear relationship between remittance inflows, financial development, foreign direct investment, and economic growth.
Furthermore, nonlinearity is also investigated by performing the BDS approach proposed by Broock et al. (1996) based on VAR residuals. The BDS test results in Table 4 show that the null hypothesis, i.e., linear dependency, is rejected since all the associated p-value is statistically significant. It suggests that the nonlinear model is preferable to detect asymmetric effects, especially in the short-run.
4.3. Estimation with Linear ARDL
Table 5 exhibited the result of liner ARDL following Pesaran et al. (2001). The long-run cointegration test results were exhibited in Panel-A with unrestricted constant. From Fpss, Wpss, and tBDM, at a 5% level of significance, it is apparent that the value of test statistics are higher than the upper bound of critical value. It supports the presence of a long- run association between remittances, financial development, foreign direct investment, and Bangladesh’s economic growth. This finding is valid for each empirical model.
Panel-B of Table 5 reports the result of the long-run model estimation. The study disclosed remittance positively influences financial development, i.e., Bank-based financial development (a coefficient of 0.191), stock market- based financial development (a coefficient of 0.279), and financial development index (a coefficient of 0.292). All the coefficients are statistically significant at a 1% level.
These findings are suggesting that sustainable financial development can be achieved with the persistent inflows of remittance. Furthermore, in the short-run, the positive effect also observed running from remittance to Bank- based financial development (a coefficient of 0.072) and composite financial development index (a coefficient of 0.134), respectively. But the negative effect was observed running from remittance to stock market-based financial development (a coefficient of 0.089). Short-run convergence was established since the coefficient of error correction term (ECT–1) is negative and statistically significant in all empirical estimation. (ECT–1) measures the speed at which import demand adjust to changes in the explanatory variables before converging to its equilibrium level.
Table 2: Results from Linear Unit Root Test
ADF P-P KPSS
Constant Constant &
Trend Constant Constant &
Trend Constant Constant &
Trend
REM −1.414 −4.354 −1.367 −1.393 0.989 0.571
BSD 0.308 −1.746 0.373 −1.713 0.167 0.738
SMD −1.176 −4.337 −1.028 −2.830 0.897 0.577
FD −0.823 −3.277 −1.002 −2.782 0.764 0.070
FDI −1.401 −3.365 −1.401 −3.354 0.574 0.652
GDP −0.348 −7.826 −3.260 −7.608 0.165 0.139
∆REM −4.261 −4.296 −1.367 −1.393 0.170 0.109
∆BSD −5.408 −5.375 −4.313 −4.268 0.174 0.155
∆SMD −6.118 −2.816 −5.305 −5.364 0.118 0.106
∆FD −5.787 −5.707 −10.770 −11.597 0.355 0.410
∆FDI −3.0746 −2.971 −6.641 −6.108 0.070 0.062
∆GDP −6.281 −6.379 −8.513 −8.794 0.069 0.035
Table 3: KSS Nonlinear Unit Root Test Results
Series Level series Demeaned series
REM 2.420 20.078***
BSD 15.212*** 20.469***
SMD 4.786 18.013***
FD 11.623*** 10.521**
FDI 16.128*** 26.021***
GDP 9.927* 10.067
Asymptotic Critical Values of t−statistic Case−1 Case−2
1% 13.15 13.75
5% 9.53 10.17
10% 7.85 8.60
Series With constant With constant and Trend
REM −4.244*** −7.239*
BSD −2.970*** −7.963***
SMD −1.021 −5.526***
FD −5.872*** −6.881***
FDI −0.753 −0.506
GDP −7.306*** −5.228***
Critical value Kapetanios et al. (2003) Case−1 Case−2
1% −2:82 −3:48
5% −2:22 −2:93
10% −1:92 −2:66
Empirical model estimation stability and consistency evaluate through performing several residual tests. Panel–C displays the results of the residual diagnostic test. Referring to the results, it is evident that the empirical model is free from autocorrelation in the error term’s disturbance. The errors are normally distributed, which is established by performing the Normality test. The RESET test statistics confirm the predictive power/accuracy of the model. Furthermore, following Pesaran and Pesaran (2009), the study performs the CUSUM test and CUSUM of square tests to assess parameter consistency, and results confirm stability in model estimation.
4.4. Nonlinear Autoregressive Distributed Lagged Estimation
Now, we proceed to estimate the magnetite of regional economic growth volatility and trade openness on inward of foreign direct investment under a nonlinear framework by using the prior equation (11). The original nonlinear
autoregressive distributed lagged model results were reported at a 1% level, which confirms. Now we proceed to estimate a cointegration test’s existence, in particular, the joint cointegration test in nonlinear equation 11. We found test statistics of F(BSD)pss = 17.571, F(SMD)pss = 15.260, and F(FD)pss = 20.393, which are higher than the upper bound of critical value1 at a 1% level of significance. Furthermore, the test statistics of tBDM also established the presence of long-run asymmetry by rejecting the null hypothesis of no-cointegrating at a 1% level of significance. So we can conclude in favor of an asymmetric association between the study variables. Furthermore, it is also observed that the coefficients error correction term (ECTt – 1) in the case of all tested models is negative and statistically significant at a 1%
level, which confirms the existence of an asymmetric long- run equilibrium relationship between remittance and financial development. More specifically, the asymmetric error correction term suggests that 34.1% of any disequilibrium is removed each year for model [1], 41.7% for model [2], and 51.6% for model [3].
Table 4: Nonlinear Ordinary Least Square (NOLS) and BDS Test
Variable [1] [2] [3]
Coef. T-Stat. Coef. T-Stat. Coef. T-Stat.
R 1.503*** 0.599 7.982** 1.681 0.065*** −0.120
FDI 1.101** 2.192 0.930*** 0.933 2.166*** 1.860
GDP 0.248*** 2.761 0.045** 0.304 0.898** 2.407
(R)2 0.781* 1.095 −2.221** −1.531 3.899** 0.227
(R)3 −0.108** −1.310 0.247** 1.381 −1.852*** −0.290
(R)4 0.046** 1.423 −0.093** −1.223 2.714** 0.327
C −2.037*** −0.667 −10.273*** −1.916 −4.899*** −0.071
R-squared 0.910 0.947 0.867
Adj R-sq 0.893 0.875 0.841
F-statistic 54.209*** 5.254 *** 33.840***
WR 4.112*** 11.748*** 9.613***
XLM2 0.779(0.551) 2.626(0.1141) 0.985(0.553)
XHET 1.875 (0.224) 1.447(0.239) 0.951(0.473)
XNormality 0.227(0.894) 4.383(0.1124) 0.886(0.641)
BDS statistics
Dimension BSD Prob. SMD Prob. FD Prob.
2 0.018 0.077 0.037893 0.0144 0.176531 0.0000
3 0.036 0.030 0.087050 0.0005 0.298108 0.0000
4 0.043 0.036 0.139489 0.0000 0.383132 0.0000
5 0.044 0.044 0.161974 0.0000 0.441876 0.0000
6 0.038 0.074 0.162161 0.0000 0.480144 0.0000
Note: W indicates the standard Wald test results; *** indicates significance at a 1% level.
2 2
A standard Wald test is performed for investigating both long-run and short-run symmetry. Long run symmetry (WLR) is investigated with null hypothesis symmetric relationship (LR+ = LR–) and the short short-run symmetric relation WSR(SR+ = SR–). The results are shown in Table 6 (Panel-A). The null hypothesis of the long run and short run symmetry is rejected at a 1% level of significance for all three empirical models. Findings suggested an asymmetry relationship explaining the relationship between remittance and financial sector development both in the long-run and short-run.
We estimated the long-run asymmetry coefficients, which are reported in panel–B. the study revealed that all the coefficients are statistically significant at a 1%
level. More specifically, positive shocks in remittance are positively linked with all the proxy variables of financial sector developer, i.e., a coefficient of 0.677 for model [1],
a coefficient of 0.572 for model [2], and a coefficient of 1.671 for model [3], respectively. Furthermore, adverse shocks in remittance are also positively associated with the process of financial development, specifically, a coefficient of 2.941 for model [1], a coefficient of 0.446 for model [2], and a coefficient of 3.334 for model [3], respectively.
Finally, we perform several residual-based diagnostics tests to ascertain the robustness and stability of model estimation, and the results are shown in Table 3. Diagnostic test results confirmed that the empirical model is free from serial correlation, residuals are normally distributed, and models are free from homoscedasticity. Moreover, Ramsey’s RESET confirms model construction validity as well. Following Pesaran et al. (2001), CUSUM and CUSUM of the square test preform and found empirical models are stable.


![Table 6: Dynamic of the long run and short run estimation [1] [2] [3] C −0.556*** 0.644 −2.506*** 0.792 −2.529*** 0.851 BSD(−1) −0.273*** 0.158 SMD(−1) −0.474*** 0.162 FD(−1) −0.483*** 0.158 R + (−1) 0.185*** 0.572 0.802*** 0.920 0.808*** 0.726 R – (−1) 0](https://thumb-ap.123doks.com/thumbv2/123dokinfo/5068134.315447/11.918.85.839.177.1071/table-dynamic-long-run-short-estimation-bsd-smd.webp)
