Print ISSN: 2288-4637 / Online ISSN 2288-4645 doi:10.13106/jafeb.2021.vol8.no10.0229
The Impact of Leading Economic Indicators on the Export of ASEAN Countries*
Ngoc Hong BUI
1Received: June 30, 2021 Revised: September 09, 2021 Accepted: September 17, 2021
Abstract
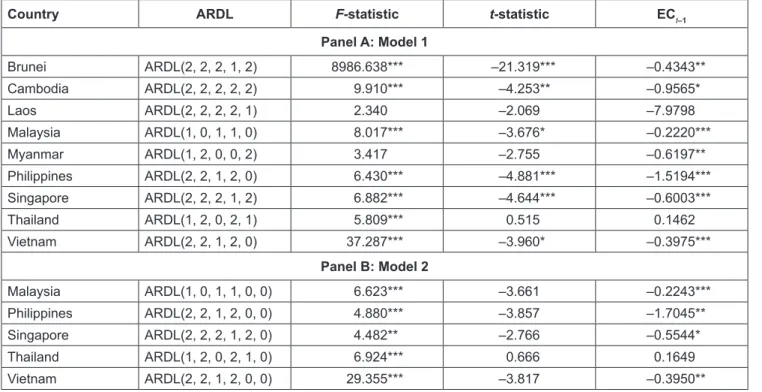
The article applies the ECM – ARDL model to examine the relationship between economic indicators and the existence of the disease in the long run of 10 ASEAN countries from 2000 to 2019. There are two models: The first model investigates the impact of GDP per capita, net inflow FDI, unemployment rate, and inflation rate on the proportion of export to GDP of ASEAN countries, the second model is similar to the first one but adds one more variable to the independent variable list – ‘the variable for disease’. The results prove the long-run effect of GDP per capita, FDI, unemployment and inflation rate on export of the selected countries, though individual country shows differences in the sign and magnitude of these impacts. Surprisingly, the number of people suffering from disease does not affect the export of all selected countries as expected. The results of the two models also indicate that the disequilibrium in the short run converges to the equilibrium in the long run with a high proportion, especially in the case of Cambodia and the Philippines, with the rate of 95.65% and 151.94%, respectively.
The findings can be useful for policymakers in promulgating efficient policies to enhance the trading activities of the selected countries.
Keywords: ASEAN, Export, Panel Data, Autoregressive Distributed Lag, Error Correction Model JEL Classification Codes: C12, C22, C23, F16
growth, exchange rate, tourism, etc for a single country or group of countries. Specifically, the Granger causality among economic growth, FDI, and export of East and Southern Asia was investigated by Hsiao and Hsiao (2006) and Nikolaos and Pavlos (2018). (Duasa, 2007) identified the factors affecting Malaysia’s trade balance. Hye (2012) found the relationship between export and import, real GDP and export, and real GDP and import of China. In the long run, trade openness stimulates the economic growth of Pakistan is the result of the analysis of Shahbaz (2012). It was proven in a recent study by Kong et al. (2021) that trade openness has a positive impact on China’s economic growth.
The impact of the unemployment rate on economic growth appeared in many studies (Chang, 2005; Ekanem, 2005; Kreishan, 2011; Louail & Riache, 2019; Tzougas, 2013). Besides, how trade enhancement affects the unemployment rate was identified by Hasan et al. (2012) and Jin et al. (2019). Nikolaos and Pavlos (2018) found a two-way relationship between unemployment and the export of the old European Union member countries. Meanwhile, Bayar (2014) proved the negative impact of unemployment on the export of Turkey.
Similar to unemployment, the relationship between inflation and GDP was investigated by many scholars, for
*Acknowledgements:
This research was funded by University of Economics and Law (VNU-HCMC) under grant number: CS/2020-06.
1
First Author and Corresponding Author. Faculty of Economics, University of Economics and Law, Vietnam National University - Ho Chi Minh City, Vietnam [Postal Address: 669 NH1A, Quarter 3, Linh Xuan ward, Thu Duc, Ho Chi Minh City, Vietnam]
Email: [email protected]
© Copyright: The Author(s)
This is an Open Access article distributed under the terms of the Creative Commons Attribution Non-Commercial License (https://creativecommons.org/licenses/by-nc/4.0/) which permits unrestricted non-commercial use, distribution, and reproduction in any medium, provided the original work is properly cited.
1. Introduction
In today’s open economy, trading activities play a vital role in any nation’s economic growth. Governments around the world have developed policies and strategies to increase their trade volumes. To promulgate reasonable policies, it is necessary to have an understanding of the criteria, which affect international trade. The research concerning these impacts is hence crucial.
Different studies have applied the ARDL model to tackle
the causal relationship among the economic indicators,
for example, export, foreign direct investment, economic
instance, Behera and Mishra (2016), Lee and Yu (2021), and Ngoc (2020). They all used the ARDL model in their research to determine the impact of inflation on national income Nevertheless, the impact of inflation on export volume was not investigated widely. Several studies that dealt with this relationship are those of Monineath (2018), Mwakanemela (2014), Purusa and Istiqomah (2018), and Sumantri and Latifah (2019). Among these authors, only Monineath (2018) applied the ARDL model in the research to reveal the relationship between inflation and export performance.
Besides, there is no previous research that considered all the indicators of GDP, foreign direct investment, unemploy- ment, inflation, and disease to show their impacts on the export activities of ASEAN countries. Besides, many scholars examined the influence of export, FDI, GDP growth on unemployment and inflation, but few studies investigated the opposite relationship. Thus, this paper aims at constructing a model to investigate the relationship between the above mentioned economic indicators and trading activities in the long run and the short run. Using the data from 10 countries in ASEAN in the time 2000–2019, the research employed the Error Correction Model – Autoregressive Distributed Lag (ECM – ARDL) model to determine the impact of economic growth, foreign direct investment, unemployment rate, infla- tion rate, and especially the appearance of disease on the export of individual country in ASEAN. The expansion of adding different variables in this paper can enrich the related literature.
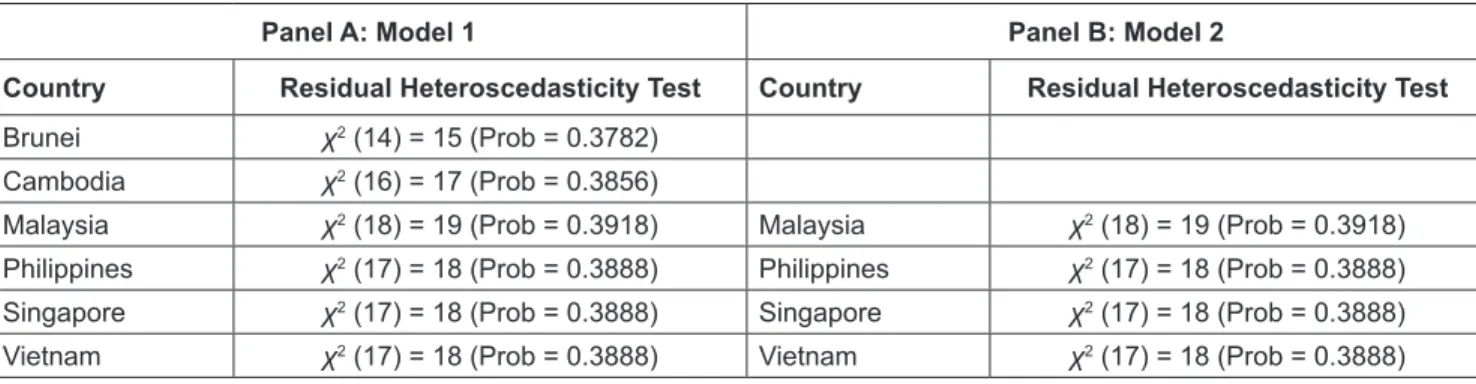
The results reveal the differences in the effect of each variable on the export of individual countries. Interestingly, the number of people infected with the disease (SARS) does not put any pressure on export activity. The error correction term indicates the high rate of convergence of disequilibrium in the short run to the equilibrium state in the long run. The estimation results are checked with the diagnostic test and stability test, which confirm the stability and homoscedasticity of the model.
The structure of the article is as follows. Section 2 discusses the Literature Review before moving to the Data and Methodology in Section 3. Section 4 provides the Empirical Analysis and Discussion. Finally, it is the Conclusion.
2. Literature Review
ARDL is a useful model for forecasting and checking the long-run and short-run relationship between variables.
Since the Error Correction (EC) was introduced and applied in economics, it became noteworthy and was considered as a useful model tackling the stationary series. Hylleberg and Mizon (1989) stated in their research: “the error correction formulation provides an excellent framework within which it is possible to apply both the data information and the information available from economic theory”.
Many scholars employ ARDL and ECM models with both time series data and/or panel data in their research to reveal the relationship between the variables, for example, international trade, economic growth, FDI inflow, exchange rate, unemployment, etc. Specifically, considering the exchange rate and international trade, Duasa (2007) proved that the real exchange rate does not affect trade volume in the case of Malaysia. In the research analyzing the impact of exchange rate volatility on Vietnam’s export, Thuy and Thuy (2019) employed the ARDL bound test and found that exports change negatively in the short run and positively in the long run, once the domestic currency depreciates. With the same topic, Nguyen et al. (2021) applied nonlinear ARDL (NARDL) in the analysis and proved the trivial impact of exchange rate on export and import.
Considering the relationship between economic growth, FDI, and trading activities, Narayan and Smyth (2005) examined the relationship between trade flows and the economic growth of Fiji by exploiting the ARDL model and found that the impact of export on economic growth is trivial. However, they proved the significantly positive effect of signing the IMF agreement on Fiji’s GDP growth. Using the data of Ghana and applying the ARDL model Frimpong Magnus and Oteng-Abayie (2006) pointed that trading activities enhance but FDI discourages economic growth. Using panel data of OECD countries, Kónya (2006) revealed that export stimulates GDP in some countries, GDP encourages export in others and there is a two-way relationship between these indicators in Canada, Finland, and the Netherlands. The result of Granger causality indicated a positive impact of international trade on the economic growth in the three transition economies (Awokuse, 2007). With time series, applying the ARDL model for the data of Malaysia, Duasa (2007) found that there is an impact of income and money supply on the trade balance.
The research of Katircioglu (2009) indicated the long-
run relationship between tourism, international trade, and
economic growth by applying the bound test and Granger
causality test. That FDI inflow stimulates export activity was
found by Prasanna (2010). The same results were shown by
Cañal-Fernández and Fernández (2018), who examined the
long-run impact of FDI, export, import, and GDP in Spain
using the ARDL model and found the positive impact of FDI,
import, and GDP on export as a result of short-run Granger
causality. Halicioglu (2011) exploited the ARDL model
with data from Turkey to check the long-run relationship
between income, energy consumption, and exports. The
result suggested that there exists a long-run and short-run
relationship between export and aggregate output. Using
the data of Vietnam from 2009 to 2018 and applying the
ECM model, Nguyen and Do (2020) pointed the rate of
convergence to the long-run equilibrium of Vietnam’s export
performance under the effect of economic growth, import,
and inward FDI. In one of the novel articles using the ARDL model to investigate the relationship between trade openness and the economic growth of China, the authors proved this relationship occurs both in the long run and in the short run (Kong et al., 2021). This result is consistent with Shahbaz (2012), who conducted a similar approach for Pakistan data.
The link between the unemployment rate and economic growth was first introduced by Okun’s law in 1962 (Okun, 1962). The relationship between unemployment and inflation was first represented by Phillips (1958). However, the impact of unemployment on trading activities is being investigated. According to Bayar (2014), unemployment discourages the export volume of Turkey by applying the bound test approach with quarterly data from 2000:Q1 to 2013:Q3. Whereas, Nikolaos and Pavlos (2018) showed that unemployment Granger causes export when estimating the data of fifteen European countries in the period 1970–2015 with the fixed effect model.
In terms of the impact of inflation on export activity, Mwakanemela (2014) found that an increase in the inflation rate reduces the manufacturing export volume. Mwakanemela (2014) used Vector Error Correction (VEC) model to figure out the major determinants of Tanzanian export. Purusa and Istiqomah (2018) exploited the fixed effect model and used the data of five ASEAN countries (Indonesia, Malaysia, the Philippines, Thailand, and Vietnam) from 2000 to 2015 to show that inflation discourages export performance. With the Multiple Linear Regression method, Sumantri and Latifah (2019) pointed that Indonesia’s CPI does not have any impact on the export and import activities of this country. A study tackling the determinants of export in Cambodia by using the ARDL model showed that the inflation rate has a negative impact on the export activity of this country (Monineath, 2018).
The analyses concerning the relationship between GDP, FDI, and export are varied. However, there is no previous research conducting the relationship among international trade and economic indicators, included GDP per capita, FDI, unemployment rate, inflation rate, and diseases. This article applies the ARDL model with panel data to investigate the impact of GDP per capita, net flow FDI, unemployment rate, and inflation rate on the export of ten countries in ASEAN. Interestingly, the analysis yearns to figure whether the disease hampers trading activities or not by adding a variable, which stands for the number of people suffering a disease during the period considered.
3. Data and Methodology 3.1. Data
The two-dimensional panel data (country and time) collected from the World Bank from 10 ASEAN countries over a period of 20 years between 2000 and 2019 is used in this paper. There are 200 observations in total.
The proportion of export to GDP, inflation rate, and the unemployment rate is as a percentage. GDP per capita and net inflows of Foreign Direct Investment (FDI) of each country are calculated as current US$.
The information about the disease in this article considers severe acute respiratory syndrome (SARS), which spread quickly and widely in 2002 and 2003. According to the summary of probable SARS cases with onset of illness from 1 November 2002 to 31 July 2003 from the World Health Organization, the number of cases infected of the selected countries are as follow: Indonesia –2, Malaysia –5, Philippines –14, Singapore –238, Thailand –9, and Vietnam –63 (WHO, 2015).
Since the inflation rate of several countries is negative in some years, the inflation variable cannot take the log form.
It is also invalid to take a log for the disease variable, where the value of the number of people infected is 0. All the other variables in the analysis are in the log form.
3.2. Methodology
The research focuses on investigating the impact of GDP per capita, FDI, unemployment, inflation, trade openness, and disease on ASEAN countries’ export. There are two models as in Equation (2) and Equation (3). The difference between these two models is the appearance of the variable for the occurrence of disease in the time considered, respectively.
0 1 2
3 4
lnEX_ GDP ln GDPPC lnFDI lnUN INF
it it it
it it it
α α α
α α ε
= + +
+ + + (1)
0 1 2 3
4 5 2
lnEX_ GDP ln GDPPC lnFDI lnUN INF Disesase
it it it it
it it t
β β β β
β β ε
= + + +
+ + +
(2) Where lnEX_GDP
it, lnGDPPC
it, lnFDI
it, lnUN
it, INF
it, denotes the proportion of export to GDP of country i at year t; GDP per capita of country i at year t; net inflows FDI of country i at year t, the unemployment rate of country i at year t, and the inflation rate of country i at year t, respectively;
Disease
itindicates the number of people of country i, who were infected by SARS in year t; and ε
tis the error term.
The result of estimation can get into the problem of multicollinearity if there is a correlation between variables.
Hence, first, it is necessary to check the correlation among
variables. According to Gujarati (2009) and Kennedy (2003),
the enormous correlation coefficient between two variables
– excess of 0.8 – can cause problematic issues. Some of
the solutions used to tackle this problem are obtaining
more data, formalizing relationships among regressors,
dropping a variable,and specifying a relationship among
some parameters (Kennedy, 2003). After checking for the
correlation among the variables in the models, the results
suggest there is no correlation between variables.
Autoregressive Distributed Lag (ARDL) approach is applied in the analysis with the aim of finding the relationship in the short run and the long run between variables. Besides, it is also an efficient tool to conduct forecasting tasks.
Conducting ARDL approach, Equation (4) and Equation (5) can be expressed as follow:
1
2 3
5 4
0 1 ,
1
2 , 3 ,
0 0
4 , 5 ,
0 0
6 , 1 7 , 1
8 , 1 9 , 1 10 , 1 1
lnEX_GDP lnEX_GDP
lnGDPPC lnFDI
lnUN INF
lnEX_GDP lnGDPPC
lnFDI lnUN INF
p
it i t k
k
p p
i t k i t k
k k
p p
i t k i t k
k k
i t i t
i t i t i t t
γ γ
γ γ
γ γ
γ γ
γ γ γ µ
−
=
− −
= =
− −
= =
− −
− − −
∆ = + ∆
+ ∆ + ∆
+ ∆ + ∆
+ +
+ + + +
∑
∑ ∑
∑ ∑
(3)
1
3 2
5 4
0 1 ,
1
2 , 3 ,
0 0
4 , 5 ,
0 0
6 , 1 7 , 1
8 , 1 9 , 1 10 , 1
11 2
lnEX_GDP lnEX_GDP
lnGDPPC lnFDI
lnUN INF
lnEX_GDP lnGDPPC
lnFDI lnUN INF
Disease
p
it i t k
k
p p
i t k i t k
k k
p p
i t k i t k
k k
i t i t
i t i t i t
it
δ δ
δ δ
δ δ
δ δ
δ δ δ
δ µ
−
=
− −
= =
− −
= =
− −
− − −
∆ = + ∆
+ ∆ + ∆
+ ∆ + ∆
+ +
+ + +
+ +
∑
∑ ∑
∑ ∑
t
(4)
The Error Correction Model of ARDL (ECM – ARDL) is as below:
1
3 2
5 4
0 1 ,
1
2 , 3 ,
0 0
4 , 5 ,
0 0
1 1
lnEX_GDP lnEX_GDP
lnGDPPC lnFDI
lnUN INF
EC
p
it i t k
k
p p
i t k i t k
k k
p p
i t k i t k
k k
jt
v
tγ γ
γ γ
γ γ
λ
= −
− −
= =
− −
= =
−