이온 크로마토그래피를 이용한 화장품 중 중금속 동시분석
이 소 미†⋅정 혜 진⋅김 한 곤
(주)아모레퍼시픽 기술연구원 피부과학연구소 (2007년 12월 26일 접수, 2008년 1월 30일 채택)
Simultaneous Determination of Heavy Metals in Cosmetic Products by Ion Chromatography
So Mi Lee†, Hye Jin Jeong, and Han Kon Kim
Amorepacific Corporation R&D Center, 314-1, Bora-dong, Giheung-gu, Yongin-si, Gyeonggi-do 446-729, Korea (Received December 26, 2007; Accepted January 30, 2008)
요 약: 화장품 중 불순물로서 미량의 중금속이 함유되어 있는 경우 이들의 피부흡착이 알러지를 일으킬 수가 있다. 이에 중금속으로부터 안전한 화장품인지를 신속하고 정확하게 판단하는 것이 중요하여 색소원료와 화장품 중 미량의 중금속 들(Pb
2+, Fe
2+, Cu
2+, Ni
2+, Zn
2+, Co
2+, Cd
2+및 Mn
2+) 을 동시에 분석할 수 있는 이온크로마토그래피 분석법을 개발하였 다. 8종의 중금속들은 이온교환 컬럼(IonPac CS5A)으로 잘 분리되었고, post-column 장치와 UV 분광기로 검출하였다.
0.1 ~ 1000 µg/mL 농도범위에서 8종의 중금속들의 검량선은 선형적이었고(r
2> 0.999), 검출한계는 제품이 안전한지를 판단할 수 있는 µg/L 수준이었다. 피크들의 머무름 시간과 면적의 상대표준편차는 0.21 %과 0.24 %이고, 회수율은 97
~ 104 %이다. 이 결과들은 개발된 분석방법이 화장품 중의 미량의 중금속들을 신속하고 정확하게 분석할 수 있다는 것을 보여준다. 본 분석방법은 22개 화장품과 11개 색소원료 중의 중금속들의 함량을 분석하는데 활용하였다.
Abstract: No matter how small amount of heavy metals it may be cause skin allergies through percutaneous adsorp- tion when existing in cosmetic products as impurities. In order to develop a highly sensitive method for simultaneous determination of Pb
2+, Fe
2+, Cu
2+, Ni
2+, Zn
2+, Co
2+, Cd
2+, and Mn
2+in coloring agents and cosmetic products with rapidity and accuracy, we carried out the determination on ion chromatography. All of these metals are well sepa- rated through a bifunctional ion-exchange column (IonPac CS5A) and detected by post-column reaction and spec- trophotometric detection. The calibration graphs are linear (r
2> 0.999) in the range 0.1 ~ 1000 µg/mL. Detection limits for 200 µL of sample solution are at the level of µg/L, which is sufficient for judging whether the product is safe or not. The relative standard deviations (RSDs) of the retention time and the peak area are less than 0.21 and 1.24 %, respectively. The recovery rates are 97 ~ 104 %. The new method was applied to analyze the amount of heavy metals which were contained in 22 cosmetic products and 11 coloring agents.
Keywords: heavy metals, cosmetic products, ion chromatography, simultaneous determination, coloring agents
1. Introduction
1)
Many cosmetic products contain heavy metals such as lead, arsenic, mercury, cobalt, and nickel as in- gredients or impurities. Recent research has reported
† 주 저자 (e-mail: [email protected])
that these metals can easily cause many types of skin problems[1,2]. The use of some heavy metals in cos- metics has been controversial due to the biological ac- cumulation of those metals and their toxicity in the hu- man body.
In most countries, it is legally prohibited to use lead, arsenic and mercury in skin cosmetic products, but
there are no specific rules on other heavy metals, such as cobalt, nickel and copper[3]. It is also reported that those metals can cause allergic contact dermatitis or other skin problems[4,5]. To provide customers with safe cosmetics, it is necessary to control the amount of heavy metals used in cosmetic products. In this study, a fast and accurate analysis method for quality control of 8 water soluble heavy metals such as Pb2+, Fe2+, Cu2+, Ni2+, Zn2+, Co2+, Cd2+, and Mn2+ in cosmetic products using Ion chromatography (IC) and post-col- umn reaction will be proposed. The new method will be effective in the determination of water soluble heavy metals in complex matrices such as cosmetic products.
ICP-MS, ICP, GF-AAS and Flame AAS are some examples of heavy metal analysis techniques. ICP-MS is one of the most favored analysis techniques because it is fast and highly sensitive in metal analysis.
However, ICP-MS cannot achieve simultaneous analy- sis of trace metals such as Fe, Cu, Zn, and Ni because of the interference from polyatomic ion which is ob- tained by the reaction of Ar, N, O, H, and so on [1,6,7].
Also, ICP-MS, GF-AAS, and Flame AAS are not suitable for analysis of trace water soluble metals be- cause of the interference of residual organic materials in the test sample.
Ion chromatography (IC) is a proper method for the separation and determination of water soluble trace heavy metals in complex matrices because it does not have any interference by residual organic materials. It is useful for quality control of cosmetic products since it is an inexpensive and accurate technique in view of instrumentation costs and maintenance.
2. Materials and Methods
2.1. Materials
4-(2-Pyridylazo)resorcinol (PAR), pyridin-2,6-dicar- boxylic acid (PDCA), formic acid, potassium sulfate, 2-dimethylaminoethanol, ammonium hydroxide and so- dium bicarbonate were purchased from Sigma-Aldrich (Broendby, Denmark). Metal ion standard solutions of (1000 mg/L) of lead (II), Iron (II), copper (II), nickel (II), zinc (II), cobalt (II), cadmium (II), and man-
ganese (II) were purchased from Fluka (Buch, Switzerland). All solvents used in this study were ana- lytical grade.
2.2. Instrumentation
Determination of the metal ions were carried out by ion chromatography, Dionex ICS 2500 system (Dionex, Sunnyvale, CA, USA) consisting of GP50 pump, AS50 autosampler, PC10 Post-column pneumatic Delivery Package and PDA-100 photodiode array detector.
Chromeleon software, version 6.60 was used to process all the data obtained. The column was Dionex IonPac CS5A (4 × 250 mm) analytical which was protected by a guard column (4 × 50 mm, Dionex IonPac CG5A, USA).
2.3. Sample Preparation
One gram of samples were weighed and placed in 15 mL polypropylene centrifuge tubes with 10 mL of ethanol-hexane (1 : 1, v/v) solution. The mixtures were sonicated for 15 min, followed by centrifuge for 20 min at 2,000 rpm. After the solution was decanted, this process was repeated 2 times in a low. The sample were dried at 60 ℃ for 12 h. Dried sample with 10 mL of eluent solution were heated 90 ℃ water bath for 1 h. After cooling the samples to room temperature, they were sonicated for 15 min. The solution was filtered on a PVDF membrane filter (0.45 mm) and then analyzed by IC.
2.4. Method of Analysis
The samples were analyzed through IC by using PDA. The operation condition was summarized in Table 1. This method utilized a post-column reaction with a color reagent (PAR).
2.5. Method Validation
The specificity could be tested with photodiode array detector. To check the precision of the method, multiple replicate analysis of a standard solution was performed.
The relative standard deviations (RSDs) of the re- tention time and the peak area were calculated as the reproducibility of data. The linearity of the method was
Table 1. Operation Conditions of Ion Chromatography for Determination of Water-soluble Pb
2+, Fe
2+, Cu
2+, Ni
2+, Zn
2+, Co
2+, Cd
2+, and Mn
2+System Dionex ICS 2500 Column IonPac CS5A Analytical (4 × 250 mm)
IonPac CG5A Guard (4 × 50 mm)
Eluent
PDCA 7.5 mM Potassium hydroxide 66 mM
Formic acid 74 mM Potassium sulfate 5.6 mM
Post-column reagent
PAR 0.65 mM 2-Dimethylaminoethanol 1.0 M
Ammonium hydroxide 0.5 M Sodium bicarbonate 0.3 M
Flow rate 0.7 mL/min
Reagent flow rate 0.35 mL/min Mixing device 375-µL Knitted reaction coil Column of injection 100 µL
Detector wavelength 530 nm
investigated in the range of 0.1 ~ 1000 µg/mL for the metals tested. The result for the linearity of the method was evaluated in the range 0.1 ~ 1000 µg/mL for the test metals. The recovery rate was obtained from the spiking test, which added standard solution with con- stant concentration to the analyzing cosmetic product in order to check the accuracy of the test. The de- tection limit (signal-to-noise ration of 3 : 1) of this method was defined according to IUPAC and the ACS[8].
3. Results
3.1. Chromatographic Separation
Hydrated and weakly complexed heavy metals could be separated as cations on a cation exchange column.
If weak organic acids such as oxalic, citric and tartaric acid were used as chelating agent in the eluent, the net charge on the metal would be reduced, because the chelating agents would be anionic state in solution above their pKa's. The selectivity of the separation was actually due to the different degrees of association be- tween the metals and the chelating agents that were producing different net charges on the metal com- plexes.
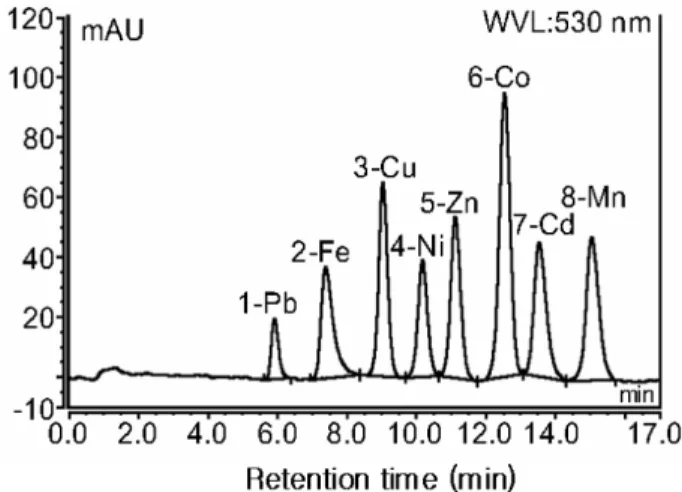
Figure 1. Chromatogram of standard metals. Peaks (µg/mL) : Pb = 10, Fe = 0.25, Cu = 0.5, Ni = 0.5, Zn = 0.5, Co = 0.5, Cd = 2.5, Mn = 1.0 (530 nm).
If sufficiently strong chelating agents were used in high concentration, the net charge of the metal com- plexes could be negative. These anionic metal com- plexes were separated by anion exchange on the IonPac CS5A column, which was allowing metals to be separated as cations and anions on a single column[9].
The common chelating agent was oxalic acid. But, ox- alic acid did not elute the iron. Using this chelating agent, cadmium and manganese were eluted together.
Therefore, Fe2+, Cd2+, and Mn2+ could not simulta- neously be determined from oxalic acid[10,11]. In this study, PDCA chelating agent was used for metal separation. PDCA forms strong anionic complexes with most metal ions ; thus the separation of metals with PDCA on the IonPac CS5A column was an anion-ex- change separation. Figure 1 showed that all metals were simultaneously separated well with better resolution. If this method could be applied in cosmetic samples, it would improve the accuracy of determining toxic metals in the quality control process.
3.2. Optimization of Spectrophotometric Detection Because most hydrated and weakly complexed met- als would be precipitated in a suppressor, therefore, it could not be detected by conductivity. Also, with a few exceptions, heavy metals could not be detected by di- rect UV absorbance. Therefore, the metal complexing agent was added to post-column to form a light-ab-
Table 2. Relative Standard Deviations (RSDs), Linear Ranges, Correlation Roefficients and Detection Limits
Metal
RSD (%) Linear range (µg/mL)
Correlation coefficients
(r
2)
Detection limit (µg/L) Retention
time (min) Peak
area
Pb 0.210 1.02 2.5 ∼ 40.0 0.9986 41 Fe 0.166 1.13 0.1 ∼ 1000 0.9995 3.4 Cu 0.214 1.08 0.1 ∼ 10 0.9992 5.5 Ni 0.184 0.99 0.1 ∼ 40 0.9997 6.1 Zn 0.16 1.04 0.2 ∼ 1000 0.9992 5.8 Co 0.137 1.16 0.2 ∼ 200 0.9991 3.4 Cd 0.144 1.24 0.8 ∼ 12.5 0.9988 19 Mn 0.072 0.98 0.2 ∼ 100 0.9995 9.8
sorbing complex (Dionex Application Note 10. 2000). A number of metal complexing agents were often used for the determination of heavy metals with high sensi- tivity, e. g., dithizone, PAR, and 8-hydroxyquinoline- 5-sulfonate (HQS)[12]. However, dithizone and HQS could not be used under the same conditions for differ- ent metals. Consequently, they were not suitable for the simultaneous detection of metals in chromato- graphic analysis. PAR was used as derivatizing agent because it could produce stable and colorful derivatives with the most metals under the same conditions.
Optimum flow rate and concentration combination of PDCA and PAR with stable baseline and high sensi- tivity could low the detection limits, so this could be accepted as an satisfactory process for safe cosmetic products.
3.3. Validation of the Method
Distinct peaks with good separation were obtained using Ion chromatography. The specificity of the each metal was validated by the evaluation of the peak homogeneity from the UV spectrum of the photodiode array detector. The method showed a good linearity (r2
> 0.999) with the test metals for concentration ranging from 0.1 to 1000 µg/mL. When 200 µL of sample was injected, the detection limits (signal-to-noise ratio 3 : 1) of this method were 41, 3.4, 5.5, 6.1, 5.8, 3.4, 19, and 9.8 µg/L for Pb2+, Fe2+, Cu2+, Ni2+, Zn2+, Co2+, Cd2+, and Mn2+, respectively. The reproducibility was de-
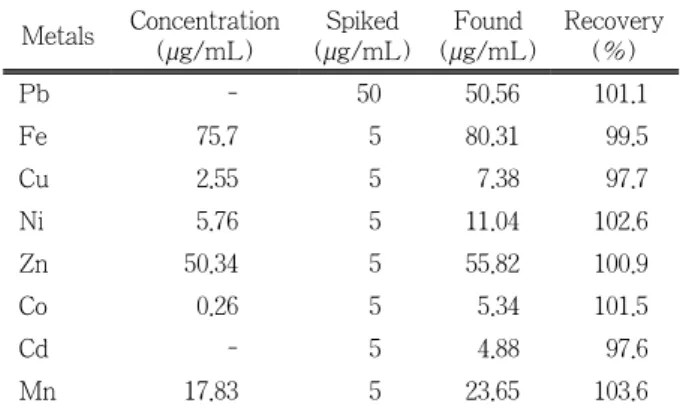
Table 3. Concentrations and Recoveries of Metals Spiked in Eye Shadow
Metals Concentration (µg/mL)
Spiked (µg/mL)
Found (µg/mL)
Recovery (%)
Pb - 50 50.56 101.1
Fe 75.7 5 80.31 99.5
Cu 2.55 5 7.38 97.7
Ni 5.76 5 11.04 102.6
Zn 50.34 5 55.82 100.9
Co 0.26 5 5.34 101.5
Cd - 5 4.88 97.6
Mn 17.83 5 23.65 103.6
termined by multiple analysis of a standard solution.
The relative standard deviations (RSDs) of the re- tention time and the peak area were less than 0.21 and 1.24 % respectively. The linearity, the detection limits and the relative standard deviations were summarized in Table 2. The recovery rates were 97 ~ 104 %, shown in Table 3.
3.4. Analysis of Samples
As a validation of the analytical technique, coloring agents and cosmetic products could be analyzed. Figure 2 showed the chromatogram of all the metals from col- oring agent. The concentrations of the metals in color- ing agents and cosmetic products were presented in Table 4, Table 5, respectively.
Lead and cadmium which can cause serious problem of safety on the skin were not detected in the coloring agent and cosmetic product. Copper, nickel, cobalt, and manganese were not detected in all of the cosmetic products except some of coloring agents. It means that all the cosmetic products on the test for skin purpose are safe for heavy metals except some coloring agents.
However, in order to prevent cosmetic products from contamination of heavy metals, which were originated from raw materials, the quality control process for heavy metals is definitely necessary in the production of cosmetic products.
Table 4. Determination of Metals in Coloring Agents Samples Concentration (µg/mL)
Pb Fe Cu Ni Zn Co Cd Mn Ultramarine pink - 75.7 2.5 5.7 50.3 0.3 - 17.8 Ultramarine blue - 156.3 1.8 - 100.9 0.5 - 34.9 Cobalt blue - 2.2 0.4 - 21.6 177.9 - 0.8 Chromium
oxide green - 30.2 0.4 - 27.1 - - 8.4 Unipure green - - 0.9 1.2 28.5 - - - I.O. black - 719.9 - - 13.8 - - 80.1 Mapico black - 789.8 - - 17.0 - - 7.7 Mapico red - 666.8 6.6 - 103.3 2.9 - 67.7 Soft-Tex red - 616.9 - - 16.6 - - 9.4 Mapico yellow - 541.2 - 4.5 22.9 7.2 - 16.9 Socovit brown - - - 19.5 31.1 4.5 - 27.5
* Above were the average concentration values of 3 times in- jection
Figure 2. Chromatogram of ultramarin pink coloring agent (530 nm).
4. Conclusion
We have developed a simultaneous determination method of water soluble trace heavy metals in cosmetic products and coloring agents. The proposed techniques show that ion chromatography with an IonPac CS5A column and a post-column reaction system can be used for fast and accurate determination of water soluble heavy metals in cosmetic samples. Consequently, this proposed method for the simultaneous determination of heavy metals was proven to be fast and sensitive due to rare interference, which can improve the quality
Table 5. Determination of Metals in Cosmetic Products Samples Concentration (µg/mL)
Pb Fe Cu Ni Zn Co Cd Mn Eye shadow pink - 3.7 2.5 - 679.3 - - 3.9 Eye shadow blue - 66.9 - - 715.8 - - - Eye shadow yellow - 7.3 0.3 - 508.2 - - 1.7 Eye shadow purple - 2.2 - - 181.3 - - - Make up base A - 1.3 - - 173.2 - - - Make up base B - 0.5 - - 59.4 - - -
Make up base C - - - - 62.7 - - -
Foundation A - 0.8 - - 116.7 - - -
Foundation B - 2.2 - - 32.6 - - -
Foundation C - 8.4 0.5 - 88.7 - - -
Glose A - 1.1 - - 25.6 - - -
Glose B - 2.9 2.6 - 26.9 - - -
Glose C - 0.6 - - 26.6 - - -
Lip stick A - 2.4 0.4 - 24.1 - - -
Lip stick B - - - - 17.5 - - -
Lip stick C - 2.0 - - 23.5 - - -
Mascara A - 55.7 - - 27.8 - - -
Mascara B - 52.5 - - 57.3 - - -
Mascara C - 224.1 - - 68.3 - - -
Eye liner A - 342.5 - - 118.0 - - - Eye liner B - 115.7 - - 33.2 - - 9.6 Eye liner C - 683.1 - - 78.2 - - - Above were the average concentration values of 3 times injection.
control process for safe cosmetic products.
References
1. P. N. Nesterenko and P. Jones, Single-column method of chelation ion chromatography for the analysis of trace metals in complex samples, J.
Chromatogr. A, 770, 129 (1997).
2. E. Sainio, R. Jolanki, E. hakala, and L. Kanerva, Metals and arsenic in eye shadows, Contact Dermatitis, 42, 5 (2000).
3. J. Hostynek, Chromium, coblat, copper and iron:
metals in personal-care products, A dermatologic view, 115, 52 (2000).
4. H. Maibach and T. Menne, Nickel and the skin:
immunology and toxicology 1st edition, CRC press
(FL) (1989).
5. H. Kerosuo, A. Kullaa, E. Kerosuo, L. Kanerva, and A. Hensten-Pettersen, Nickel allergy in aldolescents in relation to orthodontic treatment and piercing of ears, American J. Orthodontics and Dentofacial Orthopedics, 109, 148 (1996).
6. W. Zeng, Y. Chen, H. Cui, F. Wu, Y. Zhu, and S.
J. Fritz, Single-column method of ion chromatog- raphy for the determination of common cations and some transition metals, J. Chromatography A, 1118, 68 (2006).
7. M. R. Cave, O. Butler, R. N. Chenery, J. M. Cook, M. S. Cresser, and D. L. Miles, Atomic spectrom- etry update. Environmental analysis, J. Analytical Spectrometry, 16, 194 (2001).
8. G. L. Long and J. D. Winefordner, Reduction of electronic noise in inductively coupled plasma atomic emission and fluorescence spectrometric measurements, Analytical Chemistry, 55, 1432
(1983).
9. N. Cardellicchio, S. Cavalli, P. Ragone, and J. M.
Riviello, New strategies for determination of tran- sition metals by complexation ion-exchange chro- matography and post column reaction, J. Chroma- tography A, 847, 251 (1996).
10. P. L. Buldini, S. Cavalli, A. Mevoli, and E. Milella, Application of ion chromatography to the analysis of high-purity CdTe, J. Chromatography A, 739, 131 (1996).
11. H. T. Lu, S. F. Mou, U. Uan, S. Y. Tong, and J.
M. Riviello, On-line pretreatment and determi- nation of Pb, Cu and Cd at the µgL-1 level in drink- ing water by chelation ion chromatography, J.
Chromatography A, 800, 247 (1998).
12. P. Jones, K. Barron, and L. Ebdon, A dithizone post-column detector for the high-performance liq- uid chromatographic determination of trace metals, Analytical Chimica Acta., 149, 39 (1983).