*1 Received on June 30, 2011; accepted on September 19, 2011
*2 Department of Forest Sciences, Seoul National University, Seoul 151-742, Korea
*3 Department of Forest Sciences, Research Institute for Agriculture and Life Sciences, College of Agriculture and Life Sciences, Seoul National University, Seoul 151-742, Korea
†
Corresponding author : Jun Jae Lee (e-mail: [email protected])
Evaluation of Friction Properties According to Normal Force and Direction of Wood Grain in Real Contact Area* 1
Chun-Young Park*
2, Chul-Ki Kim*
2, Hyung-Kun Kim*
2, and Jun-Jae Lee*
3†ABSTRACT
In Korea, there has been a traditional post and beam wood construction with large roof load. Because a large friction is generated in wooden joint or members, it is important to evaluate the friction between wood members according to wood direction. Because most of studies have been concerned with friction between wood and steel, excluding effect of real area of contact, there are a few studies on the friction between wood members. The object of this study was to evaluate friction or coefficient of friction accord- ing to normal force and real area of contact of wood. With Japanese larch (Larix kaempferi) test speci- mens, five steps of normal force and combinations of test were prepared. Results indicated that normal force had almost no affection on the friction, however there was difference about friction or coefficient of friction according to real contact conditions of wood grain and contact area.
Keywords : friction, coefficient of friction, real area of contact in wood, normal force, wood grain
1. INTRODUCTION
Friction can be defined a resistance force that makes it difficult for thing to move freely when they are contacting each other or moving in different direction. In case of wood, the coefficient of friction in wood is related to various factors including tree species, slope of grain, moisture content, temperature, coarseness of contacting surfaces, and loading speed[1]. However, a few studies have empirically evaluated the relative significance or roles of these factors. McKenzie and Karpovich investigated the relationship between the coefficient of friction and species
of tree, coarseness of contact surfaces, and load speed. The study showed that coefficient of friction had range of 0.1 to 0.65 according to the species of tree and roughness of contact surfaces. And as load speed increased, coefficient of friction reduced constantly. Murase measured the coefficient of friction at 0.58 for western hemlock[2], while Inayama applied estimated values of 0.4 to 0.5 for an analysis of Japanese traditional shear walls[3]. And, when performance of connection was analyzed, reference value of friction or coefficient of fiction was only used.
It might be no problem to analyze connection,
because friction did not almost occur in mecha-
(a) (b) Fig. 1. Detail drawing of joint (a) and wood frame
(b) in Han-ok.
nical fasteners of light-framed wood structure.
But Korea is not the case. Because the roof load of Han-ok which is Korean traditional wood construction, is much bigger than other type of wood construction. So friction developed in joint of Han-ok would be much bigger than that of light-framed wood structure. Further more, because joint of Han-ok is made of wood, friction could be different according to members which consist of joint. For example, friction or coefficient of friction which is developed between transverse section and radial section (straight line in dotted circle) shall differ from that which is developed between radial sections (dotted line in dotted circle), as shown in Fig. 1(a). Also, friction could arise between members (dotted line), as Han-ok is post and beam construction likes Fig. 1(b). So, it can be said that friction is very important factor in Han-ok considering with the shape of joint without any fastener and heavy vertical load.
Also, friction showed significant effect on stress distribution of the joint. Namely, stress distribution of the joint is simply distributed by compression, tension and shear according to the load when coefficient of friction is small. On the other hand, very complex analysis is required, because additional friction is distri- buted on each surface according to the coefficient of friction.
Therefore, different friction properties should be
used on each case when the direction of wood grain is diverse like traditional joint.
Results of previous researches had extensive range of friction coefficient because of moisture contents, species, surface condition, experimental error and so on. So the data did not used in structural analysis of Han-ok with various shape joints. Therefore, objective of this study is to evaluate friction properties according to the normal force and the direction of wood grain in real contact area with the specimen which are prepared exquisitely in laboratory condition.
2. MATERIALS AND METHODS 2.1. Materials
Japanese larch ( Larix kaempferi) was used to assess friction forces. Surface area of each sample was 140 × 150 (mm). Samples were manufactured using a power saw (DW 718-QS, Germany) and electric plane (2012NB, Japan) to reflect the typical character of mechanical works. The materials were cut to get target area from 2 × 6 (in.) sawn lumber. Load speed of power saw was 3,600 rpm. And then, those were planed to 30 mm thick using electric planer. Load speed of electric planer was 8,500 rpm, and feeding speed of that was 0.14 meter per second. Because temperature and humidity affect the results of friction tests, all test samples were stored at a temperature and humidity of 24°C and 65% until they showed no change in weight. Specific gravity and moisture content were assessed for all test samples and the results were 0.53, 12%, respectively.
2.2. Testing Methods
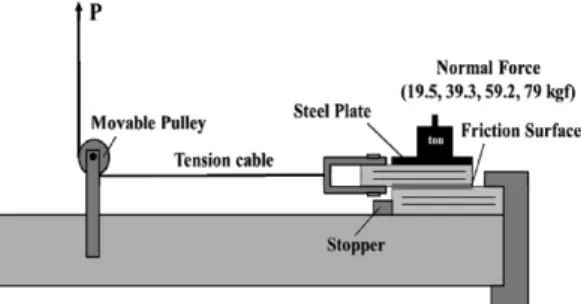
Test assembly for determining the coefficient
of friction for wood came from American
Society of Testing Materials (ASTM) D 2394,
Fig. 2. Equipment set-up for friction force experiments.
Fig. 3. Load direction relative to wood grain on con- tact surfaces.
“Standard Test Method for Simulated Service Testing of Wood and Wood-Based Finish Flooring”[4], and ASTM G 115, “Standard Guide for measuring and Reporting Friction Coefficients”[5], was used to analyze results of friction test. The equipment used for experiment is illustrated in Fig. 2. As shown in Fig. 2, us- ing pulley and tension cable, specimens were loaded by Universal Testing Machine (UTM, Zwick, Capacity: 10 ton) at the speed of 1 mm/min which is same load speed of general strength test of wood. Through UTM, load and head travel were recorded. After that, maximum static friction force, kinetic friction force were evaluated, when steady normal force (restraint force) was maintained between materials. A normal force which was divided into four stages was applied constantly using a balance weight.
To apply uniform load to materials, the balance weight was installed on a steel plate which was made in same scale of friction surface size.
As shown in Fig. 3, the friction surfaces were divided into three segments depending on the direction of wood according to load direction:
L
LR(longitudinal direction on LR plane), R
LR(radial direction on LR plane), R
RT(radial direction on RT plane). Five combinations were used: L
LR-L
LR, L
LR-R
LR, L
LR-R
RT, R
LR-R
LRand R
LR-R
RT. As mentioned above, these are all case of combinations that can be occurred in joint or between members of Han-ok. For each case,
testes were repeated five times.
During loading, maximum static friction forces were estimated when test samples started moving.
And kinetic friction forces were estimated during test samples were moving. Then, the coefficient of friction was calculated as follows.
F = µN (1)
F: Friction Force
µ: Coefficient of Friction N: Normal Force
The maximum static friction force and kinetic friction force showed difference according to the friction force-sliding distance curve patterns.
Fig. 4 shows the common friction curve, and F and F ' indicate maximum static friction force and kinetic friction force, respectively. In Figs.
4(a) and 4(b), kinetic friction force was deter- mined by calculating the average maximum and minimum values. But in Fig. 4(c), the maximum static friction force remained unclear. In this study, kinetic friction forces were calculated by average maximum and minimum values, because only repetitive stick-slip events (as shown in Fig. 4(a)) were observed.
During stick-slip, digital camera was used to
(a) (b) (c) Fig. 4. Friction patterns of friction force and sliding distance curve.
Fig. 5. A set of specimens with tape-measure.
Table 1. Average displacement and annual ring width during stick-slip in LLR-RLR combination
Number D
D.Ca(mm) Annual ring width (mm)
1 0.89 6.57
2 0.79 6.31
3 0.44 6.03
4 0.38 3.36
5 0.46 9.92
a