Automatic False-Alarm Labeling for Sensor Data
1)
전체 글
1)
수치
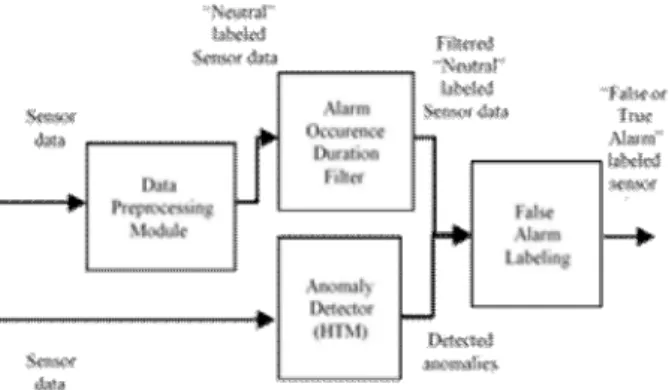
![Fig. 2 shows the architecture of the cloud-based predictive maintenance system developed in our previous work [17]](https://thumb-ap.123doks.com/thumbv2/123dokinfo/5314998.384047/2.892.460.806.610.824/shows-architecture-cloud-based-predictive-maintenance-developed-previous.webp)
관련 문서
Existing method has applied the size of the target to the virtual character by measuring manually, but now using Kinect sensor the motion data file can
• Program Context-Aware Data Separation Technique – Predicts update times of data based
○ Furthermore along with obtaining fundamental data on power network system in Korea and related-data on demand, supply, transmission of Russia and North
The purpose of the study is to develop a sensor data collection and monitoring system with database using IoT techrology and to apply the ststem to three
Procedure for creating the equipment failure rate data segment of a CPQRA analysis data base. Define
XML - basic foundation, provides a language for defining data & method of processing them SOAP(Simple Object Access Protocol) - a collection of XML based rules
AUTOMATIC WEATHER
For the system development, data collection using Compact Nuclear Simulator, data pre-processing, integrated abnormal diagnosis algorithm, and explanation

