Altered Thoracic Cage Dimensions in
Patients with Chronic Obstructive Pulmonary Disease
Su Jin Lim, M.D.
1, Ju-Young Kim, M.D.
2, Seung Jun Lee, M.D.
3, Gi Dong Lee, M.D.
2, Yu Ji Cho, M.D.
3, Yi Yeong Jeong, M.D.
3, Kyung Nyeo Jeon, M.D.
4, Jong Deog Lee, M.D.
3, Jang Rak Kim, M.D.
5and Ho Cheol Kim, M.D., Ph.D.
21
Department of Internal Medicine, Masan Medical Center, Masan,
2Department of Internal Medicine, Gyeongsang National University Changwon Hospital, Gyeongsang National University School of Medicine, Changwon,
3Department of Internal Medicine, Gyeongsang National University Hospital, Gyeongsang National University School of Medicine, Jinju,
4Department of Diagnostic Radiology, Gyeongsang National University Changwon Hospital, Gyeongsang National University School of Medicine, Changwon,
5Department of Preventive Medicine, Gyeongsang National University School of Medicine, Jinju, Korea
Background: Chronic obstructive pulmonary disease (COPD) may cause changes in the shape of the thoracic cage by increasing lung volume and hyperinflation. This study investigated changes in thoracic cage dimensions and related factors in patients with COPD.
Methods: We enrolled 85 patients with COPD (76 males, 9 females; mean age, 70.6±7.1 years) and 30 normal controls.
Thoracic cage dimensions were measured using chest computed tomography at levels 3, 6, and 9 of the thoracic spine.
We measured the maximal transverse diameter, mid-sagittal anteroposterior (AP) diameter, and maximal AP diameter of the right and left hemithorax.
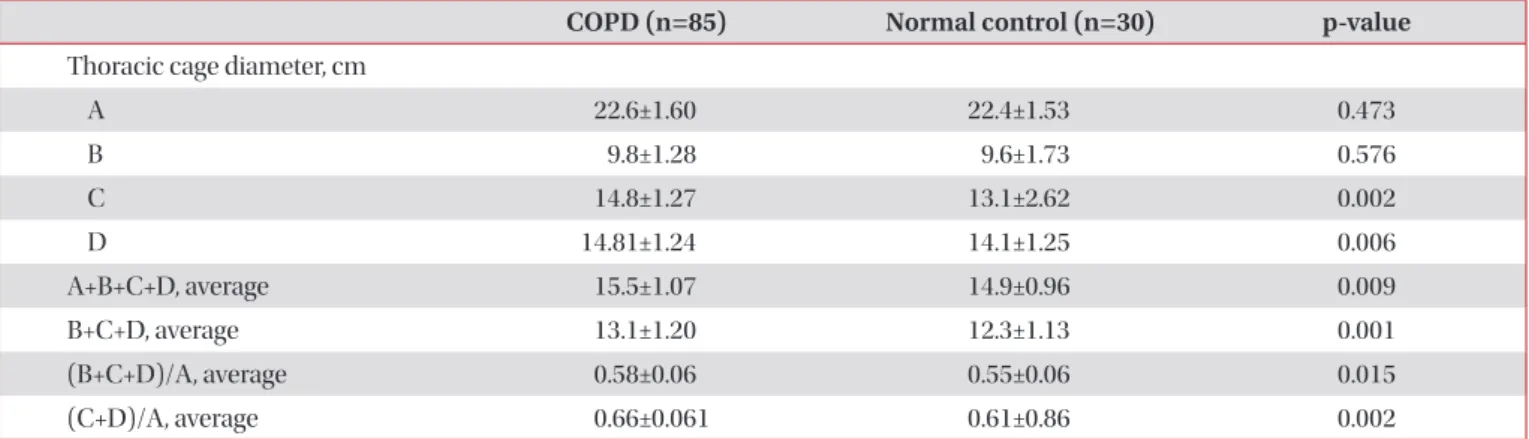
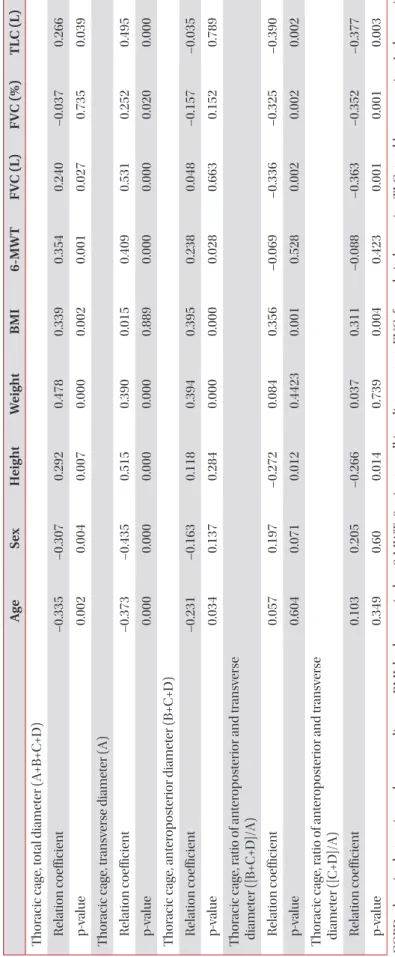
Results: The average AP diameter was significantly greater in patients with COPD compared with normal controls (13.1±2.8 cm vs. 12.2±1.13 cm, respectively; p=0.001). The ratio of AP/transverse diameter of the thoracic cage was also significantly greater in patients with COPD compared with normal controls (0.66±0.061 vs. 0.61±0.86; p=0.002). In COPD patients, the AP diameter of the thoracic cage was positively correlated with body mass index (BMI) and 6-minute walk test distance (r=0.395, p<0.001 and r=0.238, p=0.028) and negatively correlated with increasing age (r=–0.231, p=0.034).
Multiple regression analysis revealed independent correlation only between BMI and increased ratio of AP/transverse diameter of the thoracic cage (p<0.001).
Conclusion: Patients with COPD exhibited an increased AP diameter of the thoracic cage compared with normal controls. BMI was associated with increased AP diameter in these patients.
Keywords: Pulmonary Disease, Chronic Obstructive; Rib Cage; Tomography, X-Ray Computed
Address for correspondence: Ho Cheol Kim, M.D., Ph.D.
Department of Internal Medicine, Gyeongsang National University Changwon Hospital, Gyeongsang National University School of Medicine, 11 Samjeongja-ro, Seongsan-gu, Changwon 51472, Korea
Phone: 82-55-214-3730, Fax: 82-55-214-8618, E-mail: [email protected]
Received: Aug. 14, 2017, Revised: Nov. 21, 2017, Accepted: Nov. 21, 2017, Published online: Mar. 7, 2018
cc It is identical to the Creative Commons Attribution Non-Commercial License (http://creativecommons.org/licenses/by-nc/4.0/).
Copyright © 2018
The Korean Academy of Tuberculosis and Respiratory Diseases.
Introduction
Chronic obstructive pulmonary disease (COPD) is char- acterized by progressive, incompletely reversible airflow obstruction, and enhanced chronic inflammatory responses to noxious particles or gases in the airways and lungs
1. In a significant proportion of patients with COPD, reduced lung elastic recoil combined with expiratory flow limitation eventu- ally leads to lung hyperinflation with progression of disease
2. Increased lung volume and hyperinflation may cause changes in the shape of the thoracic cage in COPD patients. Therefore, it has been traditionally accepted that COPD patients exhibit increased thoracic cage dimensions, especially anteroposte- rior (AP) diameter, leading to a circular, “barrel-chest” appear- ance due to increased lung volume and hyperinflation
3-8.
Despite these findings, previous investigations examining changes in the thoracic cage of COPD patients have reported varying results. Studies measuring the diameter of the thorax have reported no differences in terms of total lung capacity (TLC) and residual volume (RV) between patients with em- physema and healthy subjects
8,9. Other studies have reported an increase in the AP diameter of the thorax in patients with COPD compared with normal subjects, especially in the lower part of the thoracic cage, when examined at the level of functional residual capacity
10. We hypothesized that because changes in the shape of the thoracic cage in the normal popu- lation can be affected by various factors such as height, weight, age and sex
11-13, these changes in COPD patients may be more complex than initially believed.
The primary objective of this study, therefore, was to evalu- ate changes and differences in thoracic cage dimensions of patients with COPD compared with normal controls using chest computed tomography. Our secondary objective was to investigate the factors associated with changes in thoracic cage dimensions in patients with COPD.
Materials and Methods
1. Study population and data collection
Patients with stable COPD, who visited the department of outpatient pulmonology, were reviewed. COPD was defined as incompletely reversible airflow, and post-bronchodilator forced expiratory volume in 1 second (FEV
1) to forced vital capacity (FVC) ratio <0.7 in patients with symptoms includ- ing dyspnea, cough, and productive sputum. The severity of COPD was classified according to post-bronchodilator FEV
1, based on the spirometric guidelines of the Global Initiative for Chronic Obstructive Lung Disease (GOLD)
1: stage 1 (FEV
1≥80%), stage 2 (50%≤FEV
1<80%), stage 3 (30%≤FEV
1<50%), and stage 4 (FEV
1<30% or FEV
1≤50% plus chronic respiratory failure). Patients with underlying lung disease, such as bron-
chiectasis, lung cancer, interstitial lung disease and fibrotho- rax, and those with co-existing deformity of the thoracic cage were excluded. The normal control group comprised individ- uals who visited general health clinics and underwent a chest computed tomography (CT) scan and had normal spirometry results. Age- and sex-matched healthy individuals were en- rolled as normal controls. Body mass index (BMI)-matched control subjects were recruited because of the influence of height and weight on thoracic cage dimensions. Individuals in the control group with any history of lung disease were ex- cluded.
Clinical characteristics and demographic data, including smoking history and pulmonary function, were retrospec- tively collected by chart review. Given the retrospective nature of the study and the use of anonymized data, requirements for informed consent were waived. This study was approved by the Institutional Review Board of the Gyeongsang National University Changwon Hospital (GNUCH-2017-09-002).
2. Pulmonary function testing and 6-minute walk test distance
Spirometric testing was performed in accordance with criteria published by the American Thoracic Society and the European Respiratory Society
14. FEV
1and FVC were calcu- lated from the flow-volume curve using a spirometer (Jaeger, Würzburg, Germany). The highest value from at least three independent measurements was recorded. Lung function parameters were expressed as a percentage of the reference values. Exercise performance was based on a standardized protocol and measured using the distance covered in the 6-minute walk test (6-MWT)
15.
3. Measurement of thoracic cage dimensions using chest CT
Thoracic cage diameters were measured using chest CT and a modified method based on a previous report
16. Thoracic cage diameters were measured it at three anatomical levels (thoracic vertebrae level 3, 6, and 9) because measurement at one anatomical level may result in error(s). The measure- ments were performed by one professor of the diagnostic radiology department, who performed three measurements at different times at each thoracic level and averaged the data.
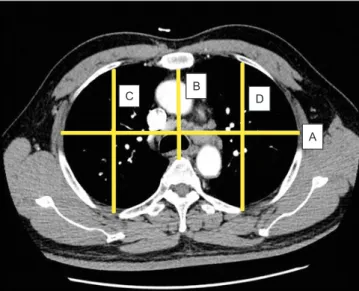
For each thoracic segment, several thoracic cage diameters were measured using an electronic caliper at CT scan. The maximal transverse diameter (A), mid-sagittal AP diameter (B), the maximal AP diameter of the right (C), and left hemi- thorax (D) were measured (Figure 1).
4. Statistical analysis
The data are presented as mean±standard deviation or as
number (%). Continuous variables and categorical variables were compared using an unpaired t test, and the groups were compared using Pearson’s chi-square test. Pearson correlation analysis was performed to evaluate relationships between clinical parameters, pulmonary function, and thoracic cage di- ameter; p<0.05 was considered to be statistically significant for all tests. Univariate and multivariate linear or logistic regres-
sion analyses were performed to evaluate factors associated with change(s) in thoracic cage dimensions. Factors found to be significant at the p<0.2 level in the univariate analysis, and factors considered to be significant were subjected to back- ward-step linear or logistic multivariate analysis. Values that reached a p<0.05 level of significance were considered to be significant. All statistical analyses were performed using SPSS version 22.0 (IBM Corp., Armonk, NY, USA) for Windows (Mi- crosoft Corporation, Redmond, WA, USA).
Results
1. Baseline characteristics of COPD patients and normal controls
The basic characteristics of patients with COPD and con- trols are summarized in Table 1. Eighty-five patients (76 male, 9 female; mean age, 70.6±7.1 years) with COPD, and 30 in- dividuals (23 male, 7 female; mean age, 69.9±4.2 years) with normal lung function (control group) were included in this study. There were no significant differences in male ratio, age, weight, height, or BMI between COPD patients and controls.
The proportion of non-smokers was higher in controls than in the COPD group. The mean FEV
1in COPD patients was 56.2%, which was approximately one-half of the value in con- trols.
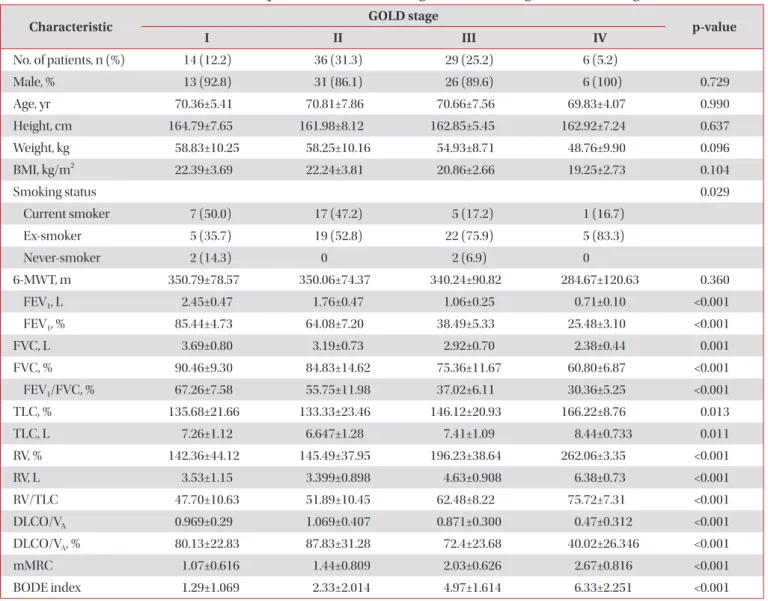
Most patients with COPD were categorized as GOLD stage 2 (n=36, 31.3%) and GOLD stage 3 (n=29, 25.2%). There were no differences in the proportion of males, age, BMI, and 6-MWT distance according to COPD GOLD stage. The pro- portion of current and ex-smokers was higher in GOLD stage
Table 1. Baseline clinical characteristics of patients with COPD and normal controls
Characteristic COPD (n=85) Normal control (n=30) p-value
Male, % 76 (89.4) 23 (76.7) 0.083
Age, yr 70.6±7.1 69.9±4.2 0.623
Height, cm 162.9±7.24 160.7±8.9 0.639
Weight, kg 56.5±9.90 59.1±7.86 0.154
BMI, kg/m
221.6±3.44 22.5±2.87 0.186
Smoking status, n (%) 0.010
Current smoker 30 (35.3) 10 (33.3)
Ex-smoker 51 (60) 13 (43.3)
Non-smoker 4 (4.7) 7 (23.3)
Smoking, pack-years 41.7±18.25 24.2±21.97 0.001
FEV
1, L 1.6±0.66 2.5±0.57 <0.001
FEV
1, % 56.2±19.49 105.3±23.54 <0.001
FEV
1/FVC, % 49.5±15.23 77.4±5.71 <0.001
COPD: chronic obstructive pulmonary disease; BMI: body mass index; FEV
1: forced expiratory volume in 1 second; FVC: forced vital capacity.
Figure 1. Example illustrating the thoracic cage dimensions. A, the maximal transverse diameter (from the most external midpoint of the rib of one side to the opposite one); B, mid-sagittal anteroposte- rior diameter (from the inner surface of the sternum to ventral sur- face of the vertebral body); C and D, the maximal anteroposterior diameters of the right and left hemithorax (from the ventral-most point to the dorsal-most point of the rib cage in each hemithorax).
A
C B D