—
ISSN 1229-3350(Print) ISSN 2288-1867(Online)
—
J. fash. bus. Vol. 22, No. 3:39-56, July. 2018 https://doi.org/
10.12940/jfb.2018.22.3.39
Interpersonal Trust Online
Soo-kyoung Ahn
†Dept. of Clothing and Textiles/ Research Institute for Human Ecology, Chonnam National University, Korea
Corresponding author
—
Soo-kyoung Ahn Tel : +82-62-530-1348 E-mail: [email protected]
Keywords Abstract
online segmentation, interpersonal trust, trust in e-tailers,
clothing consumption values, review reading
-
This study was supported by the research grant (2017-0223) of Chonnam National University in 2017.
Since trusting in other consumers may refer to having similar needs and preferences on fashion goods with them, interpersonal trust can be a reliable and practical criterion for market segmentation online. Therefore, this study aims to identify fashion online consumers based on interpersonal trust. This study segments fashion consumers based on interpersonal trust and experience and describes characteristics of each segment by examining demo-psychographic and behavioral variables as well as clothing consumption values. An online survey was conducted to collect data from 426 adult consumers who had bought fashion goods from their patronized e-tailer in the past one month.
They completed a self-administered questionnaire inquiring about interpersonal
trust, trust in e-tailers, purchase intentions, clothing consumption values, and
their purchasing behavior online. Two-step cluster analysis generated four
segments: distrustful doers, trusting doers, inactive trusters, and distrusters .
They exhibited different characteristics in gender, online experiences,
interpersonal trust, clothing consumption values, trust in the e-tailers, and
attitude toward the e-tailers. Providing a new effective segmentation base, this
study suggests that fashion marketers identify customers with a high level of
trust in other customers and develop an encouraging environment that
customers can interact with others in order to increase the effectiveness of
trust. Because customers with a higher level of interpersonal trust are likely to
have stronger trust in e-tailers with, more favorable attitude and purchase
intention, and highly perceive the value of clothing consumption than those
who have a lower level of interpersonal trust.
I. Introduction
Consumers are becoming more active and intelligent armed with smart technologies and social networks. They actively search information from the various online sources and carefully compare conditions of purchase such as price, delivery, or other benefits across e-tailers.
During the research process, consumers easily access other consumers’ experiences and reviews of products or services through blogs, SNS, or review boards on the e-tailers’ sites and are likely to make a purchase decision on the basis of these subjective and individual judgements. In short, unlike offline context, their decision making can be influenced by not only marketers’
strategic efforts but also other consumers’ behaviors such as product reviews or evaluations (Ahn, 2017).
Particularly, a consumer who are purchasing fashion goods online tends to depend on other consumers’
evaluations on fit on body, size or texture which is not only an important buying criterion but also an ascertainable condition only through experience. Since a subsequent decision is based on the subjective and individual judgements, trusting in other consumers may refer to having similar needs and preferences on fashion goods with them. Furthermore, previous research proved that the trust in other consumers influenced on trust in the e-tailers resulting in the behavioral intent to purchase (Ahn, 2017). Therefore, interpersonal trust can be a more reliable and practical criterion for online market segmentation. With the increasing e-commerce sales worldwide, it is important for companies to identify the potential customers and understand their characteristics related to online shopping. Although there have been many attempts to develop the typologies of online consumers from diverse perspectives, relatively little attention has been paid to interpersonal trust as an emerging feature of online consumers in segmentation studies, especially in the fashion retailing field.
Considering the huge portion of internet users who have ever purchased fashion related products (Statista, 2017), it is necessary to develop diverse segmentation variables to identify better-defined target segments and descriptive
variables to understand their online-specific characteristics in online fashion retailing.
Therefore, this study aims to identify fashion consumers based on how they trust in other consumers, namely interpersonal trust. First, this study segments fashion consumers based on the interpersonal trust and review reading experience, and second, describes the characteristics of each segment by examining demo-psychographic and behavioral variables related to clothing purchase online and clothing consumption values.
II. Literature Review 1. Online market segmentation
Market segmentation is a critical process for a successful marketing planning and management. Since potential customers with homogeneous attributes such as characteristics, wants, and needs may exhibit similar responses to a company’s marketing mix, dividing a whole market into smaller units that share some specific commonalities increases the odds for a fashion marketer to focus on the right group of prospects (Rath, Petrizzi,
& Grill, 2012). With the increasing number of online purchases, it is important for companies to identify the potential customers and understand their characteristics related to shopping. Hence, there have been many attempts to develop the typologies of online consumers from diverse perspectives. Choosing segmentation bases is the first step of market segmenting process. A marketer has to try different segmentation variables, alone and in combination, to find the best way to view the market structure (Kotler & Armstrong, 2018). Geographic, demographic, psychographic, and behavioral variables are universally accepted as major segmentation bases.
Geographic segmentation divides a market into different
geographical units based as nations, regions, or
population density. Demographic variables such as age,
gender, income, occupation, or education are the most
popular bases for segmentation because consumer needs,
wants and usage rates often vary closely with them
(Kotler & Armstrong, 2018). These segments can be easily identified and the degree to which they can be reached by. However, demographics may not be useful for defining segments for some retailers because the motivations for purchasing transcend simple demographics (Levy, Weits, & Grewal, 2012). Psychographic segmentation involves grouping people in terms of their social class, attitudes, values, lifestyles, or personality traits (Keegan & Green, 2017). Behavioral segmentation is conducted based on consumer knowledge, uses, responses to products, benefits sought, user status, or usage rate (Kotler & Armstrong, 2018). Though there is no standard or preferred method to divide a market, studies on online segmentation are inclined toward psychographic and behavioral variables. The most prevalent bases for online segmentation are psychographic variables including values (Cholachatpinyo 2013; Yin, Yu, & Hwang, 2016), lifestyle (Kim, 2005; Pandey, Chawla, & Venkatesh, 2015; Swinyard & Smith, 2003) and personality (Barnes, Bauer, Neumann, & Huber, 2007), and behavioral variables such as internet use patterns (Aljukhadar & Senecal, 2011; Kim, 2008; Lee
& Kim, 2002), benefit sought (Bhatnagar & Ghose, 2004; Wu, 2001), and motivations (Brown, Pope, &
Voges, 2003; Ha & Stoel, 2010; Jayawardhena, Wright,
& Dennis, 2007; Rohm & Swaminathan, 2004;
Vrechopoulos, Siomkos, Doudikis, 2001). In the online fashion retailing domain, psychographic and behavioral variables such as values, motives, behavioral intentions, benefit sought, and product attributes evaluations were used as segmentation bases as well (Cholachatpinyo 2013; Ha & Stoel, 2010; Kim, 2008; Lee, 2008; Park &
Lee, 2009; Yin et al., 2016). Although it is not simple to choose segmentation variables, marketers rarely limit their segmentation analysis to only one or a few variables. Rather, they are increasingly using multiple segmentation bases (Kotler & Armstrong, 2018). This can be interpreted that it is necessary to develop diverse segmentation variables to identify better-defined target segments. Moreover, given the significant growth in online fashion retailing, online marketers needs to understand online-specific characteristics of consumers.
For examples, many online consumers read and write product reviews during their shopping. Unlike offline context, their decision making can be influenced by not only marketers’ strategic efforts but also other consumers’ behaviors such as product reviews or evaluations (Ahn, 2017). Therefore, this study take interpersonal trust tendency and review reading behavior as segmentation bases.
2. Interpersonal trust online and consulting behavior
Many researchers and practitioners have paid attention to trust as a key element to increase purchasing by reducing the complexity and perceived risks of purchase (Walczuch & Lundgren, 2004). Specifically, interpersonal trust between consumers seems to be to the fore in the online retailing environment. Interpersonal trust online is the propensity to rely on other consumers’ opinions through blogs, review boards, or SNS despite the lack of personal interactions and the difficulty in recognizing individual consumers (Ahn, 2017). When consumers make decisions to buy, they concern how other consumers view the e-tailer and its offerings as well as whether transactions are reasonable or websites are secure. They search, learn, and share information on these by referring to others’ opinions from diverse online sources. Hence, a consumer’s decision making can be influenced by other consumers’ behaviors such as product reviews, comments or evaluations (Barreda, Bilgihanm &
Kageyama, 2015), and then she or he may produce
another word-of-mouth or review, which leads to an
impact on another consumer’s decision (Ahn, 2017). Ahn
(2017) defined interpersonal trust online with five
constructs which are benevolence, peer identification,
ability, integrity, and shared lifegoals based interpersonal
trust. Benevolence based interpersonal trust is a belief
that other customers have a good will when they post
reviews on the site. Peer identification refers to the
feeling that you are connected with other customers on
the site and integrity means the quality of other
customers that inspire reliability. Ability represents a
confidence that other customers are competent in the
market and products, and shared lifegoals represents how much a customer perceive the similar lifegoals and values of other customers.
Particularly in shopping apparel goods, other consumers’ subjective judgements such as evaluations on fit on body, size, color or texture which are based on individuals’ preferences, would be helpful for making decisions. In sum, consulting other customers’ product reviews means that the information seeker may understand, appreciate and share similar desires and intentions with others (Ahn, 2017). Therefore, consulting behavior like reading product reviews and interpersonal trust how a consumer trusts in other consumers may be good indicators to segment fashion consumers online.
3. Clothing consumption values as segmentation descriptive variables
Consumer values embody consumers’ priorities and preferences about their life goals, and how products can help them attain these goals (Kardes, Cronley, & Cline, 2015). Relating to consumer choice, Sheth, Newman, and Gross (1991) identified five consumption values with functional value, conditional value, social value, emotional value, and epistemic value. These multiple consumption values are independent and make differential contributions in any given choice situation (Sheth et al., 1991). Applied to apparel products, clothing consumption values can explain why consumers choose buy or not buy apparel products closely relating to product evaluations and store choices. Based on the consumption value theory, many researchers have adapted and generated clothing consumption values in the fashion business realm. For examples, Kim and Lim (2001) drew six clothing consumption values comprising functional value, social value, emotional value, epistemic value, conditional value and self-expressive value from the interview data, and Ryou (2002) identified fashion value, functional value, social value, emotional value, and personality value which directly influenced on the service quality of internet shopping mall. Lim (2007) examined the relationships between general values and clothing
consumption values with seven dimensions such as fashion value, functional value, satisfactory value, socially symbolic value, conditional value, self-expressive value, and attractive value. Meanwhile, clothing consumption values were confirmed to influence on various consumer behaviors such as ambivalent consuming behavior (Moon
& Choo, 2008), involvement (Lim, 2005), satisfaction (Park & Lee, 2003), product, store or service quality evaluations (Park, Park, & Lee, 2014; Park & Yoo, 2012; Ryou, 2002), and even disposal behavior (Ahn, 2016). Furthermore, clothing consumption values were different across groups by specific criteria such as geographic variables (Park & Rabolt, 2009) and marital status and age (Lee, 2010). To sum up, clothing consumption values can be reliable descriptor to explain consumer characteristics as well as good indicators to anticipate consumer behaviors.
4. Other descriptive variables
In order to describe segments’ characteristics, diverse descriptive variables have been used in accordance with given contexts or business categories. Similar to the segmentation bases, these are classified into three groups:
demographic, psychographic, and behavioral variables.
Even though there has been doubts about the unabated impact of demographics on consumer behavior online, demographic variables are still the most prevalent descriptors. Gender, education level, age, and income are the most commonly used variables (Aljukhadar &
Senecal, 2011; An & Lee, 2015; Bhatnager & Ghose, 2004; Bressolles, Durrieu, & Senecal, 2014; Kau, Tang,
& Ghose, 2003; Kim, 2008; Lee, 2008; Lee & Kim, 2002; Pandey, Chawla, & Venkatesh, 2015; Swinyard &
Smith, 2003; Wu, 2001; Vrechopoulos et al., 2001; Yin
et al., 2016). As many marketers believe that behavioral
variables are the best starting point for building market
segments (Kotler & Armstrong, 2018), many variables
such as internet or computer usage, buying intention,
shopping style, satisfaction, experience, knowledge of
product, loyalty, and benefit sought are used to describe
the characteristics of segments (Aljukhadar & Senecal,
2011; An & Lee, 2015; Barnes et al., 2007; Bhatnager
& Ghose, 2004; Bressolles et al., 2014; Karimi, Papamichail, & Holand, 2015; Kim, 2005; Lee & Kim, 2002; Mathwick, 2001; Wu, 2001; Vinerean, Cetina, &
Dumitrescu, 2013). In comparison with these two variables, fewer studies have used psychographic variables including lifestyle, internet self-efficacy perception, personality, self-concept, innovativeness, and internet opinion leadership (Aljukhadar & Senecal, 2011; Barnes et al., 2007; Lee & Kim, 2002; Swinyard & Smith, 2003). Good market segmentation refers to that each segment should be distinctive from one another and consist of consumers with homogeneous characteristics in terms of marketing variables. Selecting right variables to identify consumer profiles is as imperative as choosing segmentation bases. Therefore, this study take demographic variables ( i.e. , age, gender, occupation, income, and education level), behavioral variables ( i.e. , buying behavior, online shopping experiences, and purchase intention), and psychographic variables ( i.e. , clothing consumption values and trust) in order to define segments’ characteristics.
III. Research Methods
Data were collected from a sample of nation-wide panels in Korea through online survey conducted by a professional survey company. A total of 426 adult consumers who had bought fashion goods from their patronized e-retailer in the past one month completed a set of self-administered questionnaires which enquired about interpersonal trust, trust in the e-tailers, purchase intentions, clothing consumption values, and their purchasing behavior online. Measures were adapted and modified based on existing scales from the literature. A preliminary test with a sample of 118 adults was conducted to obtain validity for the main test. In order to measure the interpersonal trust 20 items (Ahn, 2017) were used. Trust in e-tailer was assessed with 10 items which removed two overlapping items evaluating trust in other customers from the original scales of Gefen and Straub (2004). To measure clothing consumption values
27 items were used (Kim & Lim, 2001; Ryou, 2002;
Sheth et al., 1991). In addition, respondents were asked to answer general demographic questions, their online purchase behavior, purchase intention and attitude toward the e-tailer (Ahn, 2017). All variables except demographics and purchase behavior questions were measured using six-point Likert type scales with anchors strongly agree (6) and strongly disagree (1) to avoid a neutral or ambivalent answer.
This study employs a confirmatory factor analysis (CFA) to validate the measures and a two-step cluster (TSC) analysis that can reveal natural clusters within a data set based on both continuous and categorical variables to create a typology of consumers. A series of one-way ANOVA, Chi-square test and descriptive analysis verifies the differences across clusters and describes the characteristics of each cluster by using SPSS 23.0.
The respondents who aged 20 to 49 were divided into three age groups and each group was allocated around 33.3% of respondents. 51.4% of respondents were females (n=219) and 48.6% were male respondents (n=207). The majority of the respondents were employed (n=296, 69.5%) and university graduate (n=278, 65.3%).
They monthly earn an income ranged from ₩ 2,000,000 to ₩ 4,000,000 (n=168, 39.4%) and monthly spend 100,000 to 250,000 (n=195, 45.8%) on shopping
₩ ₩
fashion goods via internet or mobile devices (n=290, 68.1%). The types of their most patronized e-tailer were open markets (n=135, .31.7%) such as ‘11st’ (n=92, 21.6%) and ‘G market’ (n=38, 8.9%) and social commerces (n=35. 8.2%) such as ‘Coupang’ (n=14, 5.7%) and ‘Wemakeprice’ (n=11, 2.6%) respectively. 172 respondents (40.4%) had read the product review board and 145 respondents (34%) had searched information on apparel products including price information before making a purchase decision.
IV. Results
1. Measurement confirmations
Prior to clustering, CFA validated the five constructs of interpersonal trust measures with 20 indicators (See Appendix 1). The χ
2of 330.704 ( df =158, p = .000; χ
2
/df =2.093), NFI of .941, CFI of .968, and RMSEA of .051 supported a good model fit. All items loaded significantly (t-value>1.96) on their corresponding latent constructs indicating that convergent validity was obtained, composite reliabilities ranged from .704 to .913, AVEs ranged from .519 to .677, and the squared correlation between each pair of constructs did not exceed square root of AVE. Therefore, discriminant validity was obtained.
Removing three items with a low communality or cross-loadings, exploratory factor analysis revealed seven constructs of clothing consumption values with 24 items (See Appendix 2). They are suitability value (32.996% of variance, Cronbach α =.836) that clothes should fit for my circumstances such as social status, job, groups where I belong to, or specific occasions, practical value (15.796% of variance, Cronbach α =.835) which refers to usefulness of clothes including durability, easy maintenances, or comfortability, and uniqueness value (6.052% of variance, Cronbach α =.896) which clothes differentiate me from others. Enjoyment value (5.749% of variance, Cronbach α =.846) denotes that clothes bring me a feeling of happiness or diversion, social value (5.406% of variance, Cronbach α =.853) is associated with specific socioeconomic groups, appearance value (6.052% of variance, Cronbach α =.896) means the quality of improving my appearance, and fashionability value (6.659% of variance, Cronbach α =.841) which represents the state of enjoying widespread approval.
CFA confirmed the seven constructs of clothing consumption values with the acceptable model fits ( χ
2
=661.873, df =228, p =.000; χ
2/df =2.903; NFI=.895;
CFI=.928; RMSEA=.067). All items loaded significantly (t-value>1.96) on their corresponding latent constructs indicating that convergent validity was obtained, composite reliabilities ranged from .640 to .899, AVEs ranged from .531 to .747, and the squared correlation between each pair of constructs did not exceed square root of AVE obtaining discriminant validity.
2. Clustering consumers
A TSC analysis was conducted on the basis of interpersonal trust as continuous variables and experience of reading reviews as categorical variable. Combining both the changes in Bayesian Criterion (BIC) and the ratio of distance measures, the auto-clustering algorithm generated a four-cluster solution as the optimal number of clusters (BIC change=-143.485, the ratio of distance measures=2.211). The silhouette value which presents how well each case lies within its own cluster compared to other clusters is 0.4, which is acceptable.
Cross-validation with randomly splitting cases into two subgroups ( n
sub1=221, n
sub2=206) empirically confirmed the cluster solution. Cluster one is the largest cluster containing 172 cases (40.4%) and cluster two encompasses 107 cases (25.1%). Cluster three (n=79) and cluster four (n=68) correspond to 18.5% and 16.0% of the total cases respectively.
3. Identifying clusters
A series of one-way ANOVA and Chi-square test examined the differences in mean scores across the clusters in terms of interpersonal trust, trust in e-tailers, clothing consumption value, purchase behavior and demographics.
First, the five constructs of interpersonal trust as dependent variables and the four clusters as independent variables were used. The result of one-way ANOVA indicated that the respondents’ values of identification ( F =101.337, p =.000), integrity ( F =74.234, p =.000), benevolence ( F =122.034, p =.000), ability ( F =104.353, p =.000), and shared life-value ( F =94.371, p =.000) significantly differed across the groups (Table 2). The results of Scheff é post hoc tests showed that all dimensions of interpersonal trust of cluster 1 and 4 were significantly lower than cluster 2 and 3 that were not significantly different. Cluster 1 presented the lowest values of interpersonal trust (Table 1).
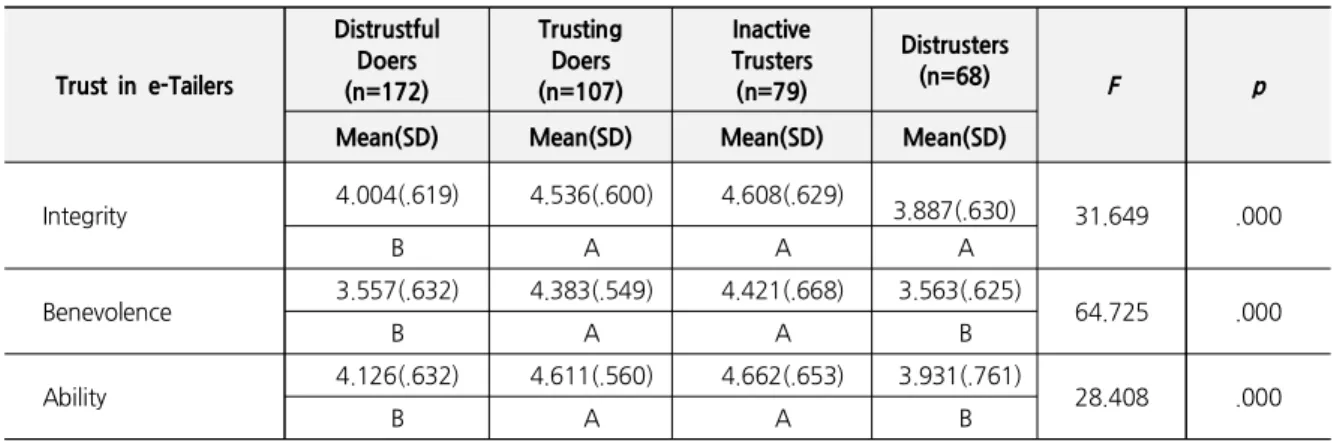
Second, ANOVA tests compared the values of trust in
e-tailers across the clusters. The respondents in each
Table 1. Interpersonal Trust of Clusters
Interpersonal Trust
Distrustful Doers (n=172)
Trusting Doers (n=107)
Inactive Trusters (n=79)
Distrusters
(n=68) F p
Mean(SD) Mean(SD) Mean(SD) Mean(SD)
Identification 2.288(.823) 3.712(.784) 3.747(.875) 2.309(.930)
101.337 .000
B A A B
Integrity 3.552(.631) 4.320(.576) 4.310(.580) 3.235(.603)
74.234 .000
B A A C
Benevolence 3.469(.551) 4.365(.448) 4.346(.538) 3.123(.651)
122.034 .000
B A A C
Ability 3.551(.579) 4.428(.476) 4.392(.518) 3.224(.707)
104.353 .000
B A A C
Shared life goal 3.190(.795) 4.243(.535) 4.237(.620) 2.875(.789)
94.371 .000
B A A C
st hoc: Scheffé test
Table 2. Trust in e-Tailers across Clusters
Trust in e-Tailers
Distrustful Doers (n=172)
Trusting Doers (n=107)
Inactive Trusters (n=79)
Distrusters
(n=68) F p
Mean(SD) Mean(SD) Mean(SD) Mean(SD)
Integrity 4.004(.619) 4.536(.600) 4.608(.629)
3.887(.630) 31.649 .000
B A A A
Benevolence 3.557(.632) 4.383(.549) 4.421(.668) 3.563(.625)
64.725 .000
B A A B
Ability 4.126(.632) 4.611(.560) 4.662(.653) 3.931(.761)
28.408 .000
B A A B
Post hoc: Scheffé test
cluster differently valued integrity of the e-tailer ( F =31.649, p =.000), benevolence of the e-tailer ( F =31.649, p =.000), and the e-tailer ( F =31.649, p =.000).
The results of Scheff é post hoc tests displayed that cluster 2 and 3 that were not different from each other valued three dimensions of trust in the e-tailer which was higher than cluster 1 and 4. The results are shown in Table 2.
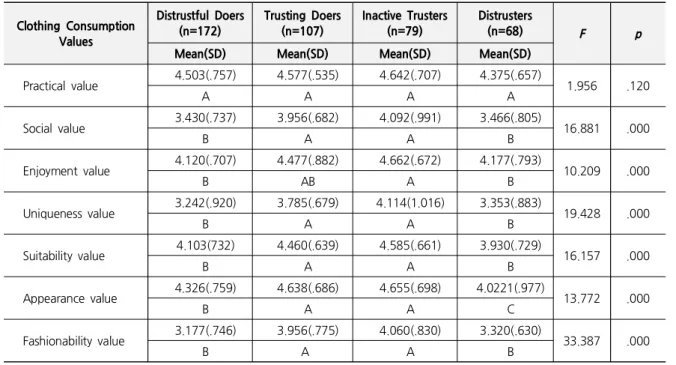
Third, the one-way ANOVA compared the levels of seven constructs of clothing consumption values across
the clusters. The results showed that each cluster
differently evaluated six clothing consumption values,
whereas there was no significant difference of practical
values across the clusters. Same as above, cluster 2 and
3 scored higher levels of six clothing consumption values
than cluster 1 and 4. Scheff post hoc tests showed that é
cluster 3 which scored the highest levels of six clothing
consumption values did not differ significantly from
cluster 2 (Table 3).
Table 3. Clothing Consumption Values across Clusters
Clothing Consumption Values
Distrustful Doers (n=172)
Trusting Doers (n=107)
Inactive Trusters (n=79)
Distrusters
(n=68) F p
Mean(SD) Mean(SD) Mean(SD) Mean(SD)
Practical value 4.503(.757) 4.577(.535) 4.642(.707) 4.375(.657)
1.956 .120
A A A A
Social value 3.430(.737) 3.956(.682) 4.092(.991) 3.466(.805)
16.881 .000
B A A B
Enjoyment value 4.120(.707) 4.477(.882) 4.662(.672) 4.177(.793)
10.209 .000
B AB A B
Uniqueness value 3.242(.920) 3.785(.679) 4.114(1.016) 3.353(.883)
19.428 .000
B A A B
Suitability value 4.103(732) 4.460(.639) 4.585(.661) 3.930(.729)
16.157 .000
B A A B
Appearance value 4.326(.759) 4.638(.686) 4.655(.698) 4.0221(.977)
13.772 .000
B A A C
Fashionability value 3.177(.746) 3.956(.775) 4.060(.830) 3.320(.630)
33.387 .000
B A A B
Post hoc: Scheffé test
Table 4. Attitude toward e-Tailer across Clusters
Attitude
Distrustful Doers (n=172)
Trusting Doers (n=107)
Inactive Trusters (n=79)
Distrusters
(n=68) F p
Mean(SD) Mean(SD) Mean(SD) Mean(SD) Purchase intention 4.351(.640) 4.732(.683) 4.587(.674) 4.230(.483)
10.598 .000
A B AB A
Price premium 2.757(.852) 3.602(.956) 3.785(1.178) 2.772(.816)
34.044 .000
A B B A
Favor 4.111(.567) 4.561(.587) 4.531(.652) 3.936(.819)
21.888 .000
A B B A
Post hoc: Scheffé test
Fourth, comparing the means of attitude towards e-tailers across the clusters, a one-way ANOVA revealed that the respondents of each cluster differently valued purchase intention ( F =10.598, p =.000), willingness to pay a premium price (F=34.044, p=.000), and attitude ( F =10.598, p =.000). As seen in Table 4, the result of Scheff é post hoc test showed that willingness to pay a
premium price and attitude of cluster 2 and 3 was significantly higher than cluster 1 and 4 (p=.019).
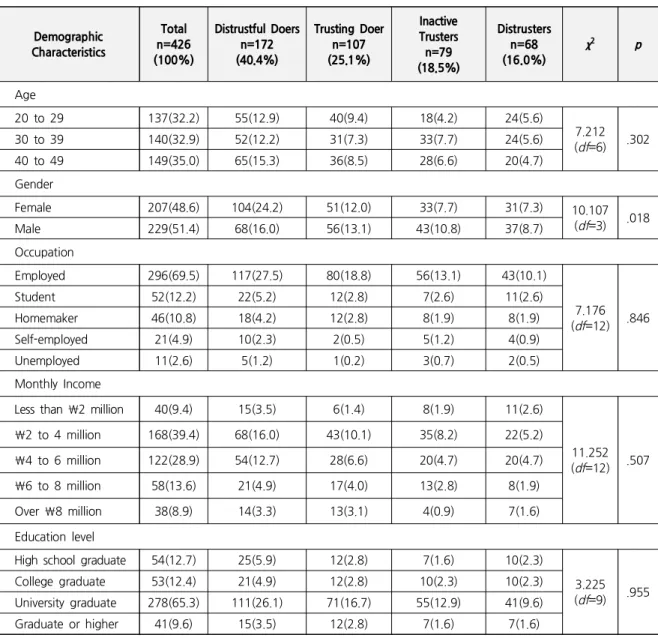
A Chi-square test examined if there was a significant
difference across the clusters in terms of demographics
such as age, gender, occupation, monthly income and
education level. Only gender was a discriminating
variable ( χ
2= 10.107, df= 3, p =.018). There were more
female respondents in cluster 1, while more male respondents in cluster 2, 3, and 4 (Table 5).
In order to determine whether there are significant differences of behaviors on clothing purchase across the clusters a series of Chi-square test were employed (Table 6). Four clusters were not different in terms of their monthly expenditure on clothes and frequency of shopping, shopping place, and average time spent for each shopping. However, each cluster had different levels
Table 5. Demographic Characteristics of Clusters
Demographic Characteristics
Total n=426 (100%)
Distrustful Doers n=172 (40.4%)
Trusting Doer n=107 (25.1%)
Inactive Trusters
n=79 (18.5%)
Distrusters n=68 (16.0%)
χ
2p
Age
20 to 29 137(32.2) 55(12.9) 40(9.4) 18(4.2) 24(5.6)
7.212 ( df =6) .302
30 to 39 140(32.9) 52(12.2) 31(7.3) 33(7.7) 24(5.6)
40 to 49 149(35.0) 65(15.3) 36(8.5) 28(6.6) 20(4.7)
Gender
Female 207(48.6) 104(24.2) 51(12.0) 33(7.7) 31(7.3) 10.107
( df =3) .018
Male 229(51.4) 68(16.0) 56(13.1) 43(10.8) 37(8.7)
Occupation
Employed 296(69.5) 117(27.5) 80(18.8) 56(13.1) 43(10.1)
7.176 ( df =12) .846
Student 52(12.2) 22(5.2) 12(2.8) 7(2.6) 11(2.6)
Homemaker 46(10.8) 18(4.2) 12(2.8) 8(1.9) 8(1.9)
Self-employed 21(4.9) 10(2.3) 2(0.5) 5(1.2) 4(0.9)
Unemployed 11(2.6) 5(1.2) 1(0.2) 3(0.7) 2(0.5)
Monthly Income
Less than ₩ 2 million 40(9.4) 15(3.5) 6(1.4) 8(1.9) 11(2.6)
11.252 ( df =12) .507
₩ 2 to 4 million 168(39.4) 68(16.0) 43(10.1) 35(8.2) 22(5.2)
₩ 4 to 6 million 122(28.9) 54(12.7) 28(6.6) 20(4.7) 20(4.7)
₩ 6 to 8 million 58(13.6) 21(4.9) 17(4.0) 13(2.8) 8(1.9)
Over ₩ 8 million 38(8.9) 14(3.3) 13(3.1) 4(0.9) 7(1.6)
Education level
High school graduate 54(12.7) 25(5.9) 12(2.8) 7(1.6) 10(2.3)
3.225 ( df =9) .955
College graduate 53(12.4) 21(4.9) 12(2.8) 10(2.3) 10(2.3)
University graduate 278(65.3) 111(26.1) 71(16.7) 55(12.9) 41(9.6)
Graduate or higher 41(9.6) 15(3.5) 12(2.8) 7(1.6) 7(1.6)
of buying experience ( χ
2=18.108, df =3, p =.000), information search experience ( χ
2= 40.797, df =3, p =.000), reading review boards ( χ
2=426.0, df =3, p =.000), writing product reviews ( χ
2=47.561, df =3, p =.000), inquiring further information of the store managers ( χ
2=22.582, df =3, p =.000), and post purchase experience such as cancelations, exchanges or returns ( χ
2