Kinetics of the KOH Catalyzed-Methanolysis for Biodiesel Production from Fat of Tra Catfish
Le Thi Thanh Huong*․Phan Minh Tan**․Tran Thi Viet Hoa**․Soo Lee
*Center of Chemical Industry, Ho Chi Minh City University of Industry, 12 Nguyen Van Bao Street, Go Vap District, Ho Chi Minh City, Viet Nam
**Ho Chi Minh City Department of Science and Technology, 244 Dien Bien Phu, District 3, Ho Chi Minh City, Viet Nam
***Faculty of Chemical Engineering, Ho Chi Minh City University of Technique, 268 Ly Thuong Kiet, District 10, Ho Chi Minh City National University, Viet Nam
Department of Chemical Engineering, Changwon National University, 9 Sarim-dong, Changwon, Gyeongnam, 641-773, Korea
(Received August 22, 2008 ; Accepted December 18, 2008)
Abstract : Transesterification of fat of Tra catfish with methanol in the presence of the KOH catalyst yields fatty acid methyl esters (FAME) and glycerol (GL). The effects of the reaction temperature and reaction time on rate constants and kinetic order were investigated.
Three regions were observed. In the initial stage, the immiscibility of the Tra fat and methanol limited the reaction rate, hence this region was controlled by the mass transfer. Subsequent to this region, produced FAME like a co-solvent made the reaction mixture homogeneous, therefore the conversion rate increased rapidly so it was controlled by the kinetic parameters of the reaction until the equilibrium was approached in the final slow region. A second-order kinetic mechanism was proposed involving second regions for the forward reaction. The rate determining step for the overall KOH catalyzed-methanolysis of Tra fat was the conversion of triglycerides (TG) to diglycerides (DG). This rate constant was increased from 0.003 to 0.019 min-1 when the reaction temperature was increased from 35 to 60oC. Its calculated activation energy was 14.379 (kcal.mol-1).
Keywords : Transesterification, biodiesel, kinetics, methyl esters, fat of Tra catfish.
1. Introduction
Biodiesel is mono-alkyl ester of long chain fatty acid derived from renewable feedstock like vegetable oil, animal fat, and waste
✝Corresponding author
(E-mail: [email protected])
cooking oil. It can be produced by the transesterification method, also called alcoholysis, in which TGs that are main compositions of oil or fat are reacted with alcohol [1].
Various kinds of oil have been researched to be used as feedstock for biodiesel production like soybean oil [2], rape-seed oil [3], sunflower oil [4], palm and coconut oil [5], fat
of Tra and Basa catfish [6], beef tallow [7], used frying oil [8], and etc. Alkali catalyzed transesterification is much faster and less corrosive than that of acid catalyzed transesterification, and it is most often used commercially. Moreover, its reaction conditions are moderate. Hydroxides like NaOH, KOH are more applicable to industrial uses because of its cheap cost, availability, and efficiency.
Alcohols used in the transesterification process include methanol, ethanol, propanol, and butanol [9]. However, methanol has given the best results, as it has the most suitable chemical and physical properties such as polar and shortest chain alcohol. The transesterification reaction is affected by molar ratio of triglyceridesto alcohol, catalyst, reaction time and temperature, water and free fatty acid content of oils or fats, and mixing intensity [10-15].
The transesterification reaction consists of three consecutive reversible reactions with intermediate formation of DG and monoglycerides (MG). The reaction mechanism for alkali-catalyzed transesterification is formulated as three steps, where k1, k2, and k3 are the forward rate constants and k-1, k-2, and k-3 are reverse rate constants [16].
k1
k-1
TG + ROH DG + R'CO2R
(1)
k3 k-3
MG + ROH GL + R'CO2R
(2) k2
k-2
DG + ROH MG + R'CO2R (3) The overall reaction is:
Catalyst
TG + 3 ROH 3 R'CO2R + GL
(4)
The relationship between reaction rate constant and temperature is given by the
Arrhenius equation:
T C .1 2.303.R.
k E
log10 =− a +
(5)
Where k is the rate constant, Ea is the a ctivation energy of the reaction (J.mol-1), R is the gas constant (8.314 J.mol-1.K-1), T is the absolution temperature (K), and C is a constant. From plotting log10k in terms of 1/T, the slope (-Ea/2.303R) can be determined.
Many researchers have studied the effects of variables on the transesterification reaction of vegetable oil and animal fat [2-8].
However, there have been few reports on the kinetics of this reaction. Freedman et al. have investigated both acidic and alkaline catalyzed transesterification of soybean oil with butanol and methanol. They determined the reaction rate constants and investigated the effect of reaction parameters like the type of alcohol, alcohol/soybean oil molar ratio, type and amount of catalyst, and reaction temperature on rate constants and the kinetic order.
Generally, forward reactions appeared to be pseudo-first order or second-order depending upon conditions used. For a 30:1 butanol:
soybean oil molar ratio, the forward and reverse reactions followed a pseudo-first order and second order kinetics, respectively, for both acidic and alkaline catalysts. The alkaline-catalyzed reactions had much larger rate constants than the acid-catalyzed reactions for both forward and reverse reactions. On the other hand, for a 6:1 molar ratio, the kinetics of the forward and reverse reactions which were catalyzed by alkaline was second order. In the case of the methanolysis at 6:1 molar ratio, a rapid increase in FAME was observed without any corresponding rapid increase or decrease in DG and MG. Therefore, they have proposed a shunt reaction in which 3 mol of methanol directly attached 1 mol of TG. Thus, the kinetics reaction consisted of a combination of
second-order consecutive and fourth-order shunt reactions [17].
Noureddini et al. have studied the kinetics of the transesterification of soybean oil with methanol in the presence of NaOH catalyst [18]. They investigated the effects of mixing intensity and temperature on the reaction rates for a 6:1 methanol: soybean oil molar ratio. A reaction mechanism consisting of an initial mass transfer controlled region followed by a second-order kinetically controlled region was proposed. Moreover, the kinetics of the palm oil methanolysis catalyzed by KOH catalyst has also been reported by Darnoko et al. They suggested a pseudo-second-order for the conversion of TG, DG, and MG for 30 minutes of the initial stages of the reaction, but they only considered the forward reactions [19]. The kinetics and mechanism of the potassium hydroxide-catalyzed methanolysis of rapeseed oil have been reported by Komers et al. The saponification side reactions have been included into the reaction mechanism making the model more complex [20]. Vicente et al.
have studied the kinetics of the sunflower oil methanolysis. Their studies indicated that the kinetically controlled region followed a second-order mechanism for the forward and reverse reactions, where the reaction system could be described as a pseudo-homogenous catalyzed reaction [21]. Most recently, Stamenkovic’ et al. have investigated the kinetics of sunflower methanolysis at low temperature (10-30oC). They used a simple kinetic model for simulation of the TG conversion and the FAME formation in the second region. They have noticed that there were two regions of the reaction progress: The initial heterogeneous region was controlled by the mass transfer; the pseudo-homogeneous second region controlled the chemical reaction.
The fast irreversible second-order reaction was followed by the slow reversible second-order reaction close to the completion of the methanolysis reaction [22].
In the studies of methanolysis reaction
kinetics, three regions were noticed: a mass transfer controlled region in the initial stage (slow) followed by a chemically controlled region (fast), and a final region close to equilibrium (slow). Especially, in almost studies, the mass transfer controlled region has not been included in the kinetics model of the overall methanolysis reactions and both forward and reverse methanolysis reactions followed the second-order kinetics. However, the kinetics studies of the transesterification of animal fat like beef tallow, Tra fat, etc have not yet been presented.
In the present work, we investigated the methanolysis of Tra catfish fat using KOH catalyst. The molar ratio of methanol to fat (6:1) and the concentration of KOH (0.8 wt%) catalyst were kept constant while temperature and time of the reaction were varied [6]. The temperature dependency of the reaction rate constants and the activation energy were determined for the forward reaction.
2. Experimental
2.1 Materials
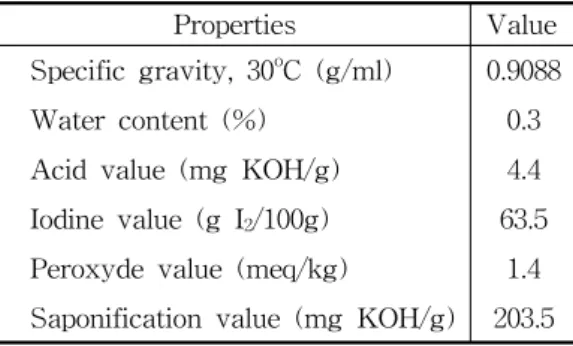
Tra fat was randomly selected on the processing line of Giang Agriculture and Food Export Company (Afiex). The chemical and physical properties of Tra fat were analyzed (Table 1). The commercial methanol (90%) was commercially obtained. The potassium hydroxide catalyst (86%) (China) was used in this research. The gas chromatograph reference standards for fatty methyl esters, such as GL, TG, DG, and MG were purchased from Fulka. Two internal standard materials were 1,2,4-butanetriol for the determination of the free glycerol and 1,2,3-tricaproylglycerol (tricaprin) for the determination of the glycerides (TG, DG, and MG) that were purchased from Sigma. Chemicals like pyridine, n-heptane, N-methyl-N- trimethylsilyltrifluoroacetamide (MSTFA) (Merck) were used for analysis.
2.2 Transesterification of Tra fat
In this study, 0.8% KOH catalyst (wt%) was calculated from the total weight of fat plus methanol prior to reaction. The molar ratio of methanol to fat was 6:1. The appropriate catalyst and methanol were put in a two-necked glass flask (250 cm3), which was equipped with a reflux condenser. The mixture was vigorously stirred (600 rpm) by a combination hot plate and magnetic stirrer for 20 minutes. Then the flask was immersed in a constant-temperature bath and heated up to required temperature. After that, 0.05 mol of (42.86 g) fat was poured into the flask. The mixture was stirred at the same rate for all runs. After tranesterification was completed, the excess of methanol was recovered under vacuum at 50oC with rotational evaporator.
Then mixture was settled to separate into two phases for 4h by separator funnel. The upper biodiesel layer was washed by hot distillated water (60 70oC) until the washing solution was neutral. Finally, biodiesel was dried in the microwave oven.
Table 1. Physicochemical properties of Tra fat
Properties Value
Specific gravity, 30oC (g/ml) 0.9088
Water content (%) 0.3
Acid value (mg KOH/g) 4.4
Iodine value (g I2/100g) 63.5 Peroxyde value (meq/kg) 1.4 Saponification value (mg KOH/g) 203.5
2.3. Sampling and analytical methods At various times, samples were quickly withdrawn from the reactor with a pipette.
About 300 mg of sample mixture was placed in a vial and diluted with 5 ml high-performance liquid chromatography grade tetrahydrofuran (THF) and then several drops of 0.6 N HCl were added to neutralize the catalyst. Separate studies had carried out to
determine that this dilution and neutralization stopped the reaction immediately. The sample was then filtered through 0.2 μm Teflon syringe filter and kept at 5oC until further analysis [19]. Before analyzing, samples have to be silylated into more volatile derivatives by MSTFA in the presence of pyridine [23-26].
The fatty acid compositions of Tra fat were determined by the GC-ISO/CD 5509:94 method [6]. Quantitative analyses of FAME were carried out by the GC method. The analyses were performed on a Hewlett-Packard 6890 Series Gas Chromatography System equipped with FID detector using HP INNOWAX column (30 m x 0.53 mm x 1 μm) and helium as carrier gas. Methyl hexanoate was used as the internal standard. The split ratio was 50:1.
Injector and detector temperature was 250oC.
Oven temperature was started at 120oC and held for 2 min, programmed at 7oC/min up to 230oC and held at this temperature for 15 min.
Quantitative analyses of TG, DG, MG, and GL were also performed on the same Hewlett-Packard 6890 using DB-5HT column (30 m x 0.250 mm x 0.1 μm) and helium used as carrier gas. Before testing by GC, samples were reacted with MSTFA in presence of pyridine to give the corresponding volatile trimethylsilyl derivatives of the hydroxyl group. Two internal standard materials were 1,2,4-butanetriol and 1,2,3-tricaproylglycerol (tricaprin). The split ratio was 5:1. Injector temperature was 350oC and detector temperature was 380oC. Oven temperature was started at 60oC and held for 1 min, programmed at 15oC/min up to 180oC, increased to 230oC at a rate of 7oC/min, increased to 330oC at a rate of 10oC/min, and continuously increased to 375oC at a rate of 15oC/min, held at this temperature for 4 min.
The production yield is defined as the weight percentage of the final production relative to the weight of catfish fat. The purity of biodiesel production was calculated from the area of fat catfish methyl ester over the
m 100%
(%) m yield Production
catfish Tra of fat
production
biodiesel ×
=
reference area analyzed by gas chromatograph method.
m 100%
V C A
A (%) A
Purity EI EI
EI
EI× × ×
=∑ −
where,
A : Sum area of methyl ester peaks from C14:0 to C24:1
AEI: Peak area of methyl hexanoate CEI (mg/ml) : Concentration of methyl hexanoate
VEI (ml) : Volume of methyl hexanoate.
m (mg) : Sample amount
3. Results and Discussion
3.1 Effect of time and temperature on FAME formation
The transesterification reaction of Tra fat was investigated at different temperatures, and the yield as a function of time-on-stream is shown in Figure 1. The temperature was 50oC, the catalyst was 0.8% KOH, and the methanol/fat molar ratio was 6:1.
Figure. 1. The effect of reaction temperature on the transesterification reaction of Tra fat.
The Figure 1 illustrates that there is the same trend of the transesterification reaction at all of the investigated temperatures (35oC, 40oC, 50oC, and 60oC). It is easy to find that the FAME formation was trivial on the first 5 min of the reaction and there were three regions of reactions. In the initial stage of process, the formation of FAME was slow then it increased in the second stage, and slowed down to became unchanged as the reaction approached to the equilibrium. This behavior is typical for changes in the reaction mechanisms. In the initial stage, the reaction rate performed lowest due to immiscibility of the Tra fat and methanol, hence the reaction is controlled by the mass transfer. Subsequent to this region, the conversion rate increased rapidly, therefore it was controlled by the kinetic parameters of the reaction until the equilibrium was approached to the final slow region. Correspondingly, the methyl esters were significantly yielded in the second stage.
The formation of the FAME product plays a role as a co-solvent which promotes the miscibility of the mixture of Tra fat and methanol, consequently the activity of the transesterification reaction was increased. At equilibrium, the content of FAME was almost invariable. This style of kinetics has been observed for the above mentioned studies.
For all the investigated temperature, the conversions of Tra fat were small in the initial stage, which involved a slow rate of the FAME production. The rate then increased rapidly and remained unchanged as the equilibrium was approached to about 45 min.
The time for the mass transfer region was slightly shortened as the reaction temperature was increased. The effect of temperature on the pattern of Tra fat conversion over time-on-stream was unnoticeably different at 40oC, 50oC, and 60oC. However, at equilibrium (60oC) it was observed that the FAME yield was slightly lower due to the competitive saponification of free fatty acids contained in the Tra fat with KOH catalyst. At 35oC, the
conversion of Tra fat was lowest.
3.2 The effect of time on the change in compositions
A change in composition in the progress of the transesterification reaction for Tra fat is shown in Figure 2. The reaction temperature was (50oC), KOH catalyst was 0.8%, and the methanol/fat molar ratio was 6:1.
Figure 2. The effect of reaction time on the change in the composition during the transesterification of the Tra fat.
The change in glycerol content with reaction time was similar to that of the FAME but the change range of GL content was shorter because the FAME/GL molar ratio of the production mixture was 3:1. On the other hand, the change tendency of the TG content was opposite to that of the FAME. The highest concentration of DG and MG was observed in the first minutes; their level then decreased and reached to the equilibrium after about 45 min.
3.3 The effect of temperature on the change in the compositions
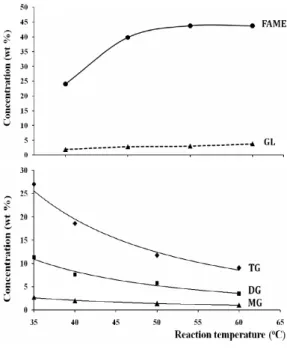
The effect of the reaction temperature on the change in the compositions in the reaction mixture is shown in Figure 3.
Figure 3. The effect of temperature on the change in the composition during the transesterification of the Tra fat.
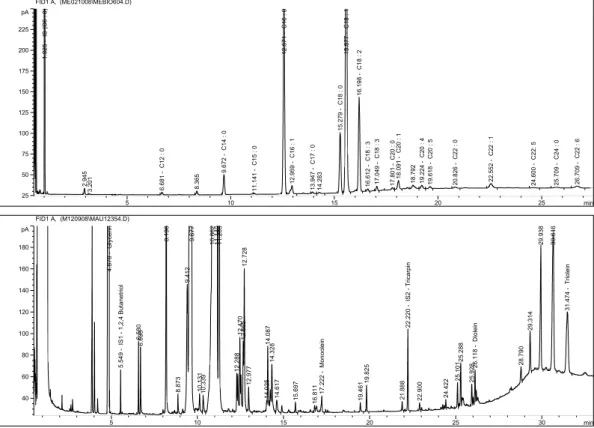
The gas chromatograms of reaction mixture consisting of FAME, TG, DG, MG, and GL, and and the methanolysis reaction components are shown in Figure 4. Given the reaction time of 5 min, KOH catalyst of 0.8%, and the methanol/fat molar ratio of 6:1, the reaction temperature was investigated at 35oC, 40oC, 50oC, and 60oC. It can be seen that the effect of reaction temperature and time on changes in the reaction compositions has a similar trend. The efficiency of the conversion of Tra fat was low at a lower reaction temperature (35oC) because of the immiscibility of the methanol and Tra fat.
During the reaction time at all of the investigated temperatures, the amount of TG was larger than that of DG and MG. It means that the reaction of TG with methanol to
min
5 10 15 20 25
pA
25 50 75 100 125 150 175 200 225
FID1 A, (ME021008\MEBIO604.D)
1.025 - IS (C6 : 0) 2.945 3.201 6.681 - C12 : 0 8.365 9.672 - C14 : 0 11.141 - C15 : 0 12.571 - C16 : 0 12.959 - C16 : 1 13.947 - C17 : 0 14.283 15.279 - C18 : 0 15.577 - C18 : 1 16.198 - C18 : 2 16.612 - C18 : 3 17.049 - C18 : 3 17.801 - C20 : 0 18.091 - C20 : 1 18.792 19.224 - C20 : 4 19.618 - C20 : 5 20.826 - C22 : 0 22.552 - C22 : 1 24.600 - C22: 5 25.709 - C24 : 0 26.709 - C22 : 6
min
5 10 15 20 25 30
pA
40 60 80 100 120 140 160 180
FID1 A, (M120908\MAU12354.D)
4.878 - Glycerin 5.549 - IS1 - 1,2,4 Butanetriol 6.580 6.695 8.196 8.873 9.412 9.677 10.131 10.339 10.862 11.140 11.283 12.288 12.470 12.665 12.728 12.977 14.025 14.087 14.328 14.617 15.697 16.811 17.222 - Monoolein 19.461 19.825 21.888 22.220 - IS2 - Tricarpin 22.900 24.422 25.101 25.288 25.928 26.118 - Diolein 28.790 29.314 29.938 30.646 31.474 - Triolein
Figure 4. The GC chromatograms of reaction mixture consisting of FAME, TG, DG, MG, and GL (upper), and the methanolysis reaction component of Tra fat(lower).
produce DG and FAME (Equation 1) was slowest.
These results contrasted to those of Freedman and Komer’s research, in which the conversion reaction of DG was slowest [17, 20]. However, they agreed with reports of Darnoko and Noureddini [18, 19]. In addition, Stavarache et al. also reported that the ultrasonic assisted the reaction of MG to produce GL and FAME was slowest. This behavior could be the consequence of mixing efficiency of ultrasonically driven transesterification, in which the emulsion was formed to allowed a large reaction surface and kept the emulsion state for longer time [27]. In Vicente’s report, during the reaction at 25oC the concentration of MG and DG did not show a significant change [21]. It could be explained by differences in the used materials and
reaction conditions. Freedman studied the kinetics of the soybean oil methanolysis with NaOCH3 catalyst at 40oC whereas the material for Komer’s studies was rapeseed oil and KOH catalyst at about 23oC. The unsaturated components of these vegetable oils (70-80%) were higher than those of Tra fat (57.97) and palm oil (56.6%) [6, 28, 29]. The distribution of saturated contents and unsaturated components at various positions of the TG is not at random [30]. The saturated fatty acids have a natural preference for the 1st and 3rd position and unsaturated ones for the 2nd position [27]. Because of the specific distribution of the fatty acids in TG, their degree and properties of the transesterification reaction should be different. In addition, the different conditions of the transesterification reaction like the mixing level, the kind of
alcohols and catalysts, but above all, the positional isomers of the unsaturated components could also affect the kinetics and mechanism of the reaction.
3.4 The rate constants of the transesterification reaction
Freedman et al. have proposed pseudo first-order kinetics at large molar excess of alcohol and second-order kinetics combined with a shunt-reaction scheme at the lower alcohol excess level [17]. Noureddini and Vicente did not consider the reaction kinetics of initial stage because its time was too short.
They assumed that the second stage appears a second-order kinetic mechanism [18, 21].
Darnoko’s kinetic model is the second-order kinetic for the initial stage of the reaction, followed by the first-order or zero-order kinetics.
In our experimental data, the kinetic model of the forward reactions has apseudo second-order model for the second stage. The simple second-order reaction rate for TG in Equation (1) would be as follows:
k[TG]2
dt d[TG]
- =
(6)
Intergration of Equation (6) yields:
0
TG [TG]
1 [TG]
.t 1
k = −
(7)
Similarly, the same procedure applied to Equation (2) and (3), and the result lead to following equations:
0
DG [DG]
1 [DG]
.t 1
k = −
(8)
0
MG [MG]
1 [MG]
.t 1
k = −
(9)
Where, k is the overall pseudo rate constant,
t is the reaction time, TG0 is the initial TG concentration, DG0 is the initial highest DG concentration, and MG0 is the initial highest MG concentration. If the model of Equation (7) is valid, a plot of the reaction time (t) in terms of 1/[TG] will be a straight line. The slope is kTG. The rate constant of the conversion reaction followed Equation 1 (TG
→DG) is shown in Figure 5.
Figure 5. The rate constants in terms of reaction time of the conversion reaction of TG to DG at different temperatures.
Similar straight lines were obtained for the conversion of DG and MG in Equations 2 and 3. The values of k and its corresponding correlation coefficient at four different temperatures are presented in Table 2.
The high correlation coefficients for the statistical data (>0.990%) indicated that the assumed data for calculating the rate constants were accurate. These results suggests that at a 6:1 molar ratio with 0.8%
KOH catalyst, the transesterification conversions of Tra fat with methanol follows the second-order kinetics.
It could remark that rate constants increased at higher temperature, and the value of k increases in the following order:
kTG<kDG<kMG. These results were in accordance with the above suggested effect of temperature on the change in the compositions. The rate constant for the TG
Glyceride Reaction temperature (oC)
Reaction rate constant,
k (min-1) Correlation coefficient, R2
TG
35 0.003 0.986
40 0.004 0.990
50 0.009 0.994
60 0.019 0.998
DG
35 0.011 0.982
40 0.013 0.992
50 0.027 0.997
60 0.055 0.998
MG
35 0.101 0.994
40 0.114 0.997
50 0.144 0.997
60 0.193 0.996
Table 2. The rate constants and corresponding correlation coefficients of the transesterification of Tra fat at different temperatures
conversion was the lowest, and hence, the conversion of TG to DG is the rate determining step for overall KOH catalyzed methanolysis of Tra fat. This rate constant was increased from 0.003 to 0.019 min-1 when the reaction temperature was increased from 35 to 60oC.
3.5 The activation energy of the transesterification reaction
Activation energies for forward conversion steps were calculated based on the Arrhenius equation (Equation (5)). The plot for the log10k in terms of 1/T at four different temperatures (35, 40, 50, and 60oC) is shown in Figure 6.
From this plot, the slopes (-Ea/2.303R) are determined. The calculated activation energy of the conversion steps and corresponding correlation coefficients are shown in Table 3.
Our results for all three steps of the transesterification reaction were in the same range as Darnoko’s. The calculated activation energy of the first conversion (TG→DG) was the biggest.
Figure 6. The Arrhenius plot of the reaction rate in terms of temperature.
Table 3. The rate constants and corresponding correlation coefficient of the transesterification of Tra fat at different temperatures
Glycerides
Activation energy (kcal.mol-1)
Correlation coefficient, R2
TG 14.379 0.996
DG 13.629 0.987
MG 5.247 0.994
4. Conclusions
In our study of the kinetics of the Tra fat methanolysis reaction, three regions were observed. The initial region was controlled by a mass transfer and the reaction rate was slow due to immiscibility of the mixture of Tra fat and methanol. The heterogeneous property of the reaction mixture could limit the reaction rate. The second region is controlled by the kinetic parameters. The conversion rate increased rapidly. The produced FAME as a co-solvent results in the reaction mixture homogeneous so the conversion reaction was intensely promoted.
The kinetics model of this region followed the second order-kinetics model. In the last region, the rate slowed down and became unchanged as the transesterification conversion approached to the equilibrium.
To produce FAME and the intermediate materials (GL, DG, MG) by methanolysis process of Tra fat using KOH as a catalyst.
The methanolysis reaction of Tra fat occurred process consecutively and the yield of DG, MG, FAME, and GL. The slowest rate corresponding to the highest activation energy that determined the overall rate of the methanolysis reaction was the conversion rate of TG to DG. It changed from 0.003 to 0.019 (min-1) as the reaction temperature changed from 35 to 60oC. Its calculated activation energy was 14.379 (kcal.mol-1).
References
1. G. Knoth, Biodiesel Handbook, edited by J.
V. Gerpen, J. Krahl, and G. Knothe.
Champaign, Illinois: AOCS Press, (2005).
2. R. Alcantara, J. Amores, L. Canoira, E.
Fidalgo, M. J. Franco, and A. Navarro, Catalytic production of biodiesel from soy-bean oil, used frying oil and tallow, Biomass & bioenergy, 18(6) 515 (2000).
3. S. Saka and D. Kusdiana, Biodiesel fuel
from rapeseed oil as prepared in supercritical methanol, Fuel, 80, 225 (2001).
4. A. K. Tiwari, A. Kumar, and H. Rahema, Optimisation of biodiesel production by sunflower oil transesterification, Bioresource Technology, 83, 111 (2002).
5. J. Jitputti, B. Kitiyanan, P. Rangsunvigit, K. Bunyakiat, L. Attanatho, and P.
Jenvanitpanjakul, Transesterification of crude palm kernel oil and crude coconut, Chemical Engineering J., 116, 61 (2006).
6. L. T. T. Huong, P. M. Tan, T. T. V. Hoa, and S. Lee, Biodiesel production from fat of Tra catfish and Basa catfish, Journal of the Korean Oil Chemists' Society, 25(3), 299 (2008).
7. F. Ma, Biodiesel fuel: The transesterification of beef tallow, PhD dissertation. (Biological System Engineering, University of Nebraska- Lincoln), (1998).
8. A. V. Tomasevic and S S. Siler- Marinkovic, Methanolysis of used frying oil, Fuel Process Technology, 81, 1 (2003).
9. X. Lang, A. K. Dalai, N. N. Bakhshi, M. J.
Reaney and P. B. Hertz, Preparation and characterization of bio-diesel from various oils, Bioresource Technology, 80, 53 (2001).
10. J. M. Encinar, J. F. Gonza´lez, and A.
Rodrı´guez-Reinares, Biodiesel from used frying oil. Variables affecting the yields and characteristics of the biodiesel, Ind.
Eng. Chem. Res. , 44, 5491 (2005).
11. F. Ma and M. A. Hann, Biodiesel production: a review, Bioresource Technology, 70, 1 (1999).
12. B. Freedman, E.H. Pryde, and T.L.
Mounts, Variables affecting the yields of fatty esters, Journal of the American Oil Chemists’ Society, 61(10), 1638 (1984).
13. M. Pilar Dorado, E. Ballesteros, F. J.Lopez, and M. Mittelbach, Optimization of alkali-catalyzed transesterification of
Brassica Carinata oil for biodiesel production, Energy & Fuel, 18, 77 (2004).
14. L. C. Meher, V. S. S. Dharmagadda, and S. N. Naik, Optimization of alkali- catalyzed transesterification of Pongamia pinnata oil for production of biodiesel, Bioresource Technology, 97, 1392 (2006).
15. F. Ma, L. D. Clements, and M.A. Hanna, The effect of mixing on transesterification of beef tallow, Bioresource Technology, 69, 289 (1999).
16. E. Lotero, J. R. J. Goodwin, Bruce. D. K.
Suwannakarn, Y. Liu, and D. Lopez, The catalysis of biodiesel synthesis, Catalysis, 19, 58 (2006).
17. B. Freedman, R. O. Butterfield, and E. H.
Pryde, Transesterification Kinetics of Soybean Oil, Journal of the American Oil Chemists’ Society, 63(10), 1357 (1986).
18. H. Noureddini and D. Zhu, Kinetics of Transesterification of Soybean oil, Journal of the American Oil Chemists’ Society, 74(11), 1457 (1997).
19. D. Darnoko and M. Cheryan, Kinetics of palm oil transesterification in a batch reactor, Journal of the American Oil Chemists’ Society, 77(12), 1263 (2000).
20. K. Komers, F. Skopal, and R. Stloukal, Kinetics and mechanism of the KOH-catalyzed methanolysis of rapeeseed oil for biodiesel production, Eur. J. Lipid.
Sci. Technol, 104(11), 728 (2002).
21. G. Vicente, M. Martı'nez, J. Aracil, and A.
Esteban, Kinetics of sunflower oil methanolysis, Ind. Eng. Chem. Res, 44, 5447 (2005).
22. O. S. Stamenkovi'c, M. L. Lazi'c, Z. B.
Todorovi'c, V. B. Veljkovi'c, and D. U.
Skala, Kinetics of sunflower oil methanolysis at low temperature, Bioresource Technology, 99, 1131 (2008).
23. G. Knothe, Analyzing Biodiesel: Standards and Other Methods, Journal of the American Oil Chemists’ Society), 83(10), 823 (2006).
24. M. Mittelbach, Diesel fuel derived from vegetable oils, VI: Specifications and Quality Control of biodiesel, Bioresource Technology, 56, 3 (1996).
25. G. Knothe, Analytical methods used in the production and fuel quality assessment of biodiesel, Trans ASAE, 44(2), 143 (2001).
26. British Standard EN 14105:2003.
27. M. Stavarachea, M. Vinatorua, and Y.
Maeda, Aspects of ultrasonically assisted transesterification of various vegetable oils with methanol, Ultrasonics Sonochemistry, 14(3), 380 (2007).
28. D. Zheng and M. A. Hanna, Preparation and properties of methyl esters of beef tallow, Bioresource Technology, 57, 139 (1996).
29. R. Sarin, M. Sharma, S. Sinharay, and R.
K. Malhotra, Jatropha Palm biodiesel blends: An optimum mix for Asia, Fuel, 86, 1365 (2007).
30. N. K. Andrikopoulos, Triglyceride species compositions of common edible vegetable oils and methods used for their identification and quantification, Food review international, 18, 71 (2002).