Introduction
Tea is a common drink throughout the world and is con- sumed at any time and situation, even during pregnancy. The leaves of Camellia sinensis are used to prepare tea and have 2 major ingredients: alkaloids (as caffeine) and polyphenols (catechins) [1,2].
Tea is generally divided into 3 main categories based on the fermentation status: black, green, and oolong. In most parts of the world, black tea is the most common consumed category. Tea is considered the most popular beverage after water [3,4].
It is well known that maternal lifestyle factors, such as smoking and nutritional habits, have a direct effect on the neonate, where certain chemicals cross the placenta to in-
duce positive effects such as those induced by folic acid, or even harmful effects such as those caused by low vitamin A [5,6].
Effects of excessive tea consumption on pregnancy weight gain and neonatal birth weight
Shaymaa Kadhim Jasim, MD
1, Hayder Al-Momen, MD
2, Ali Kadhim Alqurishi, MD
21Department of Obstetrics and Gynecology, College of Medicine, University of Baghdad, 2Department of Pediatrics, Al-Kindy College of Medicine, University of Baghdad, Baghdad, Iraq
Objective
Tea lovers are increasing worldwide. We hope that this report is the first to discuss the possible impacts of high black tea consumption on gestational weight gain (GWG) and birth parameters.
Methods
Throughout one year, a total of 7,063 pregnant ladies coming for first antenatal visit were screened in a major tertiary center. Of them, 1,138 were involved and divided according to their preference into 3 groups: excessive tea (ET), usual tea (UT), and mixed beverages group. The study included women who gave birth to healthy neonates.
Results
The rate of ET consumption was 4.13% with a total of 41 cases. The UT group (controls) comprised 94 women. ET was significantly associated (P<0.05) with maternal age, parity, occupation, smoking, and poor GWG starting from 30 weeks’ gestation until delivery, low birth weight, and small for gestational age (SGA). Poor GWG had a higher relative risk (with 95% confidence interval) in the ET group than in the UT group in crude (1.84 [0.85–2.43]) and risk adjusted models (1.25 [0.28–2.26]). Further, similar results were obtained for SGA in the crude and 3 adjusted models, where the first model was adjusted for bio-obstetrical variables, the second for social parameters, and the third for all factors included in the previous models (1.53 [0.62–2.81], 1.52 [0.71–2.50], and 1.46 [0.78–2.39]), respectively.
Conclusion
Consumption of large amounts of daily black tea during pregnancy (≥1,500 mL) is a significant cause of poor GWG and SGA.
Keywords: Complications; Pregnancy; Tea; Weight gain
Received: 2020.06.13. Revised: 2020.09.08. Accepted: 2020.10.19.
Corresponding author: Hayder Al-Momen, MD
Department of Pediatrics, Al-Kindy College of Medicine, University of Baghdad, Al-Nahda Square, Baghdad 00964, Iraq E-mail: [email protected]
https://orcid.org/0000-0001-9023-9901
Articles published in Obstet Gynecol Sci are open-access, distributed under the terms of the Creative Commons Attribution Non-Commercial License (http://creativecommons.
org/licenses/by-nc/3.0/) which permits unrestricted non-commercial use, distribution, and reproduction in any medium, provided the original work is properly cited.
Copyright © 2021 Korean Society of Obstetrics and Gynecology https://doi.org/10.5468/ogs.20157
eISSN 2287-8580
Caffeine, as a principal chemical component of tea, moves freely from the placenta to the fetus where it remains non- metabolized and elevates the maternal and fetal concentra- tions of adrenaline, resulting in diminished placental blood flow with eventual hypoxia [7,8].
Further, the other major component of tea, namely poly- phenols, could play an important role during gestation and adversely affect the outcomes. Preeclampsia, prematurity, and intrauterine growth retardation are examples of such outcomes [9,10].
Results of maternal tea consumption during pregnancy are conflicting, and some scientists found no strict and direct relationship between tea and pregnancy outcomes, while others observed associated risk factors including prematurity, abnormal fetal growth, and spontaneous abortions [11,12].
We aimed to study the potential effects of excessive tea consumption during pregnancy on maternal weight gain and newborn’s weight at birth.
Materials and methods
All pregnant women who visited for a consultation dur- ing the first trimester to the department of obstetrics and gynecology at Medical City Hospital in Baghdad (which is the main tertiary center in the country) were screened from January 2, 2019 to February 1, 2020. Totally, there were 7,063 women.
1. Maternal data
Recruited mothers on presentation should have had single- ton pregnancy, normal pre-gestational body mass index (BMI;
kg/m2) ≤24.99, and no chronic illnesses, such as diabetes mellitus, hypertension, thyroid disease, asthma, placental disease, and other maternal conditions such as kidney, rheu- matic, pulmonary, and uterine disease, at the first visit and throughout pregnancy. In addition, cases with fetal genetic abnormalities and fetal infections were excluded whenever detected. Based on this, the total number of involved cases was 1,138.
During each visit for the regular antenatal care, full history was taken, and examination was performed by the attending obstetrician.
2. Tea related data
A black teabag from Ahmad Tea Ltd. (London, England), containing 2 g of black tea, which was collected from Sri Lanka, and packed in United Arab Emirates in August 2018, was infused in a cup (150 mL) of hot water for 3–5 minutes according to the instructions of the manufacturer.
During the follow-up period, which was started soon af- ter the initial presentation until delivery of a neonate, daily amounts of the above-mentioned black tea were calculated for all participants in terms of cups and converted into mil- liliters (mL). The usual serving cup in our local community contained 150 mL (just like the manufacturer’s instructions), which is usually consumed 3 times daily after meals for most people. This was considered the usual tea (UT) consumption.
Excessive tea (ET) consumption was defined as consumption of at least 1.5 liters (1,500 mL) per day [13].
3. Workup data
The included subjects were followed up through a twice- weekly phone call to document their daily beverage con- sumption, including tea (black, green, or oolong) and other caffeinated products such as coffee, chocolate, and carbon- ated sodas. Further, the women included in this study were observed to ensure the consumption of 2,200–2,900 kilocal- ories daily and a balanced diet containing 50–60% carbohy- drate, 25–35% fat, and 10–20% protein from different food items including fruits, vegetables, meat, legumes, whole grains, and nuts. Participants were divided into 3 groups:
the first 2 groups involved pregnant women who consumed black tea (prepared as above) as the only daily beverage in addition to water. The ET consumption group included preg- nant women who consumed ≥1,500 mL/day of black tea, while the UT consumption group included pregnant women who consumed ≤3 cups (≤450 mL) of black tea daily. The third group had the following criteria:
• Consumption of any beverage type and non-tea caffein- ated products such as coffee, carbonated soda, and choco- late powder or bar.
• Consumption of black tea from brands other than the above-mentioned brand, or other formulations such as green tea and oolong tea.
• Consumption of >450 mL and <1,500 mL of black tea daily.
This last group was excluded from the statistical analysis.
The decision to join the ET, UT, or the third group of mixed products was made freely by the involved pregnant women at first recruitment.
Participants in the ET and UT groups who failed to follow the strict inclusion criteria and instructions of each group during the follow-up period, or missed regular contacts with the researchers were further excluded from the study sample.
4. Neonatal data
The neonates should be alive, healthy, and full term (com- pleted 37 weeks’ gestation). The sex of the neonates, birth weight, birth gestation, and mode of delivery were docu- mented by the attending pediatrician. Abortions, stillbirth babies, congenital malformations, and premature neonates were excluded.
Birth weight ≤10th percentile was assumed to be small for gestational age (SGA), while large for gestational age neonates were defined as weight ≥90th percentile for age.
Appropriate for gestational age (GA) was considered when the birth weight was <90th and >10th percentile for age.
Low birth weight (LBW) was defined as birth weight <2,500 g [14,15].
5. Analysis and statistics
Mean±standard deviation, frequencies (percentages), and relative risk (RR) with proportions (95% confidence interval [CI]) were used for data expression.
For discrete characteristics, the Pearson’s χ2 test was used.
Student’s t-tests were performed for continuous characteris- tics.
Multivariate logistic regression analysis was applied to con- trol for risk factors of poor gestational weight gain (GWG) and SGA, which have already been revealed to have statisti- cally significant values. Poor GWG was adjusted for maternal age, weight, height, pre-gestation BMI, parity, employment, smoking, and daily energy intake. Three separate adjusted models were created for the SGA. The first model was ad- justed for bio-obstetric parameters (maternal age, parity, pre- pregnancy BMI, GWG, and GA at the first presentation, and at delivery). The second model was adjusted for social factors (education level, occupation, and smoking habit). The third model was adjusted for all parameters involved in the previ- ously mentioned models. The absence of tea drinking was considered as a reference value. All statistical analyses were performed using IBM SPSS (version 23 for Windows; IBM, Chicago, IL, USA). A 2-tailed P-value <0.05. was considered statistically significant.
Results
Of the 1,138 pregnant women, 41 women were categorized in the ET group, while 94 mothers included in the UT group were considered as controls. The rate of excessive tea con-
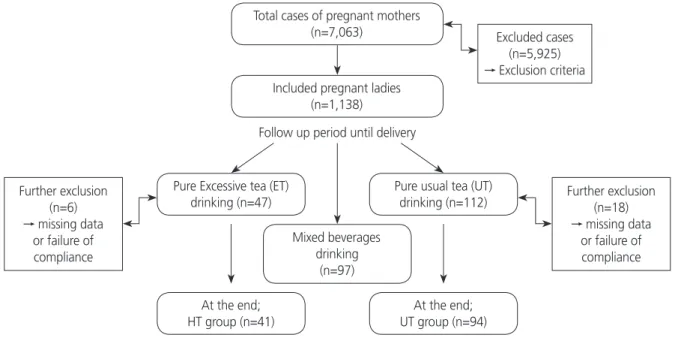
Fig. 1. Flowchart of the study.
Total cases of pregnant mothers
(n=7,063) Excluded cases
(n=5,925)
→ Exclusion criteria
Further exclusion (n=18)
→ missing data or failure of compliance Further exclusion
(n=6)
→ missing data or failure of compliance
Included pregnant ladies (n=1,138)
Pure usual tea (UT) drinking (n=112)
At the end;
UT group (n=94) Pure Excessive tea (ET)
drinking (n=47)
At the end;
HT group (n=41)
Mixed beverages drinking
(n=97)
Follow up period until delivery
sumption was 4.13%. Details of recruitment are shown in Fig. 1.
In the ET group, maternal age, parity, employment, and smoking were statistically significant (P<0.05), as shown in Table 1.
Table 2 presents a schematic of the GWG. For the first trimester visit at early gestation, 10th and 20th gestational weeks, the weight gain was comparable between the ET and UT groups. From the 30th week of gestation until delivery, women in the ET group began to have a significantly poorer GWG.
The significant finding of poor GWG in the ET group had a higher RR with (95% CI) than that in the UT group in the crude model and after controlling for risk factors (maternal age, weight, height, pre-gestation BMI, parity, employment, education level, smoking, and daily energy intake). No statis- tical significance was found between the crude and adjusted models. This is clearly depicted in Table 3.
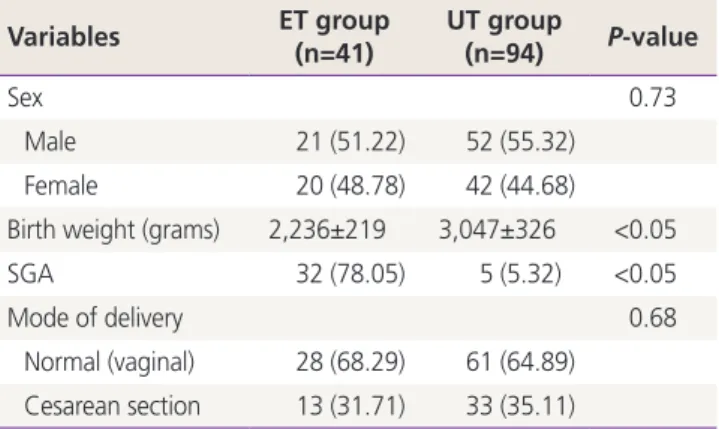
Neonatal sex and delivery mode showed no significant association between the studied groups, although the fre- quency for normal delivery was higher in all participants.
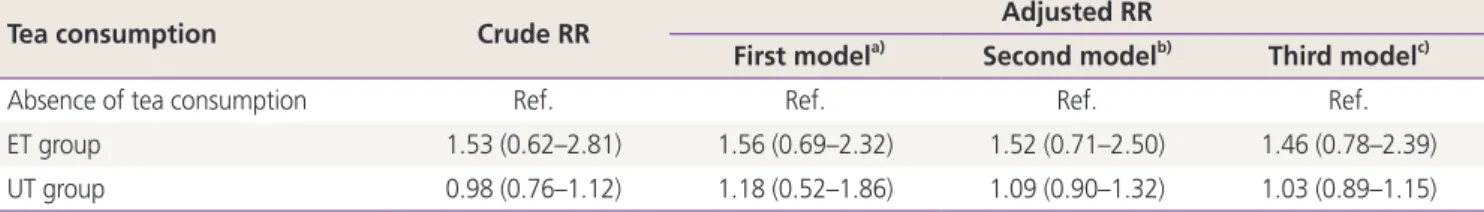
The ET group had significantly SGA and LBW neonates, as illustrated in Table 4. The significant finding of SGA in the ET group had a higher RR (95% CI) compared to that in the UT group. The crude RR of ET was 1.53 (0.62–2.81). However, the RR of 1.56 (0.69–2.32) was further higher in the first model that was adjusted for bio-obstetrical variables includ- ing maternal age, parity, pre-pregnancy BMI, GWG, and GA Table 1. General characteristics of the pregnant women included
in this study
Variables ET group
(n=41) UT group
(n=94) P-value
Age (yr) 34.3±5.8 25.7±5.1 <0.05
Parity 5.9±0.4 3.2 ± 0.1 <0.05
Gestational age (wk)
at presentation 7.4±1.2 7.1±1.6 0.46
Pre-pregnancy BMI 24.7±3.4 24.9±4.2 0.89
Gestational age (wk) at delivery
38.7±1.4 38.9±0.9 0.10
Education level 0.67
Literate 37 (90.24) 86 (91.49)
Illiterate 4 (9.76) 8 (8.51)
Occupation <0.05
Housewife 10 (24.39) 58 (61.70)
Employed 31 (75.61) 36 (38.30)
Smoking status <0.05
Smoker 39 (95.12) 12 (12.77)
Non-smoker 2 (4.88) 82 (87.23)
Values are presented as mean±standard deviation or number (%).
ET, excessive tea; UT, usual tea; BMI, body mass index.
Table 2. Trajectory of gestational weight gain GWG in kg ET group
(n=41) UT group
(n=94) P-value At first recruitment 0.5±0.8 0.6±0.2 0.29 10 weeks’ gestation 1.6±0.1 1.7±0.3 0.31 20 weeks’ gestation 4.9±0.9 5.8±0.7 0.57 30 weeks’ gestation 9.0±0.8 11.6±0.5 <0.05
At delivery 11.7±0.7 16.1±0.9 <0.05
Values are presented as mean±standard deviation.
GWG, gestational weight gain; ET, excessive tea; UT, usual tea.
Table 3. Poor gestational weight gain in association with tea drinking expressed by crude and adjusted relative risks (RRs)
Tea consump-
tion Crude RR Adjusted RRa) P-value Absence of tea
consumption
Ref. Ref. Ref.
ET group 1.84 (0.85–2.43) 1.25 (0.28–2.26) 0.43 UT group 1.10 (0.68–1.39) 0.92 (0.57–1.09) 0.78 Values are presented as RR (95% confidence interval).
ET, excessive tea; UT, usual tea.
a)Adjusted relative risk for risk factors including maternal age, weight, height, pre-gestation body mass index, parity, employment, educa- tion level, smoking, and daily energy intake.
Table 4. Neonatal characteristics Variables ET group
(n=41) UT group
(n=94) P-value
Sex 0.73
Male 21 (51.22) 52 (55.32)
Female 20 (48.78) 42 (44.68)
Birth weight (grams) 2,236±219 3,047±326 <0.05
SGA 32 (78.05) 5 (5.32) <0.05
Mode of delivery 0.68
Normal (vaginal) 28 (68.29) 61 (64.89) Cesarean section 13 (31.71) 33 (35.11)
Values are presented as number (%) or mean±standard deviation.
ET, excessive tea; UT, usual tea; SGA, small for gestational age.
at presentation and delivery. The second model (adjusted for social parameters including smoking, education level, and employment), and the third model (adjusted for all factors involved in the previous models) had RRs of 1.52 (0.71–2.50) and 1.46 (0.78–2.39), respectively, that were slightly lower than the crude and first models. All these findings are shown in Table 5.
Statistical significance was absent between the crude and adjusted models. For the first, second, and third adjusted models, the corresponding P-values were 0.58, 0.87, and 0.36, respectively.
Discussion
To the best of our knowledge, this is the first study to in- vestigate the influence of high tea consumption on GWG and neonatal birth weight. As previously mentioned, tea is a common beverage worldwide, and it is considered the most commonly used beverage after water [1-4].
The incidence of excessive tea consumption (≥1,500 mL/
day) in our sample was low (4.13%). Some scientists pub- lished further lower incidence of excessive tea consumption than what we have found (2.9%) in contrast to other scien- tists who documented a higher level of excessive tea drink- ing than our result (8.3%) [16,17]. These lower and higher rates were linked to caffeine consumption from sources not limited to tea, such as coffee.
In this cohort, the frequency of excessive tea consumption increased with the increase in maternal age and parity along with smoking and employment, similar to that reported in other studies [18-20].
The same holds true for individuals who are not pregnant
where increased consumption of tea is associated with older age, smoking status, and stress associated with employment [21,22].
Weight loss is associated with tea consumption, which in turn may cause anemia, thereby affecting the nutritional status of pregnant women and leading to inadequate GWG [23-26]; this is in line with our results of a significant nega- tive effect on GWG when consuming large amounts of tea during pregnancy even after adjustment for risk factors.
In addition, tea, especially when consumed excessively, is associated with decreased intestinal absorption of vitamin C and maternal dietary abnormalities affecting weight gain [27,28].
Birth outcomes are affected by the GWG. Fetal and neo- natal risks are expected with poor weight gain during preg- nancy caused by different factors [29,30].
In the present study, excessive tea consumption was sig- nificantly associated with LBW and SGA. Multiple logistic re- gression models were built to study the association between SGA and other previously measured independent variables to estimate the RR and statistical significance. In crude and all other adjusted models, RR was higher in the ET group, with no statistical significance. We could not find published data relating excessive tea consumption with birth parameters.
However, many reports have suggested that high maternal caffeine consumption (≥300 mg/day) was linked to SGA and other adverse pregnancy outcomes [19,31,32].
The tea consumed by our participants contained an aver- age caffeine levels of 0.31 mg/mg/mL [33], with a total of
≥465 mg/day in the ET group. This supports the above ob- servations.
Nevertheless, a large study from the United States revealed that caffeine from tea had attenuated results in comparison
Table 5. Small for gestational age in association with tea drinking expressed by crude and adjusted relative risk (RR)
Tea consumption Crude RR Adjusted RR
First modela) Second modelb) Third modelc)
Absence of tea consumption Ref. Ref. Ref. Ref.
ET group 1.53 (0.62–2.81) 1.56 (0.69–2.32) 1.52 (0.71–2.50) 1.46 (0.78–2.39)
UT group 0.98 (0.76–1.12) 1.18 (0.52–1.86) 1.09 (0.90–1.32) 1.03 (0.89–1.15)
Values are presented as RR (95% confidence interval).
ET, excessive tea; UT, usual tea.
a)First model was adjusted for maternal age, parity, pre-pregnancy body mass index, gestational weight gain, and gestational age in weeks at first antenatal visit, and delivery; b)Second model was adjusted for education level; either literate or illiterate, employment, and smoking habit;
c)Third model was adjusted for all parameters included in upper models.
with other sources such as coffee [34]. This may be related to the type of tea used and the different preparation techniques used. The World Health Organization has indicated a cut-off value of 300 mg/day of caffeine during pregnancy as an etio- logical risk for SGA [35]. However, other reports confirmed the absence of caffeine effects on pregnancy outcomes, in- cluding birth weight [19,36]. These variations could be partly due to differences in study methodology, caffeine consump- tion estimations, measurements of associated confounders, and possible adverse effects of polyphenols, the other major ingredients of tea.
The study of certain risk factors during gestation to predict adverse pregnancy parameters is a common scientific atti- tude [37,38]. Tea (as a risk factor during pregnancy) is not an exception, and has been studied by many researchers [19,20];
however, examining the effect of excessive tea consumption among pregnant women in the context of GWG and birth weight variations is novel and is the strength of this study.
Moreover, the strict follow-up of pregnant women through phone calls or direct visits throughout the study period and involving a large number of pregnant women in the initial screen are the other strengths of this study.
In contrast, this study has some limitations such as the absence of maternal anemia diagnosis, which might have helped in assisting our theory regarding poor GWG. In addi- tion, failure to add monthly income estimations, which could have been added to the previously mentioned confounders of GWG and neonatal birth weight for GA, is another limita- tion. In fact, background community beliefs made it difficult for researchers to obtain accurate financial data. The inability to precisely calculate the amount of daily tea consumption before pregnancy is another limitation.
In conclusion, excessive tea drinking (≥1,500 mL/day) throughout pregnancy has been linked to restrict maternal weight gain and neonatal weight at delivery with the final result of LBW and SGA.
Acknowledgements
The authors would like to express their deep thanks to medi- cal and editorial staff in the Department of Obstetrics and Gynaecology/Medical City Hospital in Baghdad for their kind support and encouragement.
Conflict of interest
No potential conflict of interest relevant to this article was reported.
Ethical approval
Ethical approval was obtained from the Scientific and Ethi- cal Committee of College of Medicine (No. 675), Al-Kindy College of Medicine (No. 381), at the University of Baghdad.
The study was conducted in accordance with the Helsinki Declaration.
Patient consent
Informed consent was obtained from all participants.
Funding information
None.
References
1. Karalexi MA, Dessypris N, Clavel J, Metayer C, Erdmann F, Orsi L, et al. Coffee and tea consumption during preg- nancy and risk of childhood acute myeloid leukemia: a Childhood Leukemia International Consortium (CLIC) study. Cancer Epidemiol 2019;62:101581.
2. Dey A, Gomes A, Dasgupta SC. Black tea (Camellia sinensis) extract induced changes in blood and liver pa- rameters on pregnant and lactating experimental albino rats. Proc Zool Soc 2019;72:25-31.
3. Vuong QV. Epidemiological evidence linking tea con- sumption to human health: a review. Crit Rev Food Sci Nutr 2014;54:523-36.
4. Kadhim Jasim S, Al-Momen H, Al-Asadi F. Maternal ane- mia prevalence and subsequent neonatal complications in Iraq. Open Access Maced J Med Sci 2020;8:71-5.
5. Badon SE, Miller RS, Qiu C, Sorensen TK, Williams MA, Enquobahrie DA. Maternal healthy lifestyle during early pregnancy and offspring birthweight: differences by off-
spring sex. J Matern Fetal Neonatal Med 2018;31:1111-7.
6. Brown SM, Aljefri K, Waas R, Hampton P. Systemic medications used in treatment of common dermatologi- cal conditions: safety profile with respect to pregnancy, breast feeding and content in seminal fluid. J Dermato- log Treat 2019;30:2-18.
7. Qian J, Chen Q, Ward SM, Duan E, Zhang Y. Impacts of caffeine during pregnancy. Trends Endocrinol Metab 2020;31:218-27.
8. Darakjian LI, Kaddoumi A. Physiologically based pharma- cokinetic/pharmacodynamic model for caffeine disposi- tion in pregnancy. Mol Pharm 2019;16:1340-9.
9. Hahn M, Baierle M, Charão MF, Bubols GB, Gravina FS, Zielinsky P, et al. Polyphenol-rich food general and on pregnancy effects: a review. Drug Chem Toxicol 2017;40:368-74.
10. Vazquez-Gomez M, Garcia-Contreras C, Torres-Rovira L, Pesantez JL, Gonzalez-Añover P, Gomez-Fidalgo E, et al.
Polyphenols and IUGR pregnancies: maternal hydroxy- tyrosol supplementation improves prenatal and early- postnatal growth and metabolism of the offspring. PLoS One 2017;12:e0177593.
11. Okubo H, Miyake Y, Tanaka K, Sasaki S, Hirota Y. Ma- ternal total caffeine intake, mainly from Japanese and Chinese tea, during pregnancy was associated with risk of preterm birth: the Osaka Maternal and Child Health Study. Nutr Res 2015;35:309-16.
12. Chen IJ, Liu CY, Chiu JP, Hsu CH. Therapeutic effect of high-dose green tea extract on weight reduction: a ran- domized, double-blind, placebo-controlled clinical trial.
Clin Nutr 2016;35:592-9.
13. Jiang AC, Chan EY, Jakate S, Shah N. Abstracts 1296:
Elevated CA 19-9 associated with heavy black tea con- sumption. Am J Gastroenterol 2019;114:S719-20.
14. Kadhim Jasim S, Al-Momen H, Majeed BA, Hussein MJ.
Rate of fetal macrosomia with maternal and early neo- natal complications in internally moved people affected by violence. Int J Med Res Health Sci 2018;7:141-6.
15. Al-Momen H, Muhammed MK, Alshaheen AA. Neonatal seizures in Iraq: cause and outcome. Tohoku J Exp Med 2018;246:245-9.
16. Vitti FP, Grandi C, Cavalli RC, Simões VM, Batista RF, Cardoso VC. Association between caffeine consumption in pregnancy and low birth weight and preterm birth in the birth Cohort of Ribeirão Preto. Rev Bras Ginecol Ob-
stet 2018;40:749-56.
17. Pacheco AH, Araujo DM, Lacerda EM, Kac G. Caffeine consumption by pregnant women selected from a Health Care Center in the municipality of Rio de Janeiro, Brazil. Rev Bras Ginecol Obstet 2008;30:232-40.
18. Dong Y, Zhang FD, Wang T, Yu HL, Ling WH, Cai MQ.
Tea drinking habits among residents in Beijing, Shanghai, and Guangzhou. J Environ Occup Med 2012;29:569-71.
19. van der Hoeven T, Browne JL, Uiterwaal CS, van der Ent CK, Grobbee DE, Dalmeijer GW. Antenatal cof- fee and tea consumption and the effect on birth out- come and hypertensive pregnancy disorders. PLoS One 2017;12:e0177619.
20. Lu JH, He JR, Shen SY, Wei XL, Chen NN, Yuan MY, et al.
Does tea consumption during early pregnancy have an adverse effect on birth outcomes? Birth 2017;44:281-9.
21. Chang CS, Chang YF, Liu PY, Chen CY, Tsai YS, Wu CH.
Smoking, habitual tea drinking and metabolic syndrome in elderly men living in rural community: the Tianliao old people (TOP) study 02. PLoS One 2012;7:e38874.
22. Al-Momen H, Hussein HK, Al-Attar Z, Hussein MJ. Green tea influence on iron overload in thalassemia interme- dia patients: a randomized controlled trial. F1000Res 2020;9:1136.
23. Rothenberg DO, Zhou C, Zhang L. A review on the weight-loss effects of oxidized tea polyphenols. Mol- ecules 2018;23:1176.
24. Machmud PB, Hatma RD, Syafiq A. Tea consumption and iron-deficiency anemia among pregnant woman in Bogor District, Indonesia. Indones J Micronutrient 2019;10:91-100.
25. Sato AP, Fujimori E. Nutritional status and weight gain in pregnant women. Rev Lat Am Enfermagem 2012;20:462-8.
26. Scholl TO, Hediger ML. Anemia and iron-deficiency ane- mia: compilation of data on pregnancy outcome. Am J Clin Nutr 1994;59:492S-500S.
27. Chen X, Zhao D, Mao X, Xia Y, Baker PN, Zhang H. Ma- ternal dietary patterns and pregnancy outcome. Nutri- ents 2016;8:351.
28. Shin D, Lee KW, Song WO. Dietary patterns during pregnancy are associated with gestational weight gain.
Matern Child Health J 2016;20:2527-38.
29. Goldstein RF, Abell SK, Ranasinha S, Misso M, Boyle JA, Black MH, et al. Association of gestational weight gain
with maternal and infant outcomes: a systematic review and meta-analysis. JAMA 2017;317:2207-25.
30. Kominiarek MA, Saade G, Mele L, Bailit J, Reddy UM, Wapner RJ, et al. Association between gestational weight gain and perinatal outcomes. Obstet Gynecol 2018;132:875-81.
31. Rhee J, Kim R, Kim Y, Tam M, Lai Y, Keum N, et al. Ma- ternal caffeine consumption during pregnancy and risk of low birth weight: a dose-response meta-analysis of observational studies. PLoS One 2015;10:e0132334.
32. Sasaki S, Limpar M, Sata F, Kobayashi S, Kishi R. Interac- tion between maternal caffeine intake during pregnancy and CYP1A2 C164A polymorphism affects infant birth size in the Hokkaido study. Pediatr Res 2017;82:19-28.
33. Abdul-Hussain DA, Hamad MN. Gravimetric estimation of caffeine in different commercial kinds of tea found in the Iraqi market. Iraqi J Pharm Sci 2010;19:48-53.
34. Hoyt AT, Browne M, Richardson S, Romitti P, Druschel C;
National Birth Defects Prevention Study. Maternal caf-
feine consumption and small for gestational age births:
results from a population-based case-control study. Ma- tern Child Health J 2014;18:1540-51.
35. Sengpiel V, Elind E, Bacelis J, Nilsson S, Grove J, Myhre R, et al. Maternal caffeine intake during pregnancy is asso- ciated with birth weight but not with gestational length:
results from a large prospective observational cohort study. BMC Med 2013;11:42.
36. Jarosz M, Wierzejska R, Siuba M. Maternal caffeine in- take and its effect on pregnancy outcomes. Eur J Obstet Gynecol Reprod Biol 2012;160:156-60.
37. Kadhim Jasim S, Al-Momen H, Al-Naddawi AM. Predic- tion of maternal diabetes and adverse neonatal outcome in normotensive pregnancy using serum uric acid. Int J Res Pharm Sci 2019;10:3563-9.
38. Ha S, Hu H, Roussos-Ross D, Haidong K, Roth J, Xu X.
The effects of air pollution on adverse birth outcomes.
Environ Res 2014;134:198-204.